| Param | Original file | Final file |
|---|---|---|
| Filename | modeM0/AS1C03_006T01_9000001608_11049cztM0_level2.evt | modeM0/AS1C03_006T01_9000001608_11049cztM0_level2_quad_clean.evt |
| Size (bytes) | 440,228,160 | 38,589,120 |
| Size | 419.8 MB | 36.8 MB |
| Events in quadrant A | 6,104,815 | 188,963 |
| Events in quadrant B | 2,680,055 | 240,180 |
| Events in quadrant C | 1,842,681 | 243,333 |
| Events in quadrant D | 2,448,580 | 228,793 |
| Mode M9 | |||
|---|---|---|---|
| Quadrant | BADHDUFLAG | Total packets | Discarded packets |
| A | 0 | 2 | 0 |
| B | 0 | 2 | 0 |
| C | 0 | 2 | 0 |
| D | 0 | 2 | 0 |
| Mode M0 | |||
|---|---|---|---|
| Quadrant | BADHDUFLAG | Total packets | Discarded packets |
| A | 0 | 20736 | 3 |
| B | 0 | 10392 | 2 |
| C | 0 | 7931 | 2 |
| D | 0 | 9693 | 2 |
| Mode SS | |||
|---|---|---|---|
| Quadrant | BADHDUFLAG | Total packets | Discarded packets |
| A | 0 | 78 | 0 |
| B | 0 | 78 | 0 |
| C | 0 | 78 | 0 |
| D | 0 | 78 | 0 |
| Quadrant | Total seconds | Saturated seconds | Saturation percentage |
|---|---|---|---|
| A | 3762 | 1931 | 51.329080% |
| B | 3762 | 278 | 7.389686% |
| C | 3762 | 33 | 0.877193% |
| D | 3762 | 108 | 2.870813% |
Noise dominated data is calculated using 1-second bins in cleaned event files. If a bin has >2000 counts, and if more than 50% of those come from <1% of pixels, then it is considered to be noise-dominated and hence unusable.
| Quadrant | # 1 sec bins | Bins with >0 counts | Bins with >2000 counts | High rate bins dominated by noise | Noise dominated (total time) | Noise dominated (detector-on time) | Marked lightcurve |
|---|---|---|---|---|---|---|---|
| A | 3997 | 3763 | 1360 | 1360 | 34.03% | 36.14% | 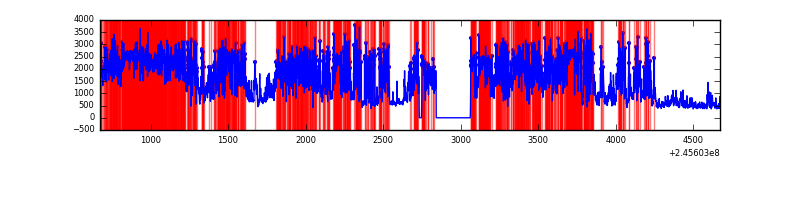 |
| B | 3997 | 3764 | 92 | 92 | 2.30% | 2.44% |  |
| C | 3997 | 3764 | 1 | 1 | 0.03% | 0.03% | 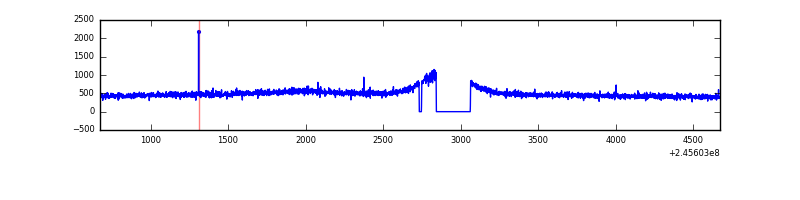 |
| D | 3997 | 3764 | 59 | 59 | 1.48% | 1.57% | 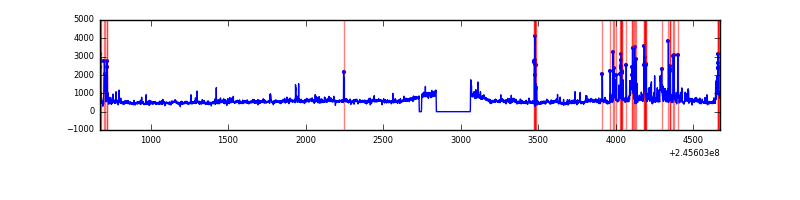 |
Top three noisy pixels from each quadrant. If the there are fewer than three noisy pixels in the level2.evt file, extra rows are filled as -1
| Pixel properties | Quadrant properties | ||||||
|---|---|---|---|---|---|---|---|
| Quadrant | DetID | PixID | Counts | Sigma | Mean | Median | Sigma |
| A | 14 | 238 | 3717831 | 45528.15 | 387 | 378 | 81.7 |
| A | 15 | 174 | 889171 | 10885.17 | 387 | 378 | 81.7 |
| A | 14 | 254 | 6477 | 74.7 | 387 | 378 | 81.7 |
| B | 4 | 239 | 721468 | 7605.54 | 477 | 465 | 94.8 |
| B | 0 | 187 | 41689 | 434.85 | 477 | 465 | 94.8 |
| B | 0 | 214 | 22316 | 230.5 | 477 | 465 | 94.8 |
| C | 8 | 128 | 3971 | 31.54 | 470 | 470 | 111.0 |
| C | 13 | 61 | 3575 | 27.97 | 470 | 470 | 111.0 |
| C | 9 | 54 | 2442 | 17.76 | 470 | 470 | 111.0 |
| D | 8 | 195 | 204707 | 1783.59 | 467 | 453 | 114.5 |
| D | 14 | 34 | 116207 | 1010.79 | 467 | 453 | 114.5 |
| D | 13 | 104 | 99309 | 863.23 | 467 | 453 | 114.5 |
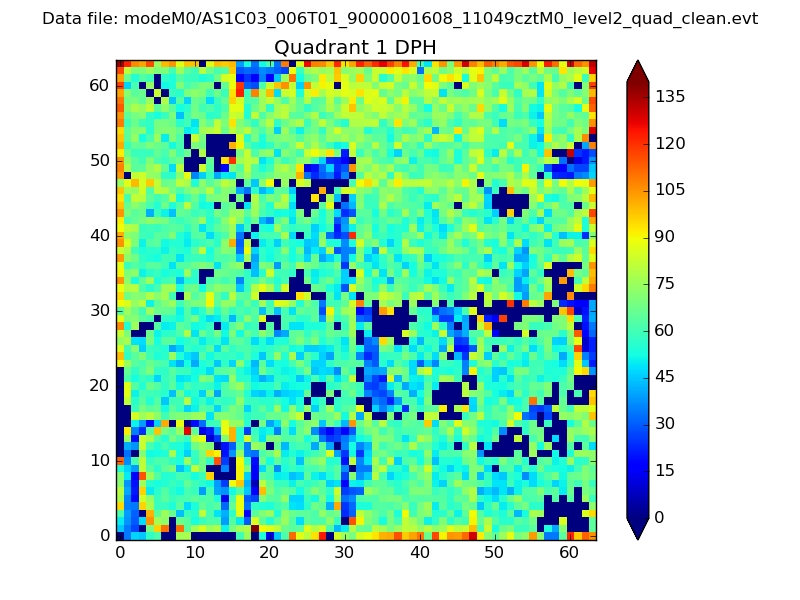
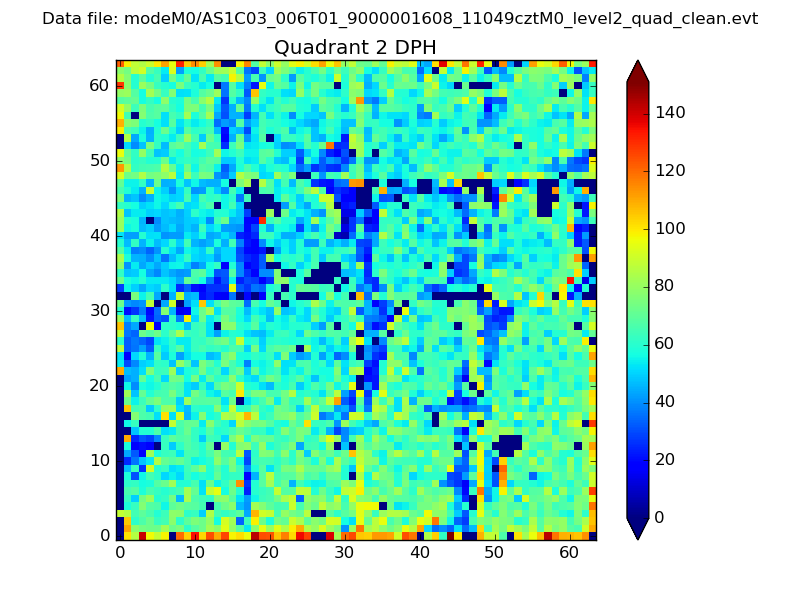
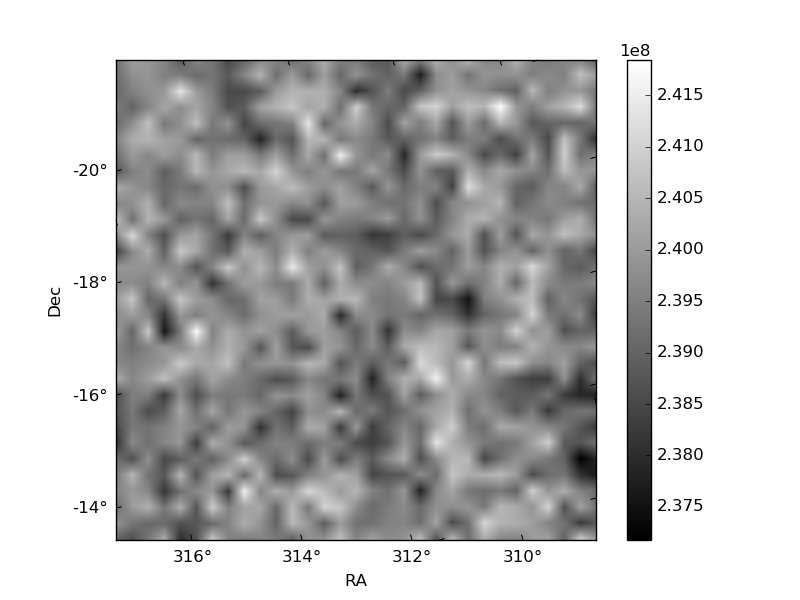
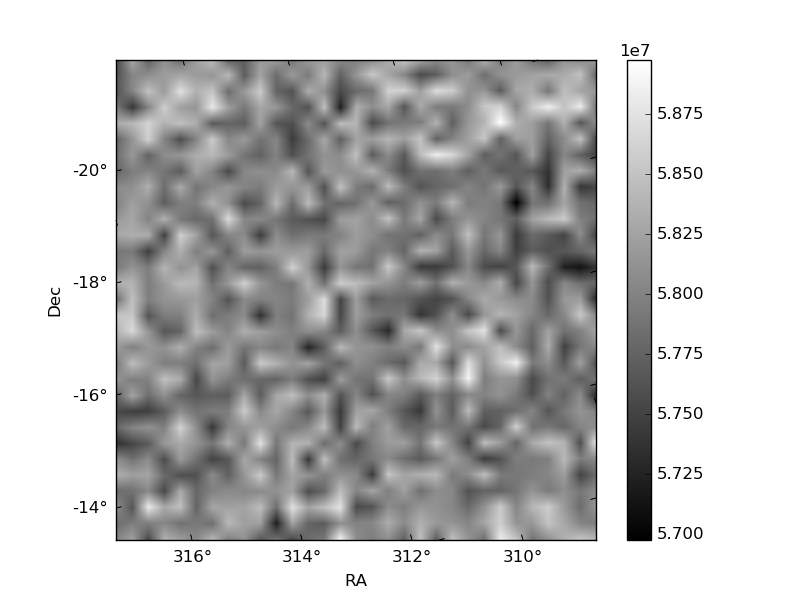
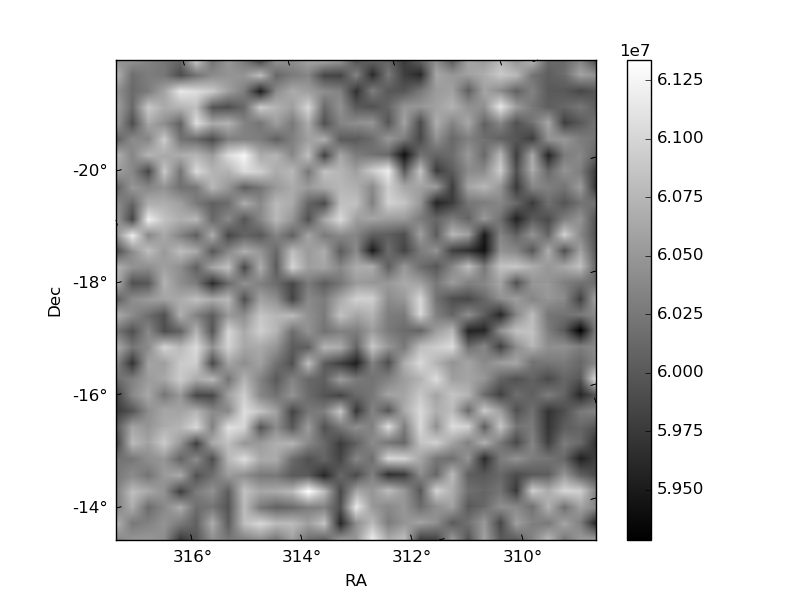
Histogram calculated using DETX and DETY for each event in the final _common_clean file
| Quadrant A | 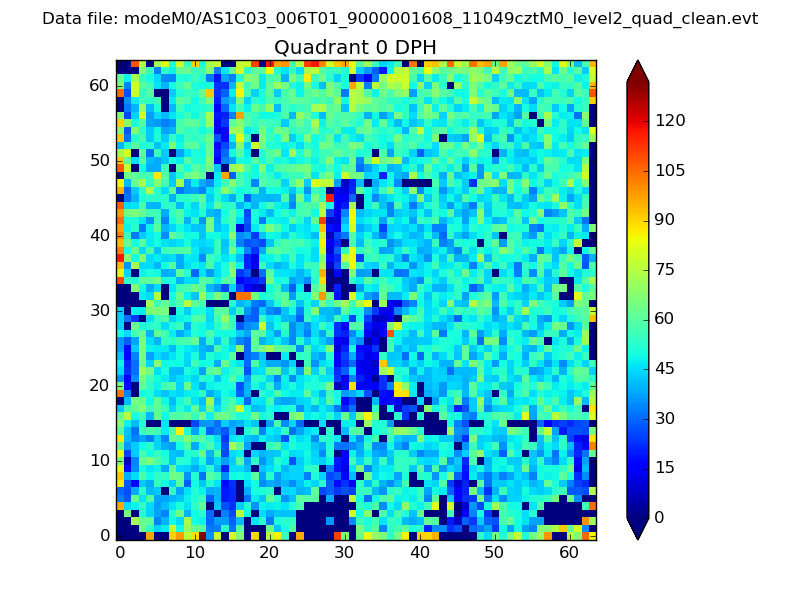 |
 |
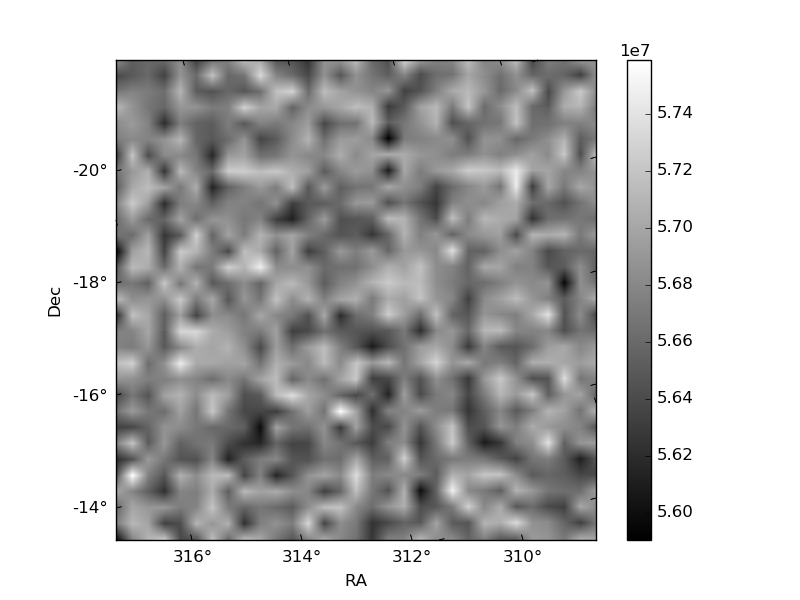
Quadrant B |
|---|---|---|---|
| Quadrant D | 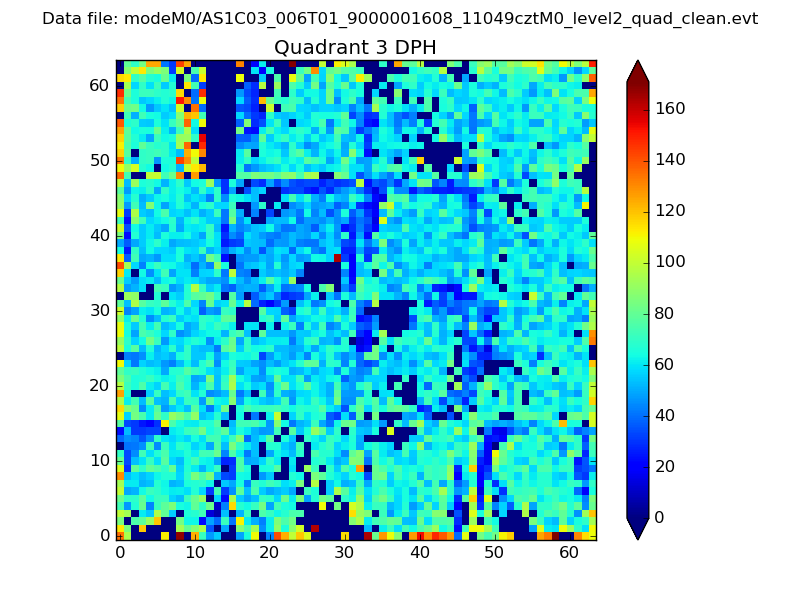 |
 |
Quadrant C |
| Plot type | Count rate plots | Images |
|---|---|---|
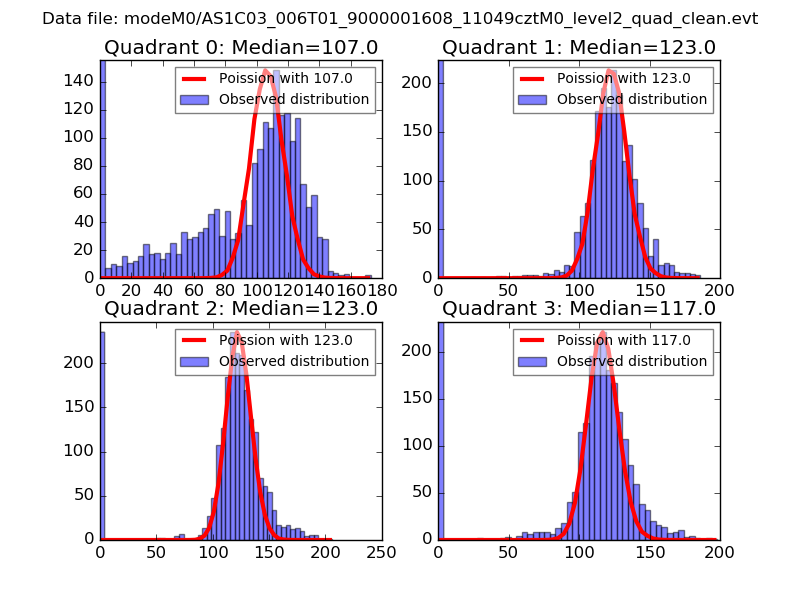
| Comparison with Poisson distribution Blue bars denote a histogram of data divided into 1 sec bins. Red curve is a Poisson curve with rate = median count rate of data. |
 |
 |
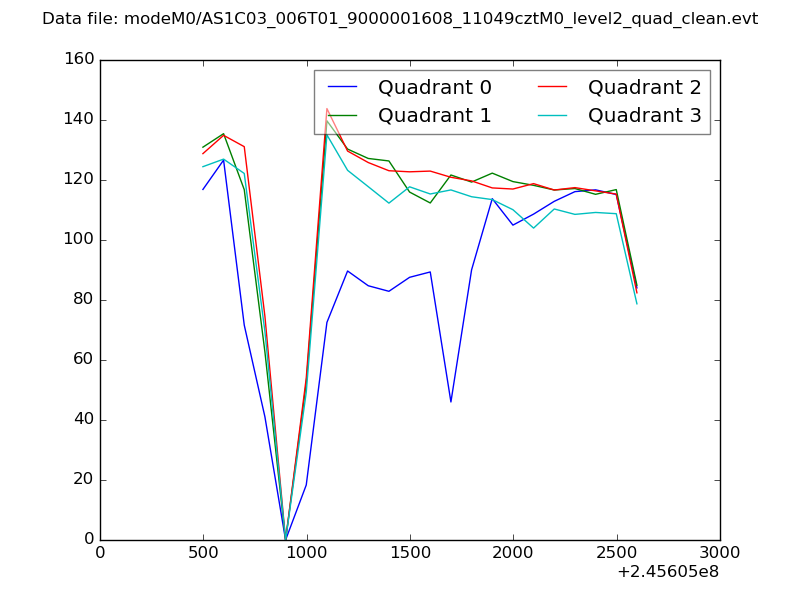
| Quadrant-wise count rates Data is divided into 100 sec bins |
 |
|
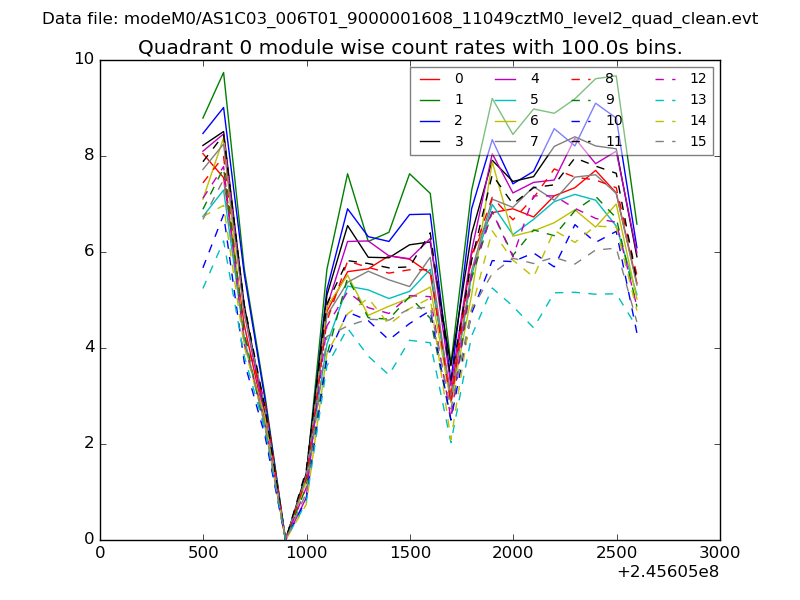
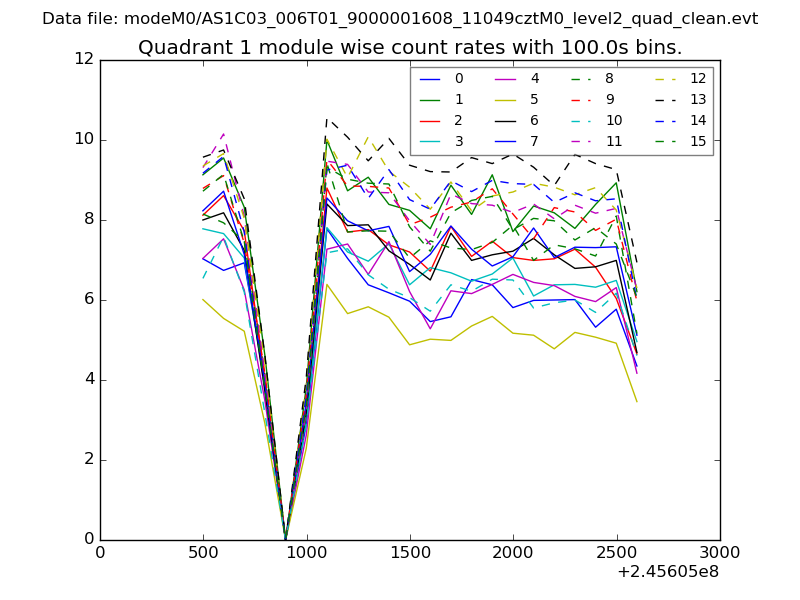
| Module-wise count rates for Quadrant A Data is divided into 100 sec bins |
 |
 |
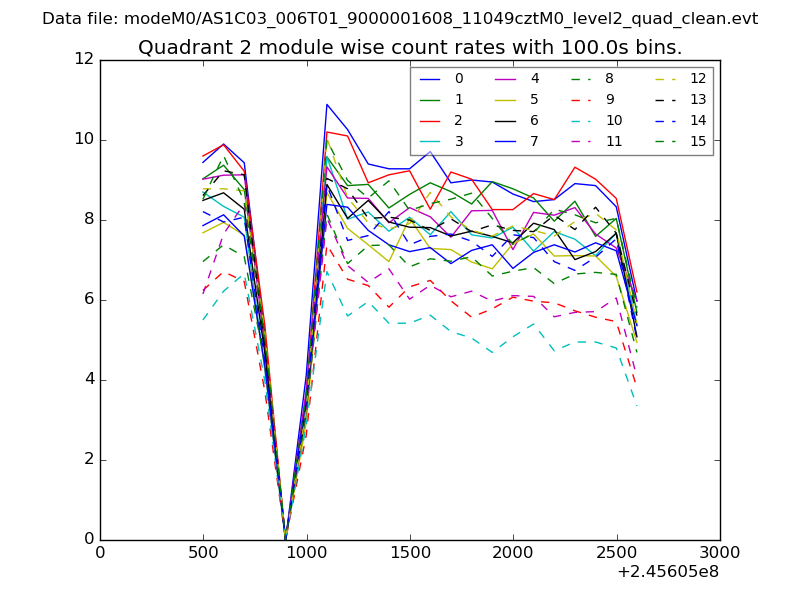
| Module-wise count rates for Quadrant B Data is divided into 100 sec bins |
 |
 |
| Module-wise count rates for Quadrant C Data is divided into 100 sec bins |
 |
 |
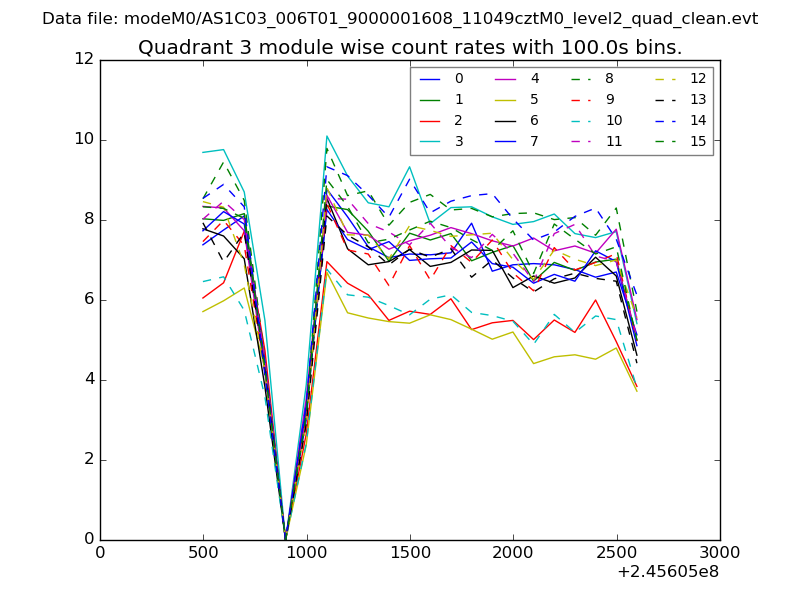
| Module-wise count rates for Quadrant D Data is divided into 100 sec bins |
 |
 |
| Parameter | Plot |
|---|---|
| CZT HV Monitor | 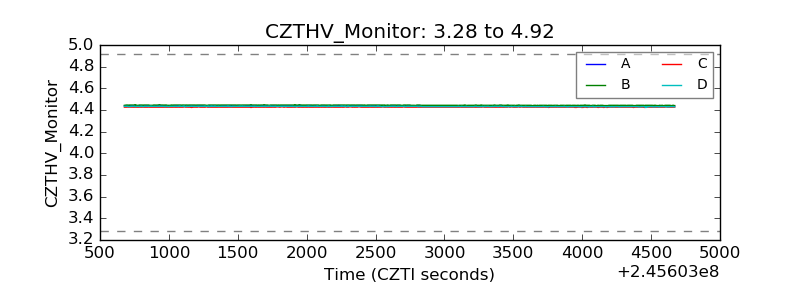 |
| D_VDD | 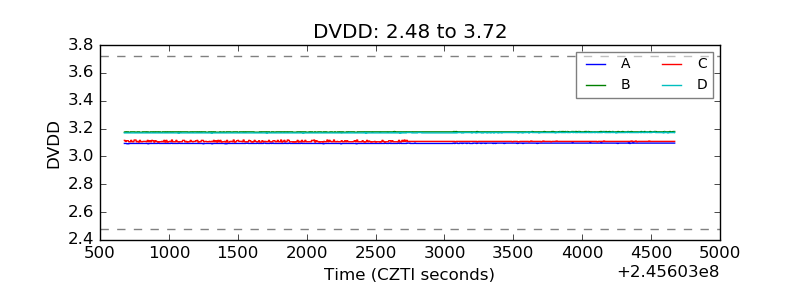 |
| Temperature 1 |  |
| Veto HV Monitor | 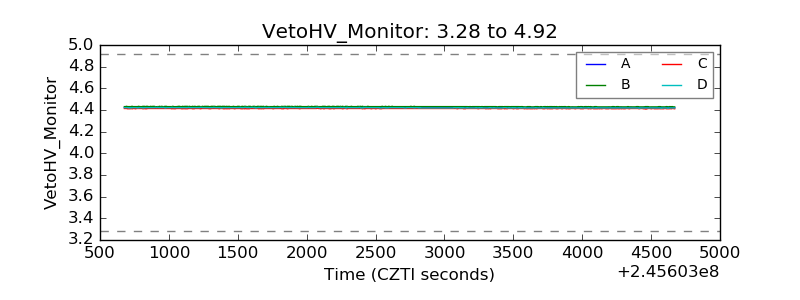 |
| Veto LLD |  |
| Alpha Counter | 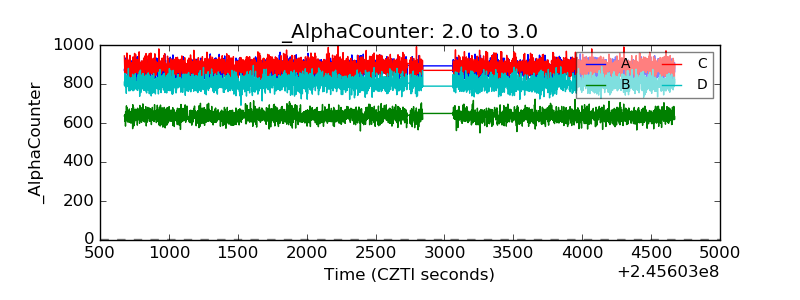 |
| _CPM_Rate | 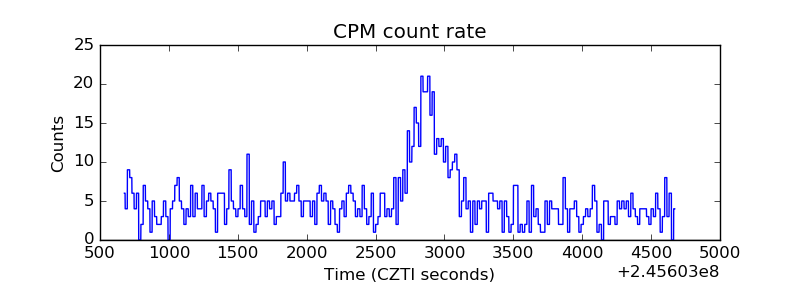 |
| CZT Counter | 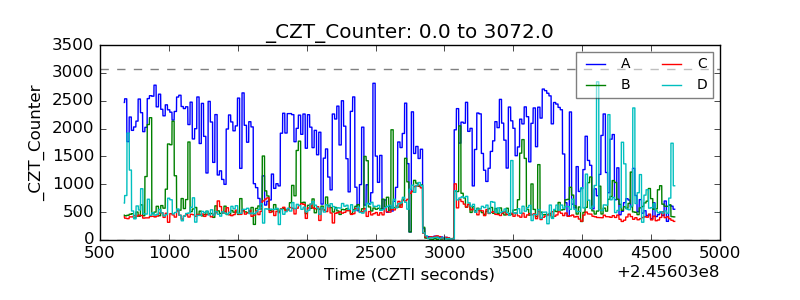 |
| +2.5 Volts monitor |  |
| +5 Volts monitor |  |
| _ROLL_ROT | 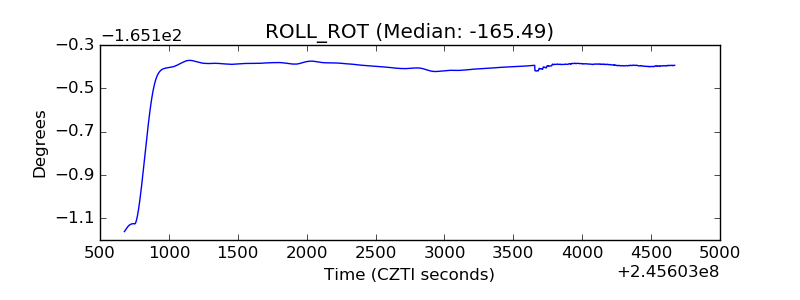 |
| _Roll_DEC | 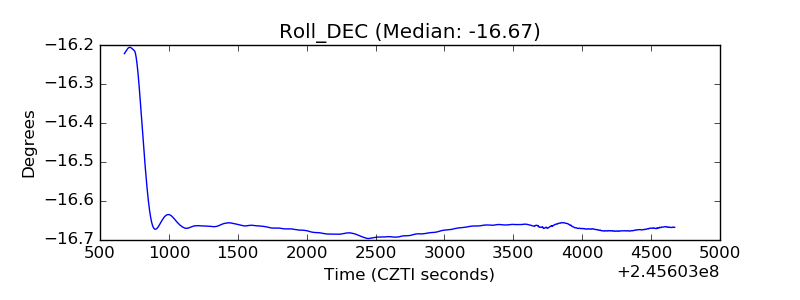 |
| _Roll_RA | 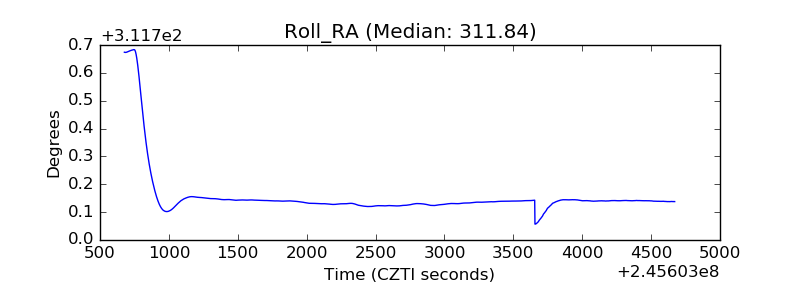 |
| Veto Counter | 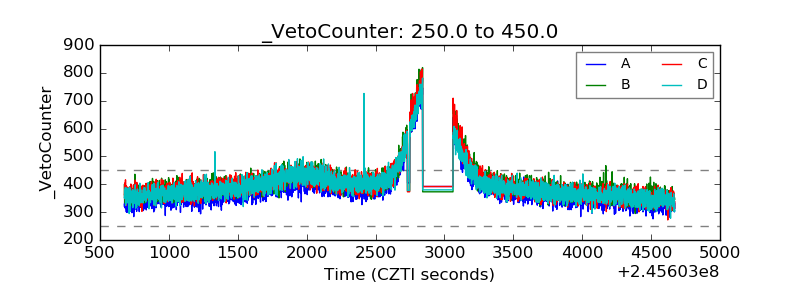 |