| Param | Original file | Final file |
|---|---|---|
| Filename | modeM0/AS1C03_006T01_9000001608_11051cztM0_level2.evt | modeM0/AS1C03_006T01_9000001608_11051cztM0_level2_quad_clean.evt |
| Size (bytes) | 1,077,946,560 | 130,104,000 |
| Size | 1.0 GB | 124.1 MB |
| Events in quadrant A | 11,553,003 | 737,098 |
| Events in quadrant B | 7,326,611 | 816,148 |
| Events in quadrant C | 5,101,505 | 821,724 |
| Events in quadrant D | 7,896,953 | 776,369 |
| Mode M9 | |||
|---|---|---|---|
| Quadrant | BADHDUFLAG | Total packets | Discarded packets |
| A | 0 | 4 | 0 |
| B | 0 | 4 | 0 |
| C | 0 | 4 | 0 |
| D | 0 | 4 | 0 |
| Mode M0 | |||
|---|---|---|---|
| Quadrant | BADHDUFLAG | Total packets | Discarded packets |
| A | 0 | 42208 | 2 |
| B | 0 | 29300 | 1 |
| C | 0 | 23332 | 1 |
| D | 0 | 31203 | 1 |
| Mode SS | |||
|---|---|---|---|
| Quadrant | BADHDUFLAG | Total packets | Discarded packets |
| A | 0 | 230 | 0 |
| B | 0 | 230 | 0 |
| C | 0 | 230 | 0 |
| D | 0 | 230 | 0 |
| Quadrant | Total seconds | Saturated seconds | Saturation percentage |
|---|---|---|---|
| A | 11389 | 1594 | 13.995961% |
| B | 11389 | 426 | 3.740451% |
| C | 11389 | 47 | 0.412679% |
| D | 11389 | 158 | 1.387304% |
Noise dominated data is calculated using 1-second bins in cleaned event files. If a bin has >2000 counts, and if more than 50% of those come from <1% of pixels, then it is considered to be noise-dominated and hence unusable.
| Quadrant | # 1 sec bins | Bins with >0 counts | Bins with >2000 counts | High rate bins dominated by noise | Noise dominated (total time) | Noise dominated (detector-on time) | Marked lightcurve |
|---|---|---|---|---|---|---|---|
| A | 11809 | 11390 | 1088 | 1088 | 9.21% | 9.55% | 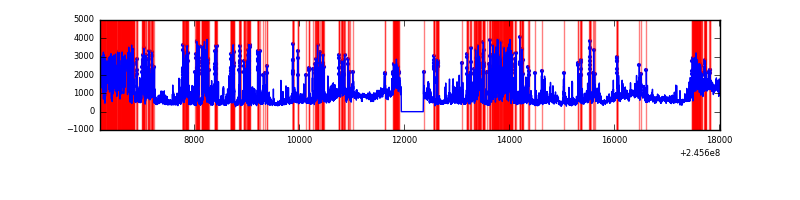 |
| B | 11809 | 11390 | 224 | 224 | 1.90% | 1.97% | 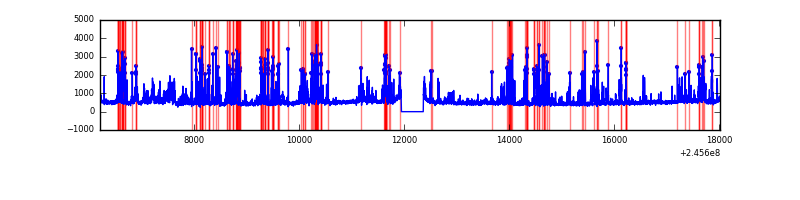 |
| C | 11809 | 11390 | 19 | 19 | 0.16% | 0.17% |  |
| D | 11809 | 11390 | 127 | 127 | 1.08% | 1.12% | 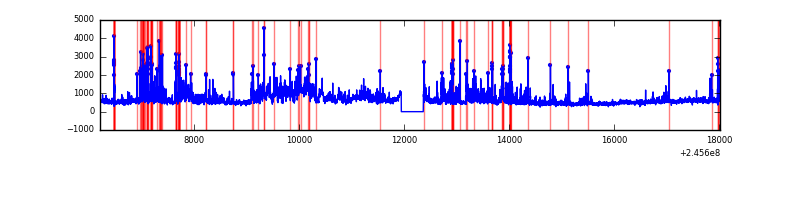 |
Top three noisy pixels from each quadrant. If the there are fewer than three noisy pixels in the level2.evt file, extra rows are filled as -1
| Pixel properties | Quadrant properties | ||||||
|---|---|---|---|---|---|---|---|
| Quadrant | DetID | PixID | Counts | Sigma | Mean | Median | Sigma |
| A | 14 | 238 | 5149433 | 19886.59 | 1262 | 1233 | 258.9 |
| A | 15 | 174 | 1518247 | 5859.96 | 1262 | 1233 | 258.9 |
| A | 13 | 210 | 21955 | 80.04 | 1262 | 1233 | 258.9 |
| B | 4 | 239 | 2006817 | 7883.63 | 1322 | 1289 | 254.4 |
| B | 0 | 214 | 36400 | 138.02 | 1322 | 1289 | 254.4 |
| B | 0 | 187 | 36260 | 137.47 | 1322 | 1289 | 254.4 |
| C | 9 | 54 | 65687 | 214.39 | 1289 | 1295 | 300.4 |
| C | 13 | 61 | 9584 | 27.6 | 1289 | 1295 | 300.4 |
| C | 12 | 4 | 6757 | 18.19 | 1289 | 1295 | 300.4 |
| D | 1 | 52 | 1173147 | 3744.03 | 1279 | 1241 | 313.0 |
| D | 8 | 195 | 629046 | 2005.72 | 1279 | 1241 | 313.0 |
| D | 11 | 129 | 363902 | 1158.64 | 1279 | 1241 | 313.0 |
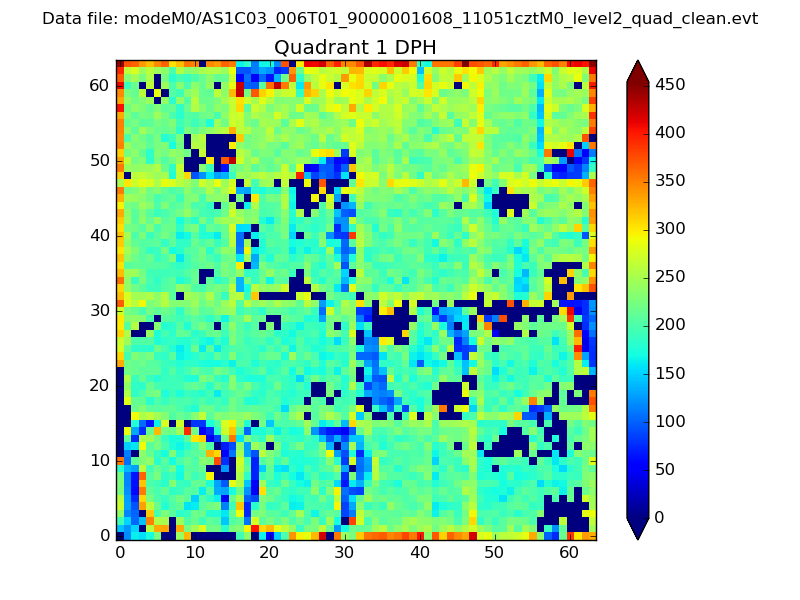
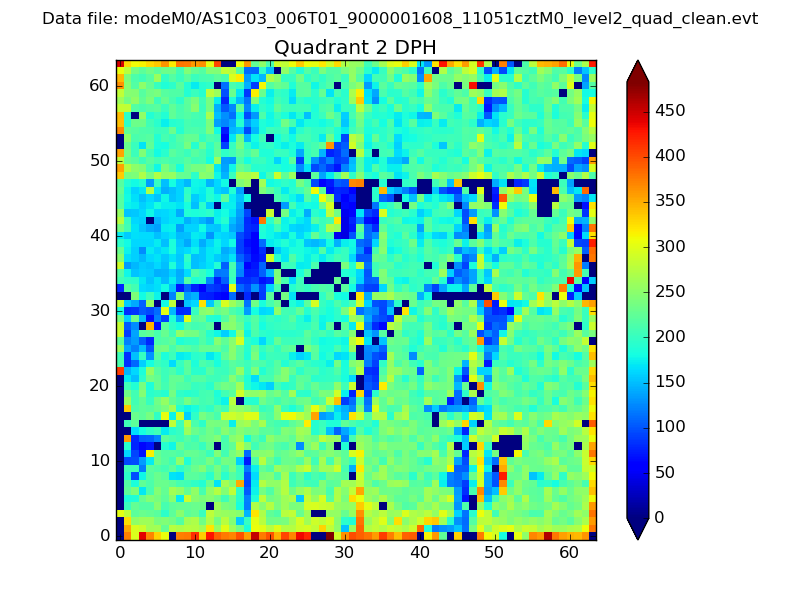
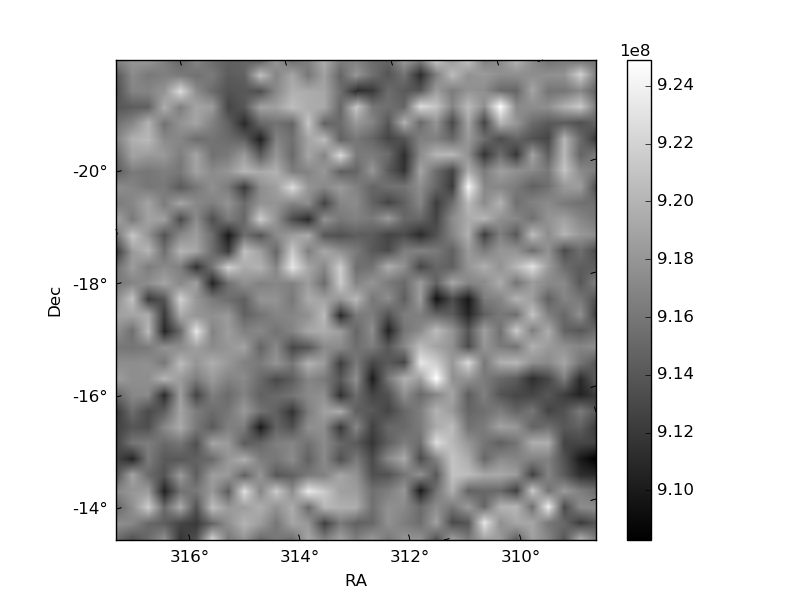
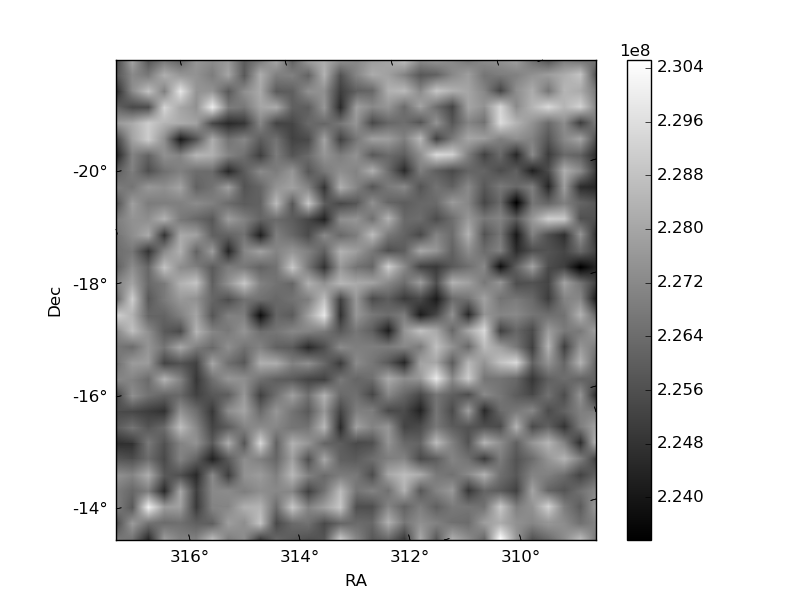
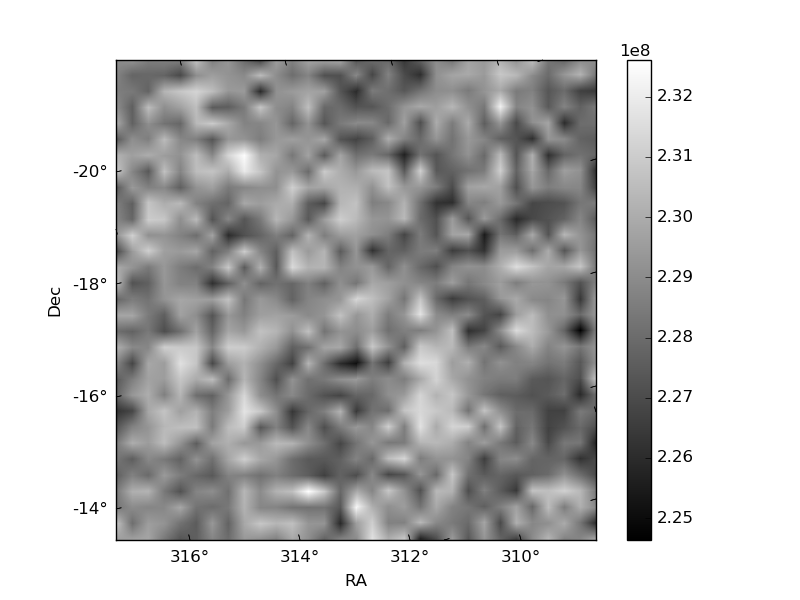
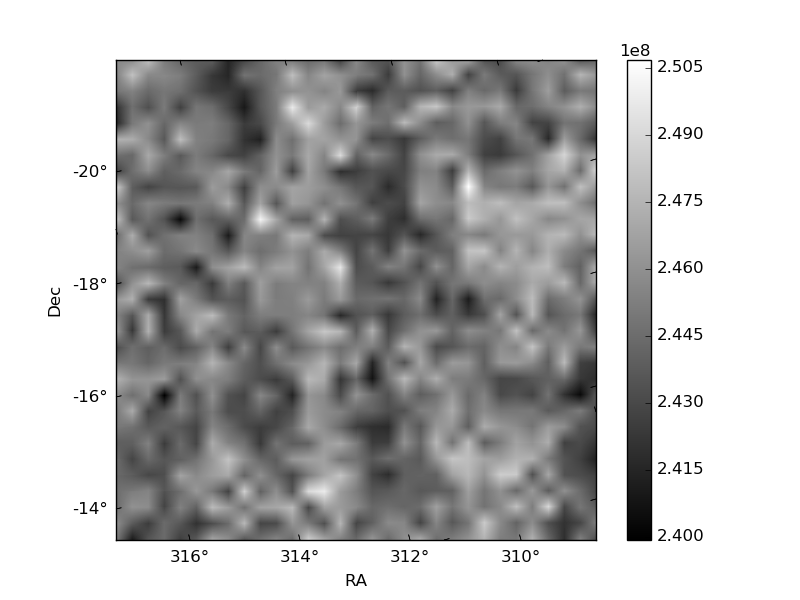
Histogram calculated using DETX and DETY for each event in the final _common_clean file
| Quadrant A | 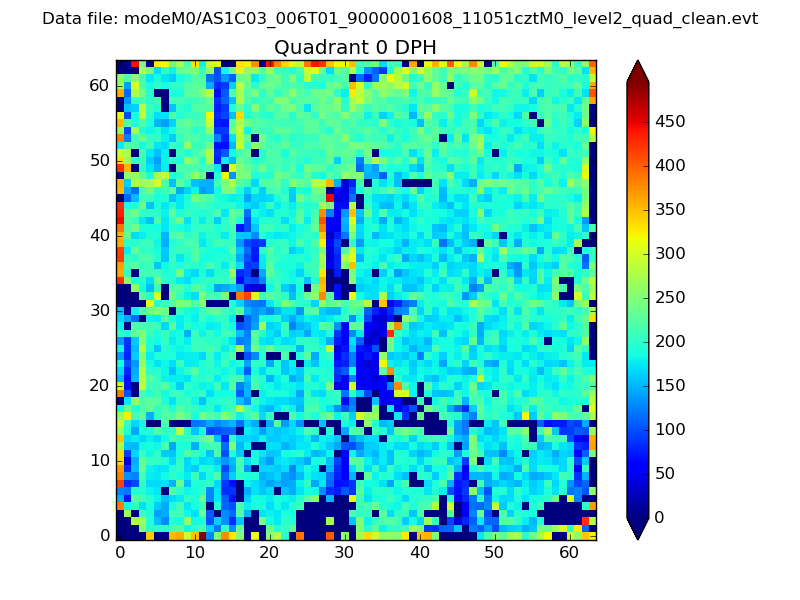 |
 |
Quadrant B |
|---|---|---|---|
| Quadrant D | 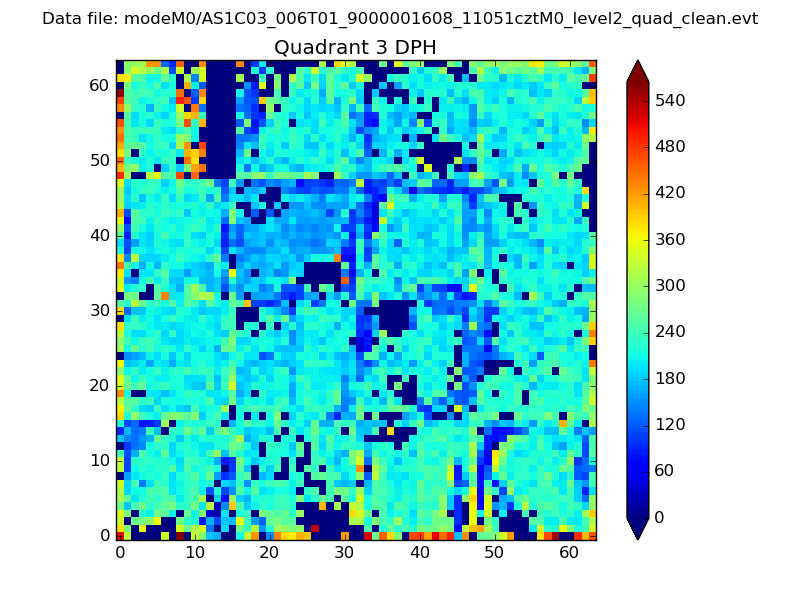 |
 |
Quadrant C |
| Plot type | Count rate plots | Images |
|---|---|---|
| Comparison with Poisson distribution Blue bars denote a histogram of data divided into 1 sec bins. Red curve is a Poisson curve with rate = median count rate of data. |
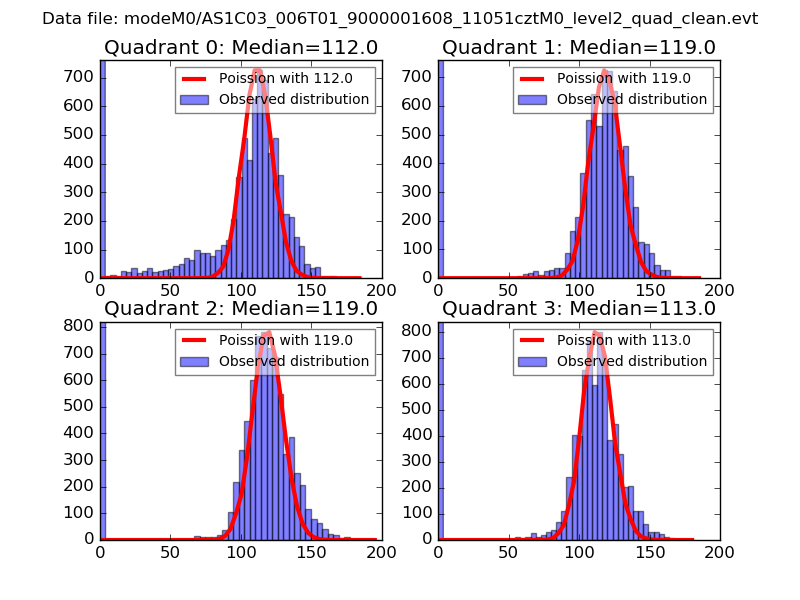 |
 |
| Quadrant-wise count rates Data is divided into 100 sec bins |
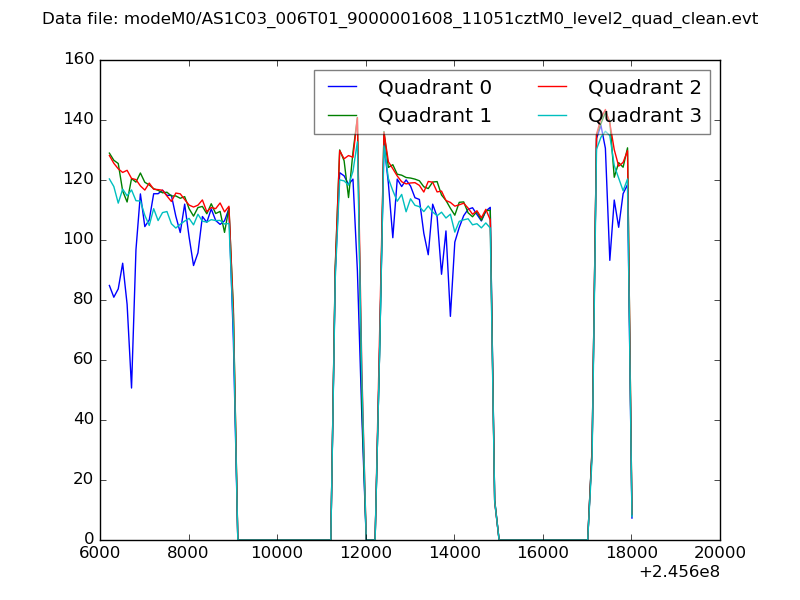 |
|
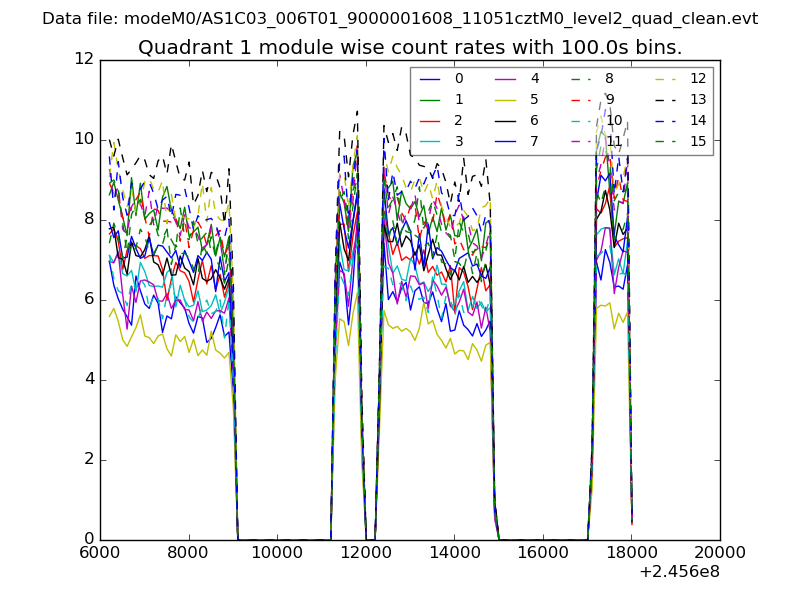
| Module-wise count rates for Quadrant A Data is divided into 100 sec bins |
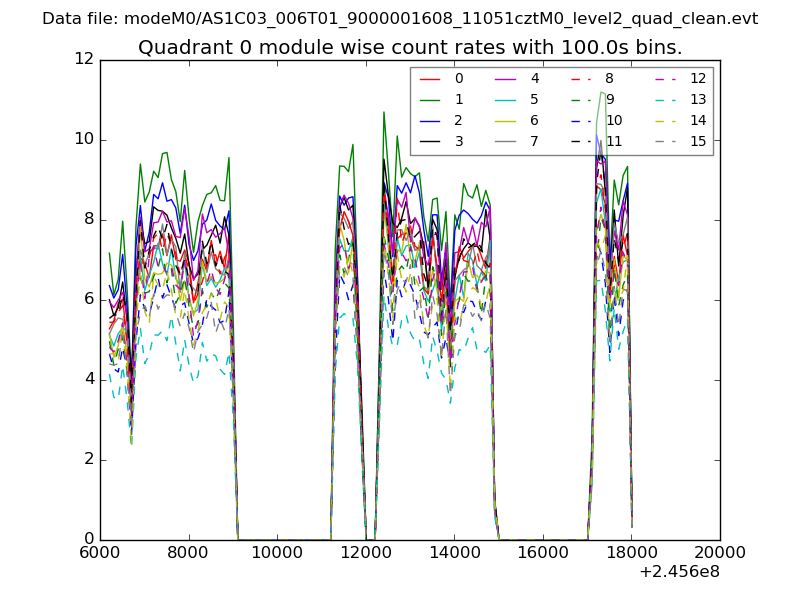 |
 |
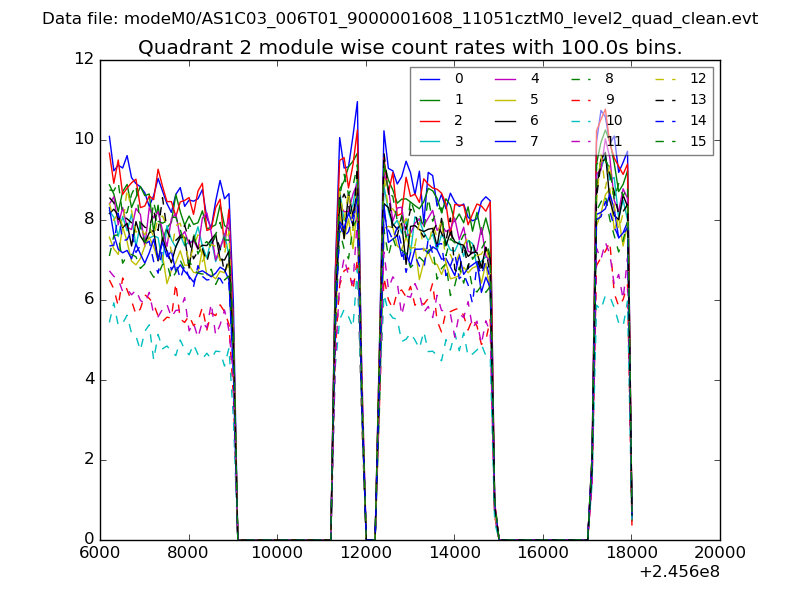
| Module-wise count rates for Quadrant B Data is divided into 100 sec bins |
 |
 |
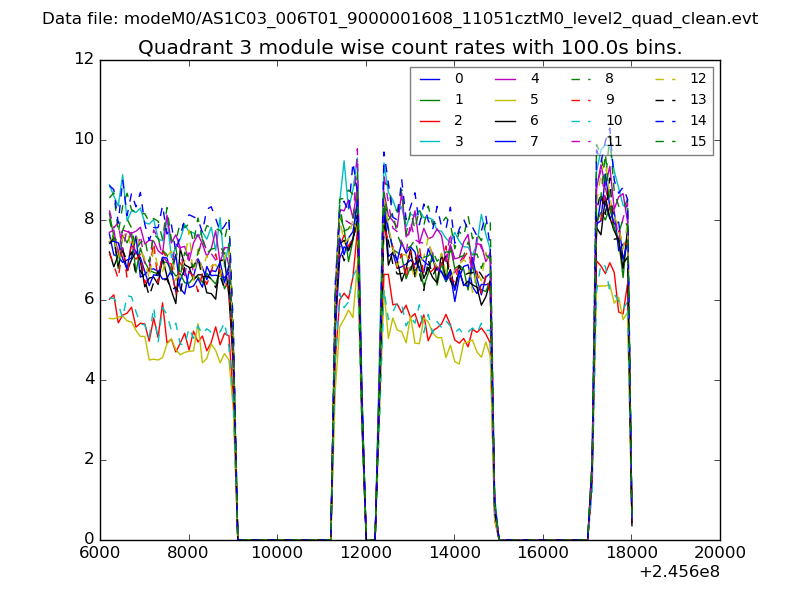
| Module-wise count rates for Quadrant C Data is divided into 100 sec bins |
 |
 |
| Module-wise count rates for Quadrant D Data is divided into 100 sec bins |
 |
 |
| Parameter | Plot |
|---|---|
| CZT HV Monitor | 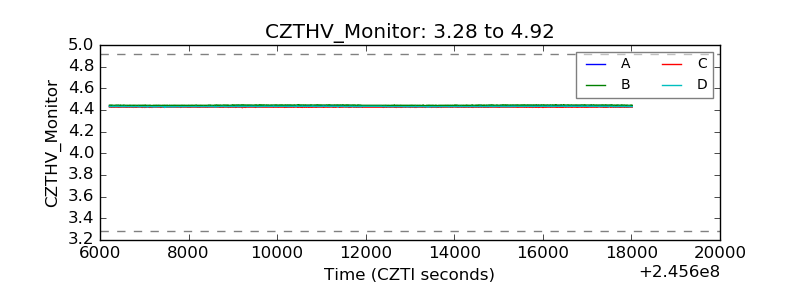 |
| D_VDD | 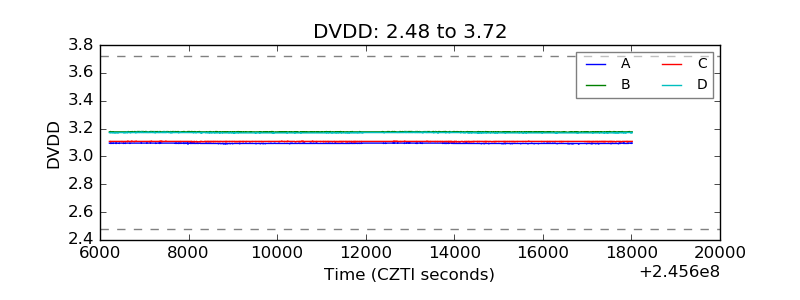 |
| Temperature 1 | 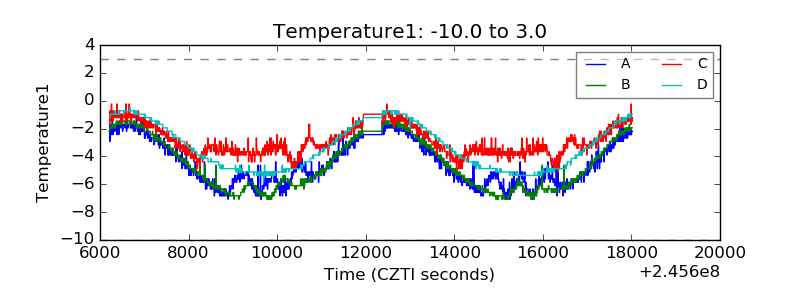 |
| Veto HV Monitor | 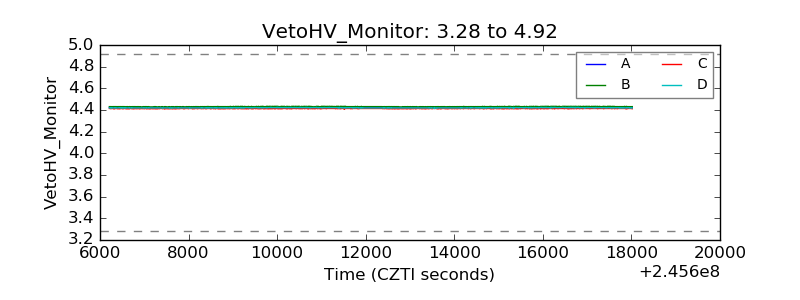 |
| Veto LLD | 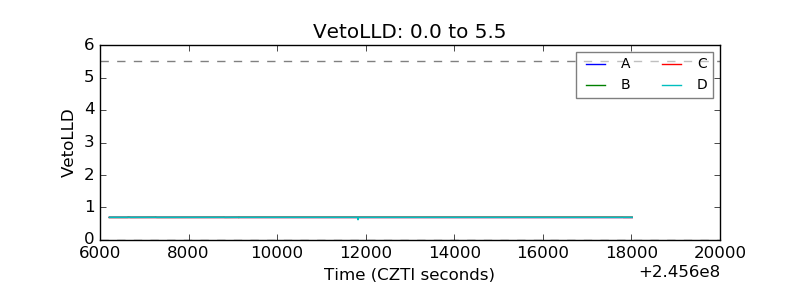 |
| Alpha Counter | 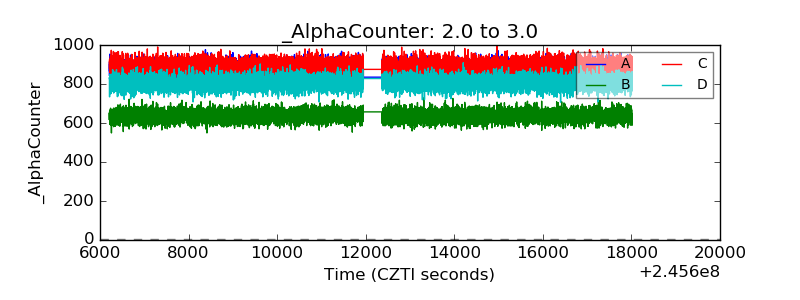 |
| _CPM_Rate | 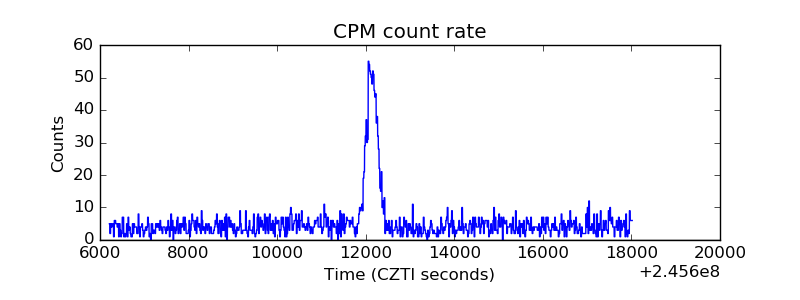 |
| CZT Counter | 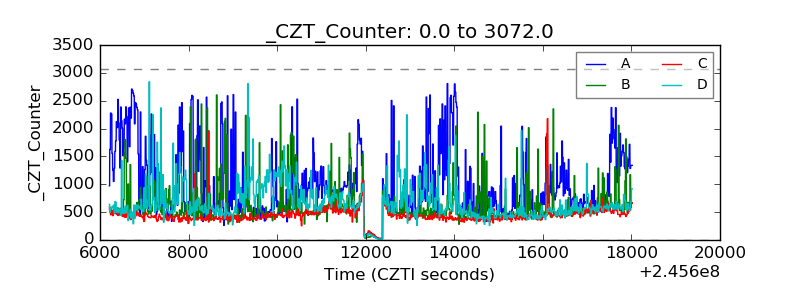 |
| +2.5 Volts monitor |  |
| +5 Volts monitor | 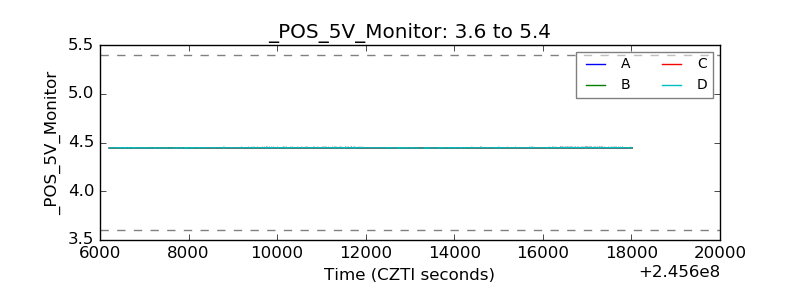 |
| _ROLL_ROT | 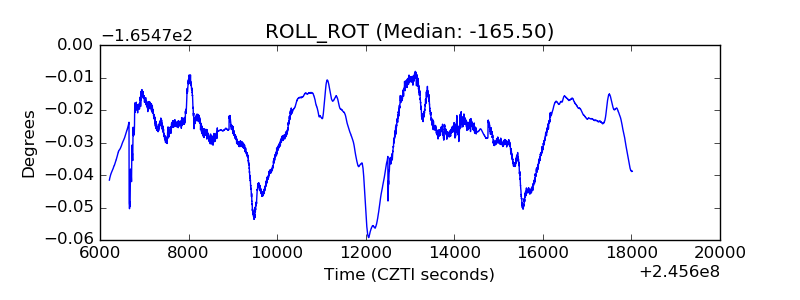 |
| _Roll_DEC | 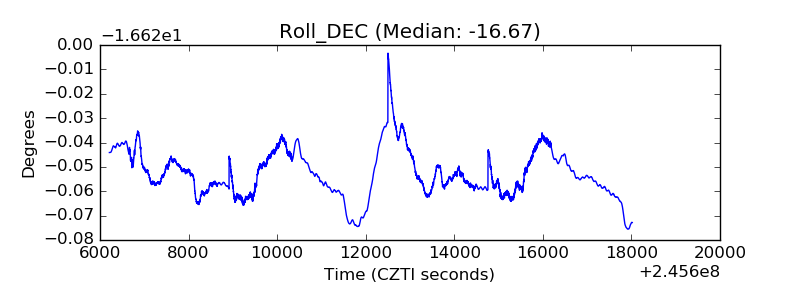 |
| _Roll_RA | 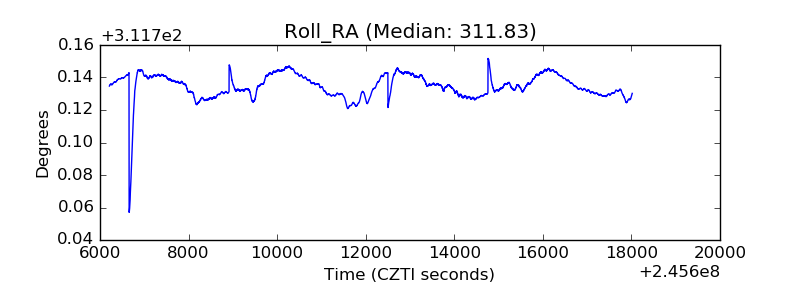 |
| Veto Counter | 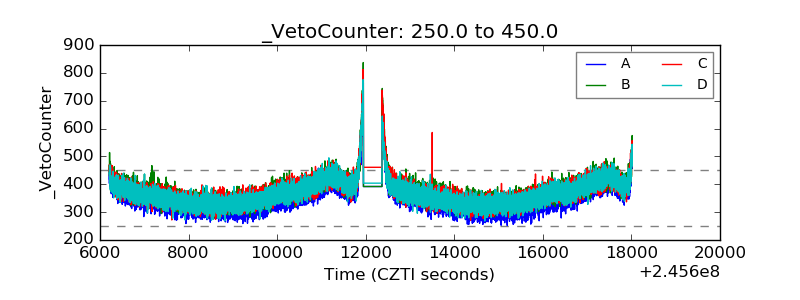 |