| Param | Original file | Final file |
|---|---|---|
| Filename | modeM0/AS1C03_006T01_9000001608_11055cztM0_level2.evt | modeM0/AS1C03_006T01_9000001608_11055cztM0_level2_quad_clean.evt |
| Size (bytes) | 578,977,920 | 77,371,200 |
| Size | 552.2 MB | 73.8 MB |
| Events in quadrant A | 5,123,076 | 467,104 |
| Events in quadrant B | 4,533,653 | 480,470 |
| Events in quadrant C | 2,996,351 | 481,039 |
| Events in quadrant D | 4,435,026 | 454,594 |
| Mode M9 | |||
|---|---|---|---|
| Quadrant | BADHDUFLAG | Total packets | Discarded packets |
| A | 0 | 13 | 0 |
| B | 0 | 13 | 0 |
| C | 0 | 13 | 0 |
| D | 0 | 14 | 0 |
| Mode M0 | |||
|---|---|---|---|
| Quadrant | BADHDUFLAG | Total packets | Discarded packets |
| A | 0 | 19676 | 3 |
| B | 0 | 17728 | 2 |
| C | 0 | 13389 | 2 |
| D | 0 | 17520 | 2 |
| Mode SS | |||
|---|---|---|---|
| Quadrant | BADHDUFLAG | Total packets | Discarded packets |
| A | 0 | 132 | 0 |
| B | 0 | 132 | 0 |
| C | 0 | 132 | 0 |
| D | 0 | 132 | 0 |
| Quadrant | Total seconds | Saturated seconds | Saturation percentage |
|---|---|---|---|
| A | 6595 | 344 | 5.216073% |
| B | 6595 | 292 | 4.427597% |
| C | 6595 | 13 | 0.197119% |
| D | 6595 | 290 | 4.397271% |
Noise dominated data is calculated using 1-second bins in cleaned event files. If a bin has >2000 counts, and if more than 50% of those come from <1% of pixels, then it is considered to be noise-dominated and hence unusable.
| Quadrant | # 1 sec bins | Bins with >0 counts | Bins with >2000 counts | High rate bins dominated by noise | Noise dominated (total time) | Noise dominated (detector-on time) | Marked lightcurve |
|---|---|---|---|---|---|---|---|
| A | 7735 | 6596 | 276 | 276 | 3.57% | 4.18% |  |
| B | 7735 | 6596 | 190 | 190 | 2.46% | 2.88% |  |
| C | 7735 | 6596 | 0 | 0 | 0.00% | 0.00% | 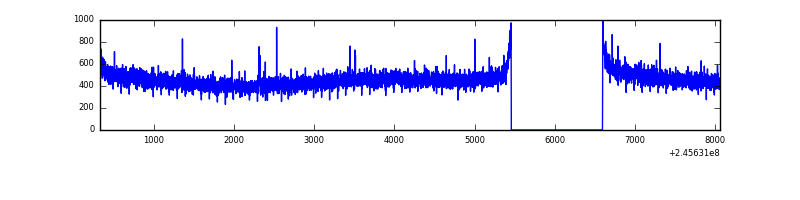 |
| D | 7735 | 6596 | 237 | 237 | 3.06% | 3.59% | 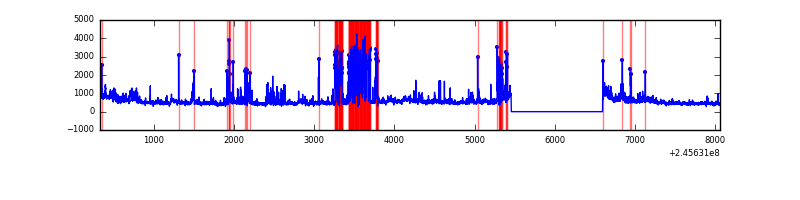 |
Top three noisy pixels from each quadrant. If the there are fewer than three noisy pixels in the level2.evt file, extra rows are filled as -1
| Pixel properties | Quadrant properties | ||||||
|---|---|---|---|---|---|---|---|
| Quadrant | DetID | PixID | Counts | Sigma | Mean | Median | Sigma |
| A | 14 | 238 | 2014359 | 12685.84 | 775 | 758 | 158.7 |
| A | 15 | 174 | 91573 | 572.14 | 775 | 758 | 158.7 |
| A | 1 | 162 | 15558 | 93.24 | 775 | 758 | 158.7 |
| B | 4 | 239 | 1349983 | 9040.46 | 785 | 767 | 149.2 |
| B | 0 | 214 | 44623 | 293.86 | 785 | 767 | 149.2 |
| B | 0 | 197 | 30142 | 196.83 | 785 | 767 | 149.2 |
| C | 13 | 61 | 5774 | 28.08 | 766 | 772 | 178.2 |
| C | 9 | 54 | 4783 | 22.51 | 766 | 772 | 178.2 |
| C | 12 | 4 | 2177 | 7.89 | 766 | 772 | 178.2 |
| D | 10 | 253 | 556312 | 3113.22 | 741 | 723 | 178.5 |
| D | 1 | 52 | 523823 | 2931.17 | 741 | 723 | 178.5 |
| D | 11 | 129 | 231873 | 1295.24 | 741 | 723 | 178.5 |
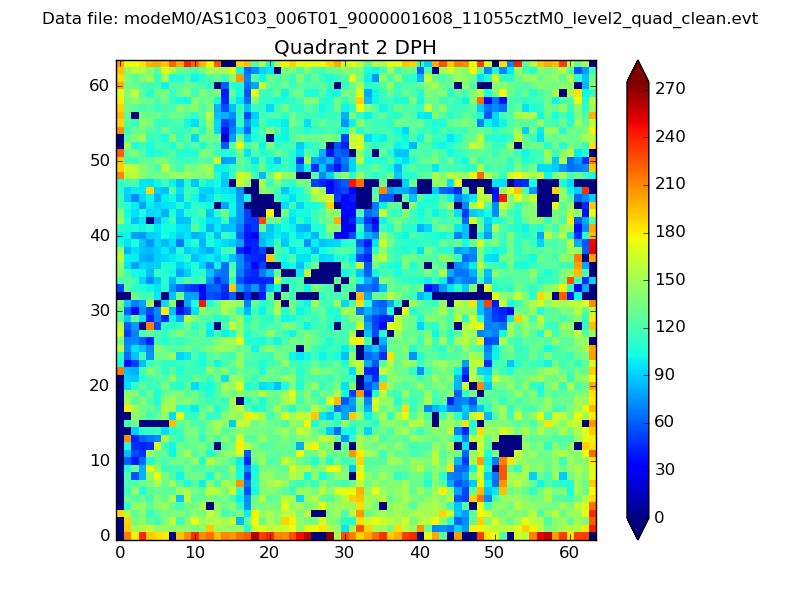
Histogram calculated using DETX and DETY for each event in the final _common_clean file
| Quadrant A | 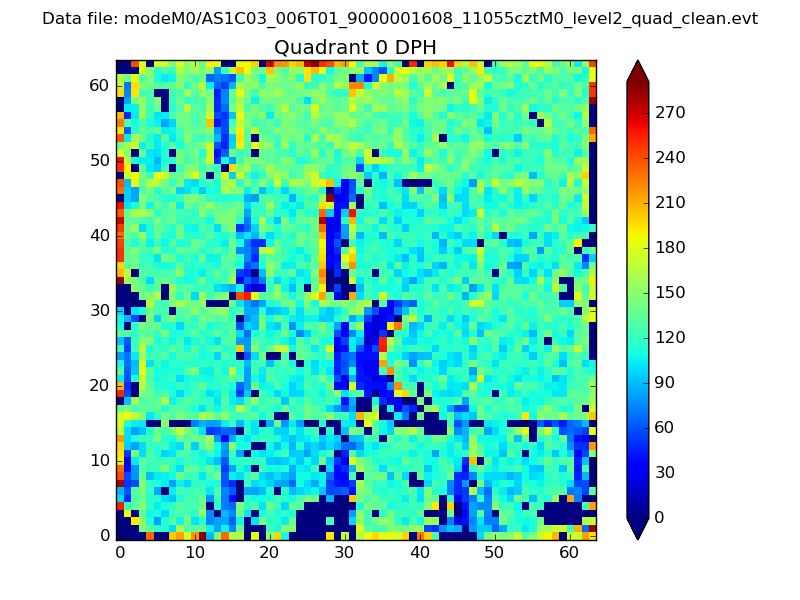 |
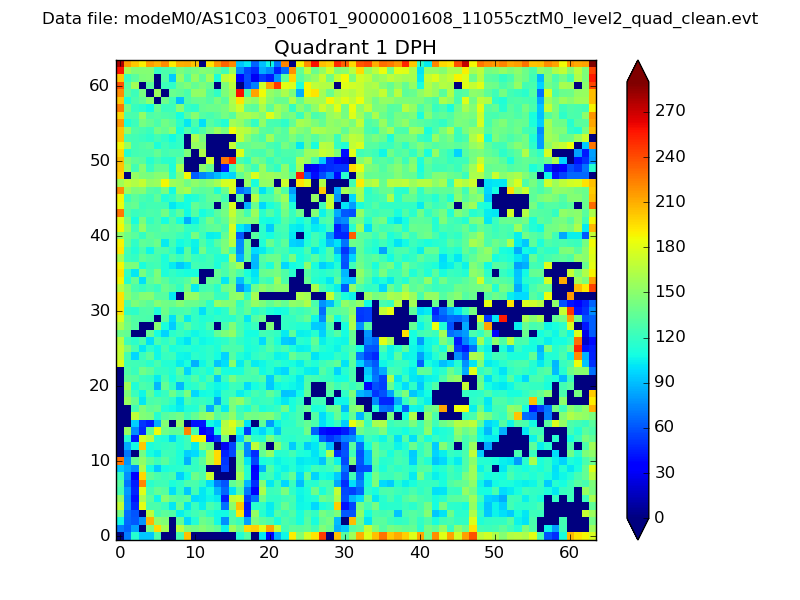 |
Quadrant B |
|---|---|---|---|
| Quadrant D | 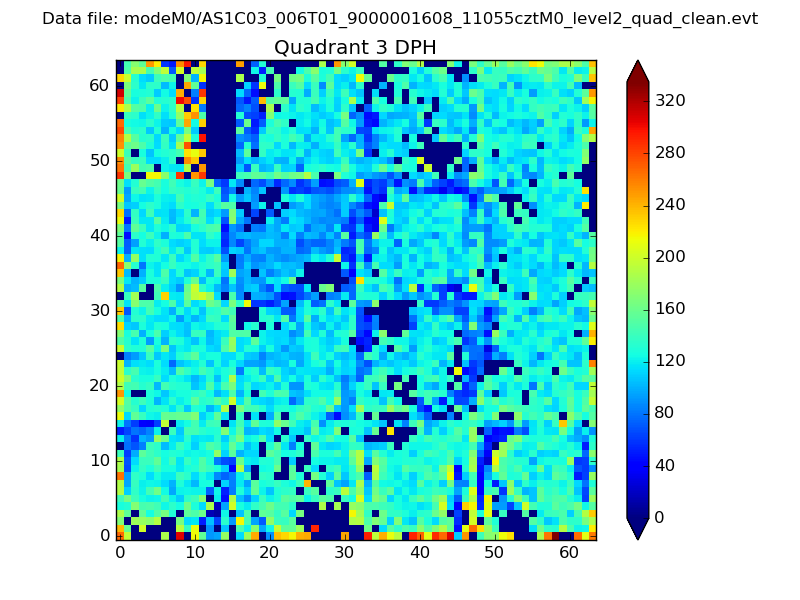 |
 |
Quadrant C |
| Plot type | Count rate plots | Images |
|---|---|---|
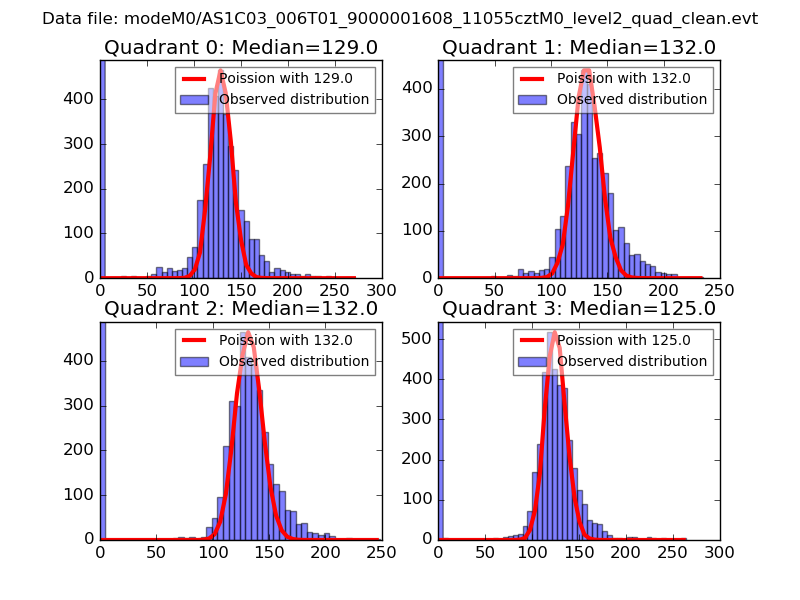
| Comparison with Poisson distribution Blue bars denote a histogram of data divided into 1 sec bins. Red curve is a Poisson curve with rate = median count rate of data. |
 |
 |
| Quadrant-wise count rates Data is divided into 100 sec bins |
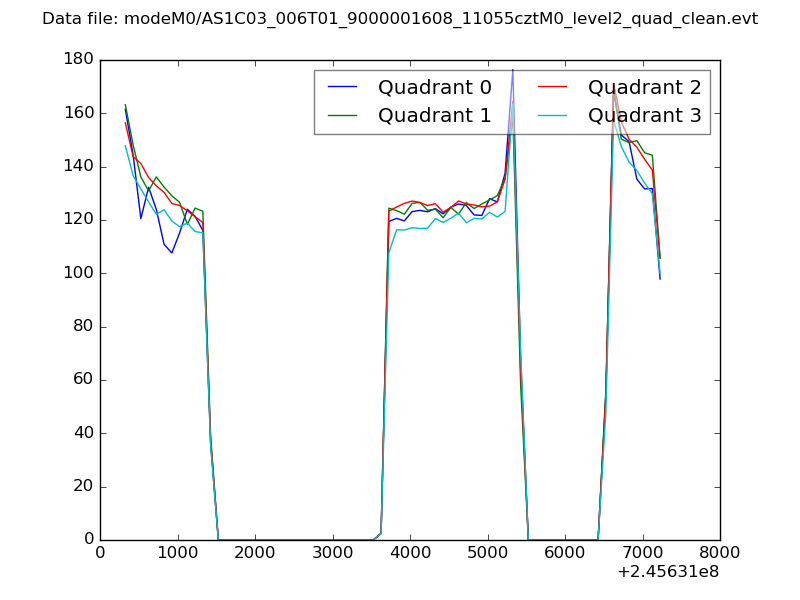 |
|
| Module-wise count rates for Quadrant A Data is divided into 100 sec bins |
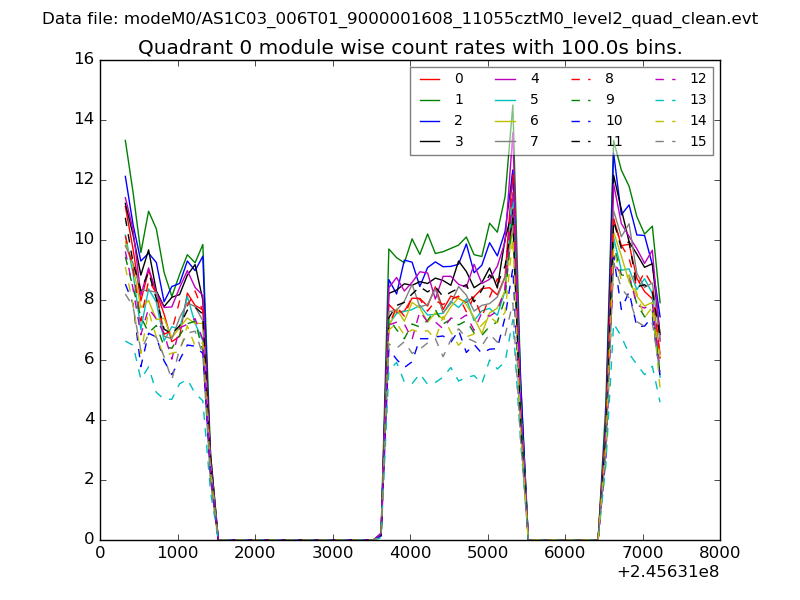 |
 |
| Module-wise count rates for Quadrant B Data is divided into 100 sec bins |
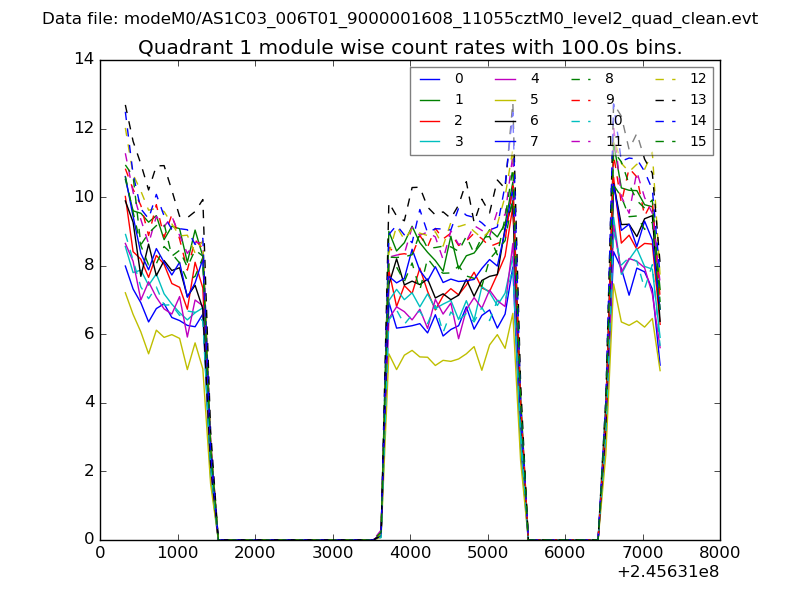 |
 |
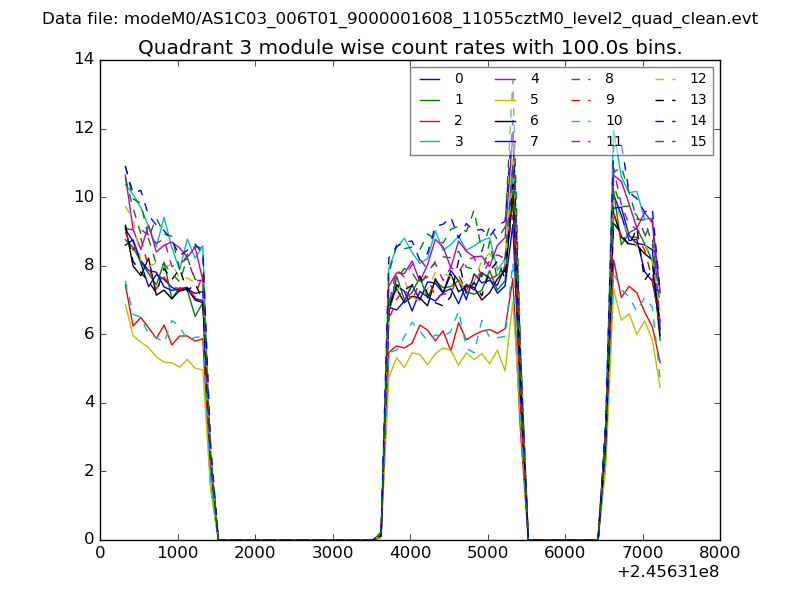
| Module-wise count rates for Quadrant C Data is divided into 100 sec bins |
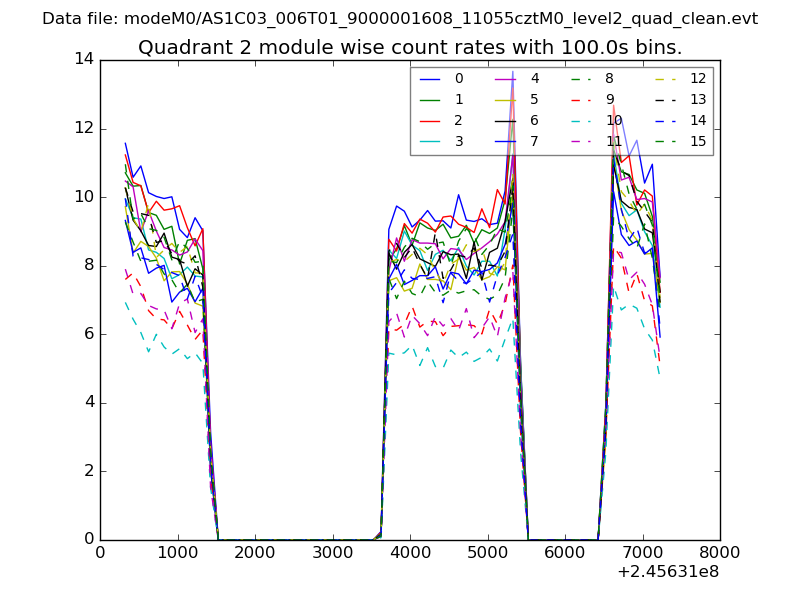 |
 |
| Module-wise count rates for Quadrant D Data is divided into 100 sec bins |
 |
 |
| Parameter | Plot |
|---|---|
| CZT HV Monitor | 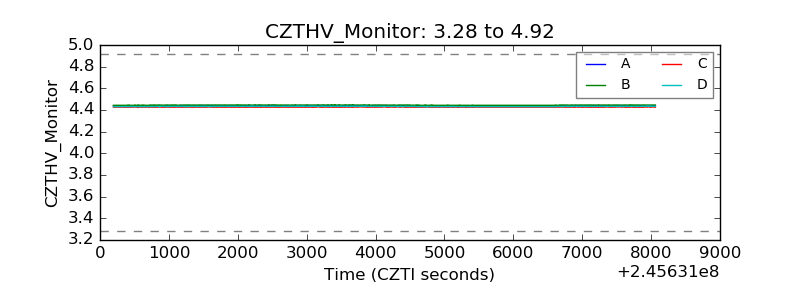 |
| D_VDD | 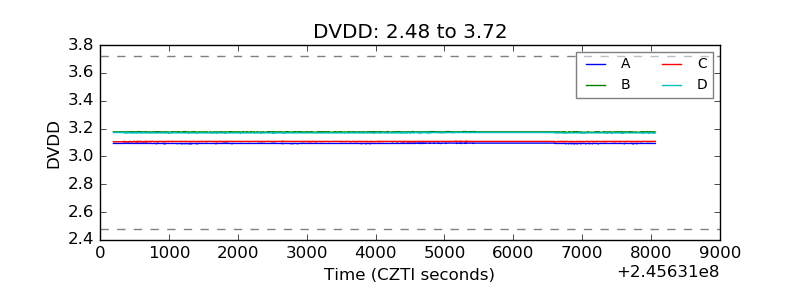 |
| Temperature 1 | 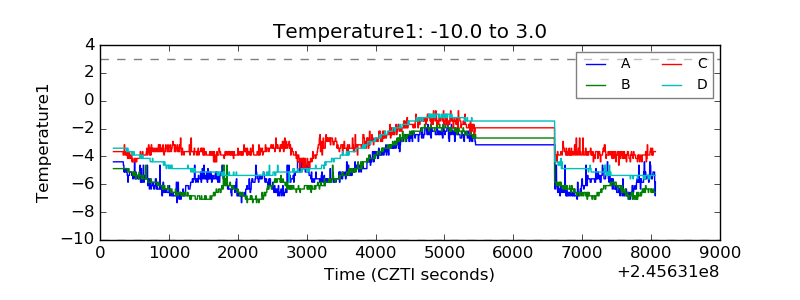 |
| Veto HV Monitor | 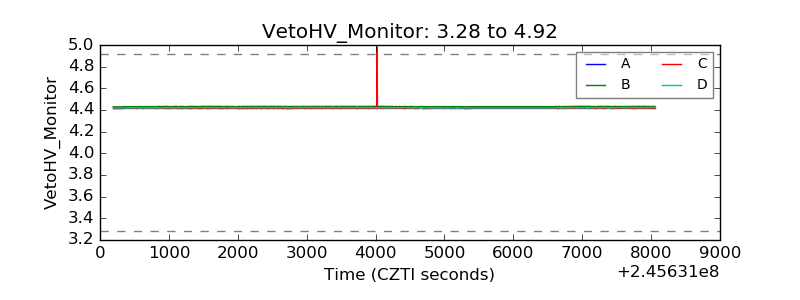 |
| Veto LLD | 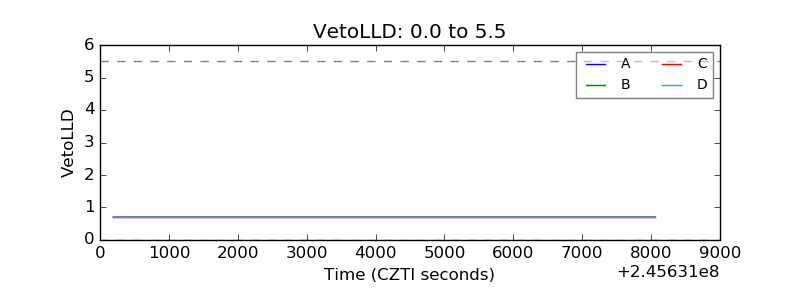 |
| Alpha Counter | 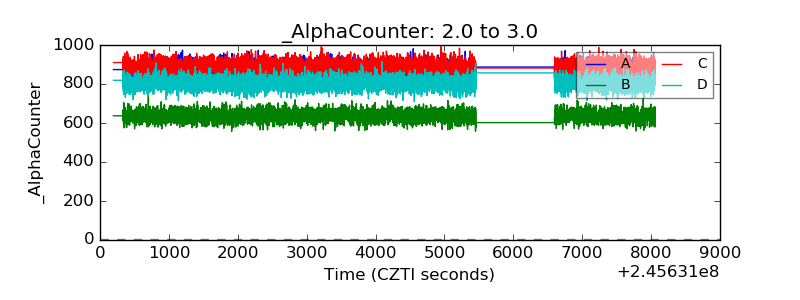 |
| _CPM_Rate | 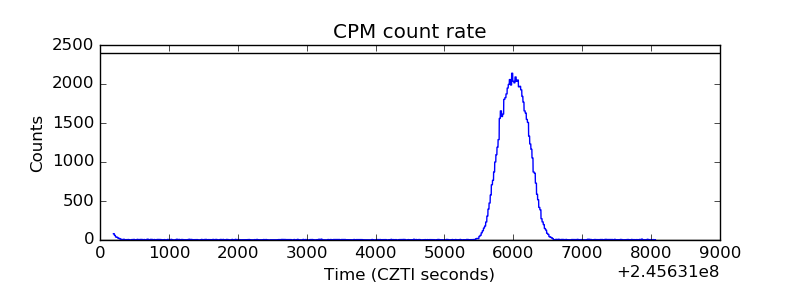 |
| CZT Counter | 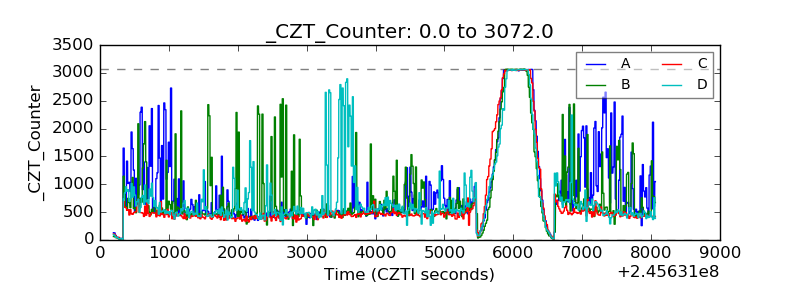 |
| +2.5 Volts monitor |  |
| +5 Volts monitor | 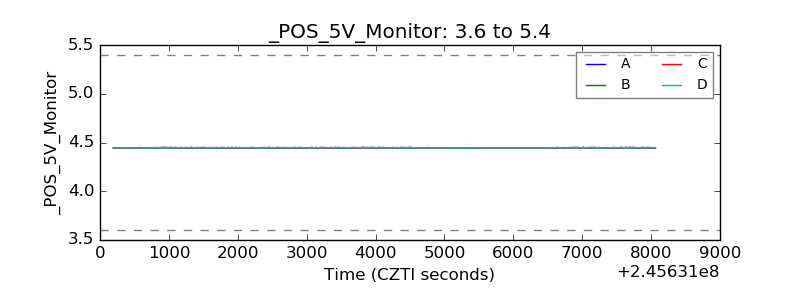 |
| _ROLL_ROT | 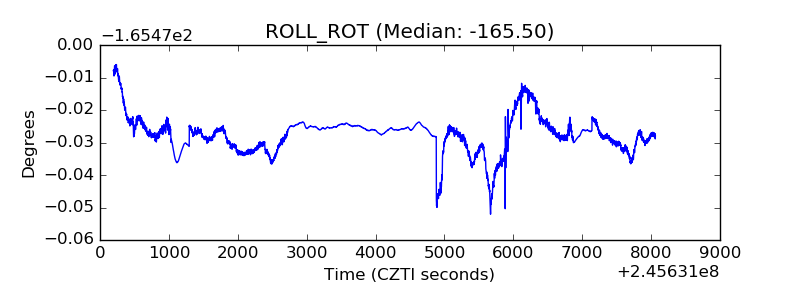 |
| _Roll_DEC | 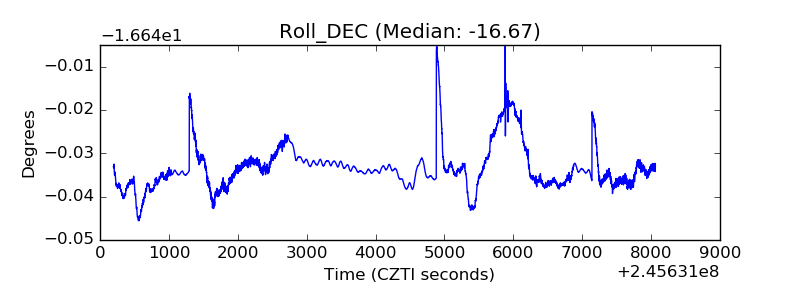 |
| _Roll_RA | 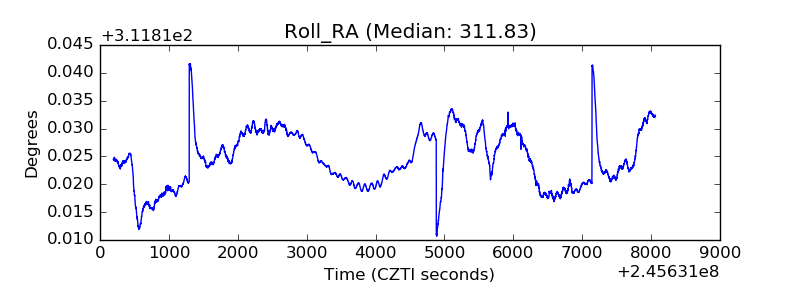 |
| Veto Counter | 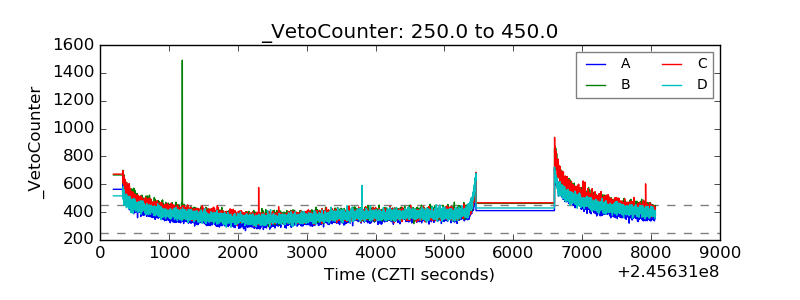 |