| Param | Original file | Final file |
|---|---|---|
| Filename | modeM0/AS1C03_006T01_9000001608_11056cztM0_level2.evt | modeM0/AS1C03_006T01_9000001608_11056cztM0_level2_quad_clean.evt |
| Size (bytes) | 600,860,160 | 71,795,520 |
| Size | 573.0 MB | 68.5 MB |
| Events in quadrant A | 6,306,750 | 424,165 |
| Events in quadrant B | 4,443,951 | 439,513 |
| Events in quadrant C | 3,125,554 | 438,797 |
| Events in quadrant D | 3,878,252 | 415,050 |
| Mode M9 | |||
|---|---|---|---|
| Quadrant | BADHDUFLAG | Total packets | Discarded packets |
| A | 0 | 15 | 0 |
| B | 0 | 15 | 0 |
| C | 0 | 15 | 0 |
| D | 0 | 16 | 0 |
| Mode M0 | |||
|---|---|---|---|
| Quadrant | BADHDUFLAG | Total packets | Discarded packets |
| A | 0 | 23240 | 3 |
| B | 0 | 17430 | 2 |
| C | 0 | 13522 | 2 |
| D | 0 | 15770 | 2 |
| Mode SS | |||
|---|---|---|---|
| Quadrant | BADHDUFLAG | Total packets | Discarded packets |
| A | 0 | 132 | 0 |
| B | 0 | 132 | 0 |
| C | 0 | 132 | 0 |
| D | 0 | 132 | 0 |
| Quadrant | Total seconds | Saturated seconds | Saturation percentage |
|---|---|---|---|
| A | 6543 | 630 | 9.628611% |
| B | 6543 | 285 | 4.355800% |
| C | 6543 | 30 | 0.458505% |
| D | 6543 | 130 | 1.986856% |
Noise dominated data is calculated using 1-second bins in cleaned event files. If a bin has >2000 counts, and if more than 50% of those come from <1% of pixels, then it is considered to be noise-dominated and hence unusable.
| Quadrant | # 1 sec bins | Bins with >0 counts | Bins with >2000 counts | High rate bins dominated by noise | Noise dominated (total time) | Noise dominated (detector-on time) | Marked lightcurve |
|---|---|---|---|---|---|---|---|
| A | 7763 | 6544 | 455 | 455 | 5.86% | 6.95% | 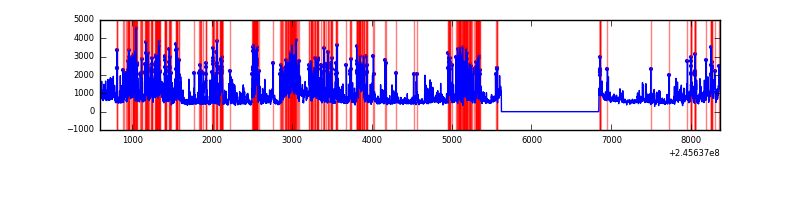 |
| B | 7763 | 6544 | 165 | 165 | 2.13% | 2.52% | 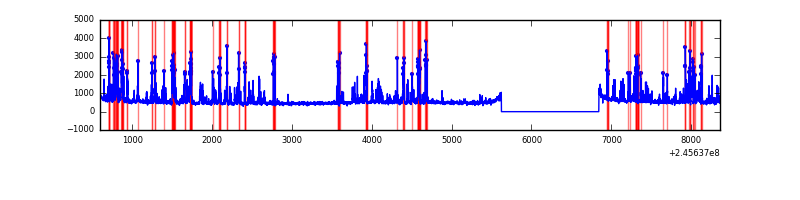 |
| C | 7763 | 6544 | 0 | 0 | 0.00% | 0.00% | 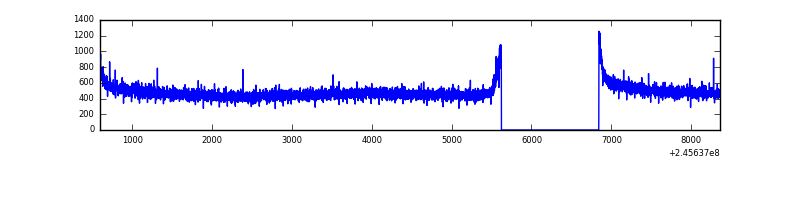 |
| D | 7763 | 6544 | 68 | 68 | 0.88% | 1.04% | 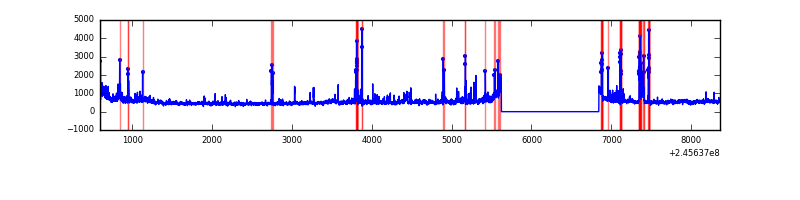 |
Top three noisy pixels from each quadrant. If the there are fewer than three noisy pixels in the level2.evt file, extra rows are filled as -1
| Pixel properties | Quadrant properties | ||||||
|---|---|---|---|---|---|---|---|
| Quadrant | DetID | PixID | Counts | Sigma | Mean | Median | Sigma |
| A | 14 | 238 | 2872055 | 17755.63 | 799 | 785 | 161.7 |
| A | 15 | 174 | 340105 | 2098.32 | 799 | 785 | 161.7 |
| A | 11 | 29 | 12521 | 72.57 | 799 | 785 | 161.7 |
| B | 4 | 239 | 1178001 | 7634.03 | 819 | 801 | 154.2 |
| B | 0 | 214 | 37644 | 238.92 | 819 | 801 | 154.2 |
| B | 12 | 111 | 17155 | 106.05 | 819 | 801 | 154.2 |
| C | 13 | 61 | 6115 | 28.65 | 800 | 806 | 185.3 |
| C | 14 | 234 | 3866 | 16.51 | 800 | 806 | 185.3 |
| C | 14 | 67 | 3674 | 15.48 | 800 | 806 | 185.3 |
| D | 1 | 52 | 264276 | 1402.18 | 785 | 765 | 187.9 |
| D | 8 | 195 | 254550 | 1350.42 | 785 | 765 | 187.9 |
| D | 11 | 129 | 181784 | 963.23 | 785 | 765 | 187.9 |
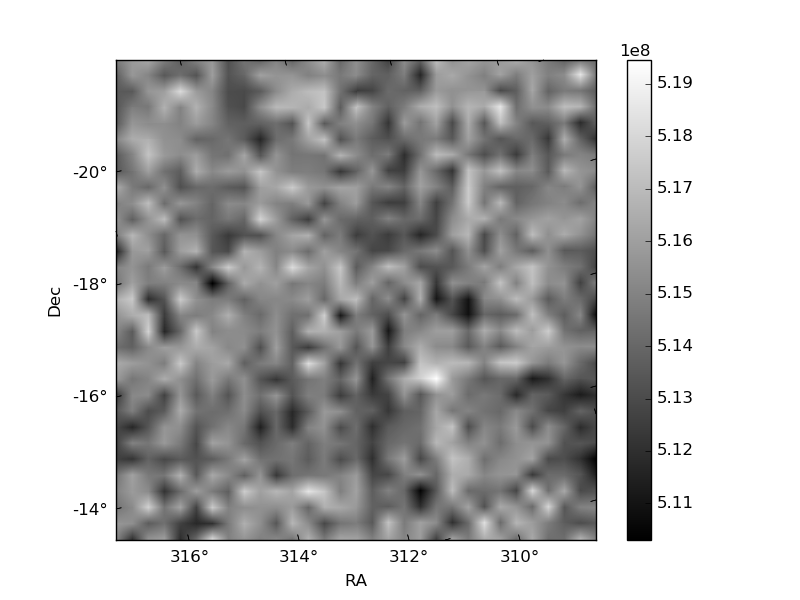
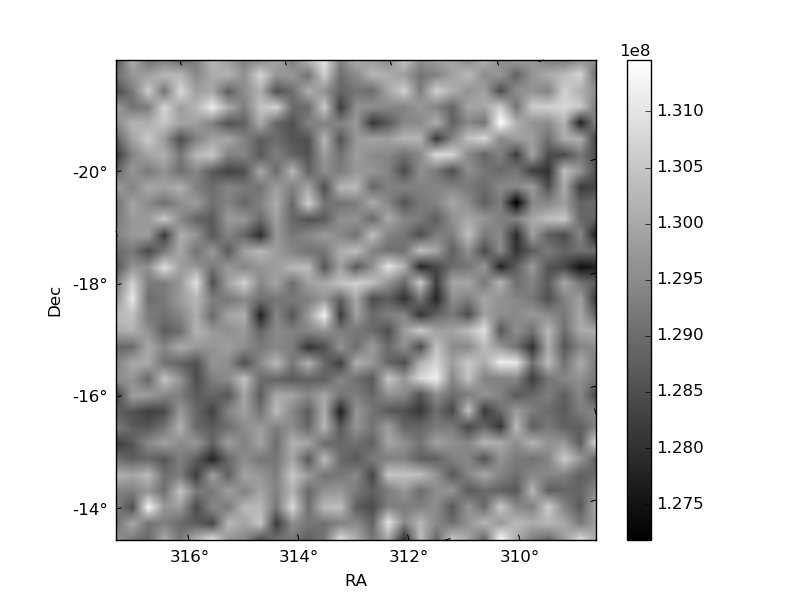
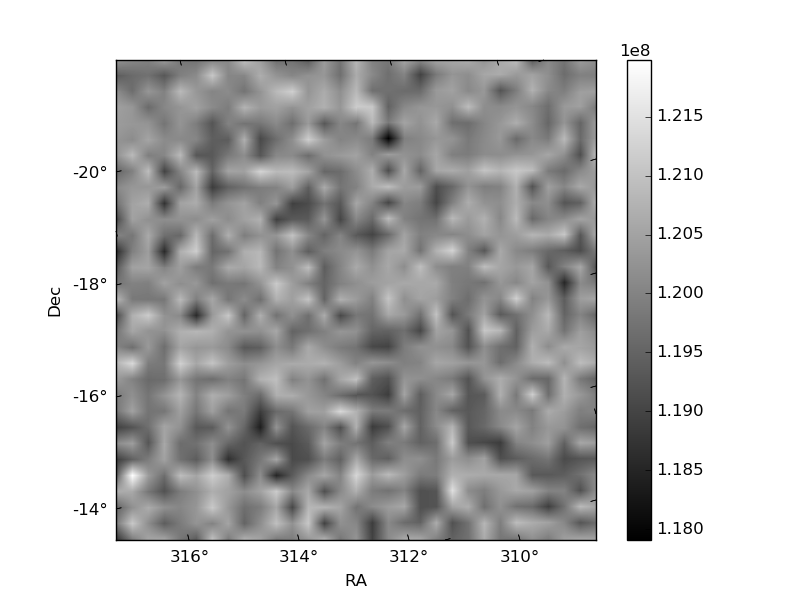
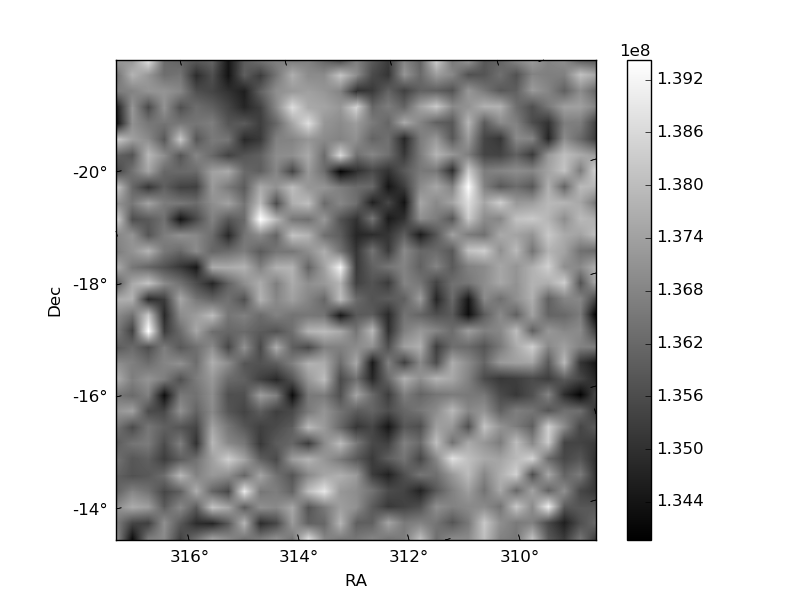
Histogram calculated using DETX and DETY for each event in the final _common_clean file
| Quadrant A | 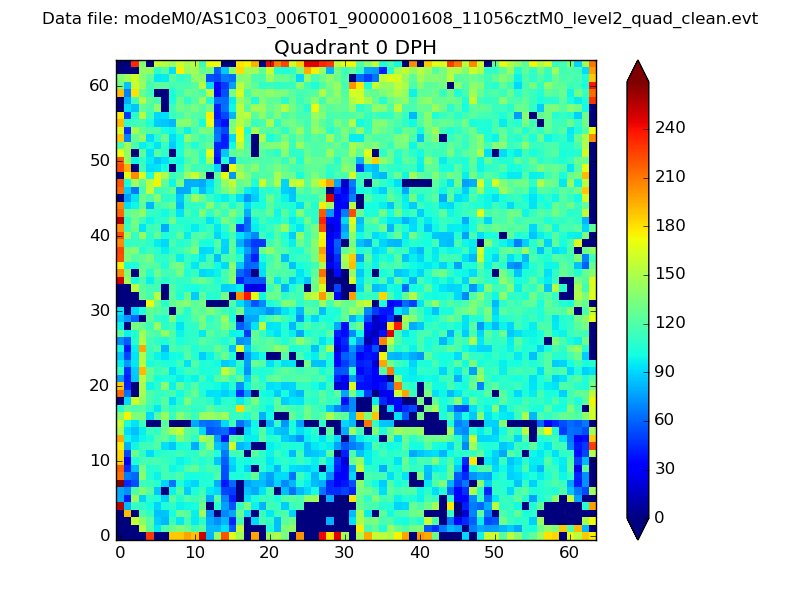 |
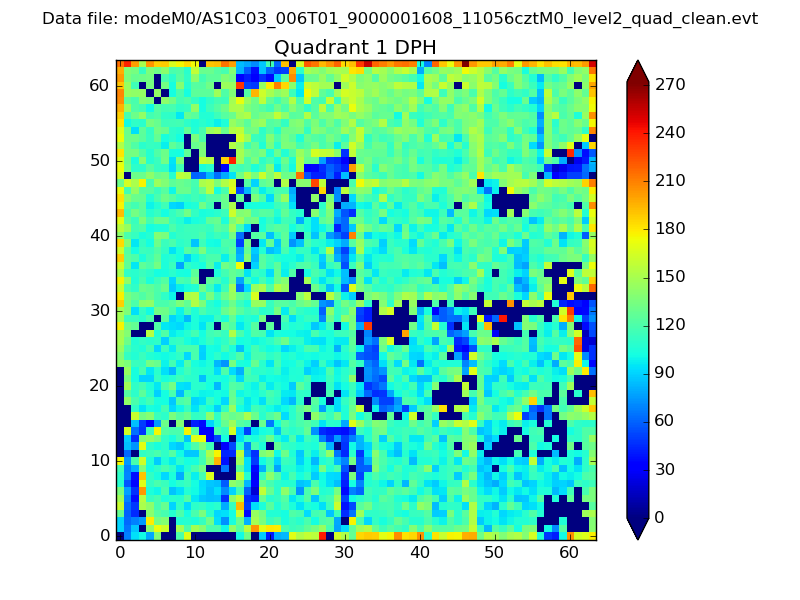 |
Quadrant B |
|---|---|---|---|
| Quadrant D |  |
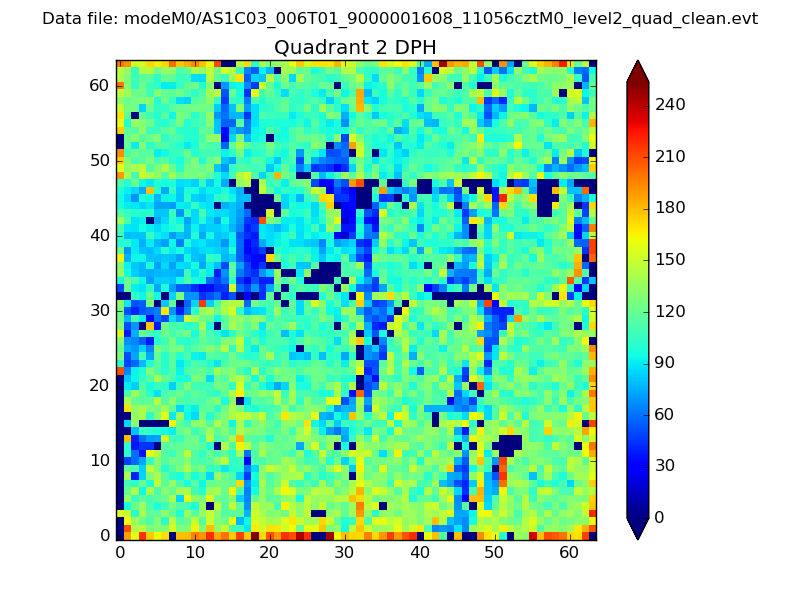 |
Quadrant C |
| Plot type | Count rate plots | Images |
|---|---|---|
| Comparison with Poisson distribution Blue bars denote a histogram of data divided into 1 sec bins. Red curve is a Poisson curve with rate = median count rate of data. |
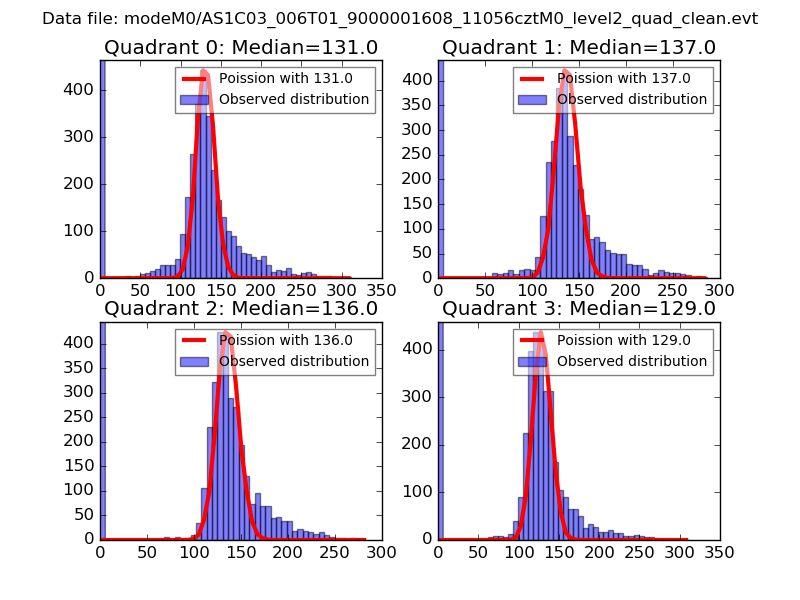 |
 |
| Quadrant-wise count rates Data is divided into 100 sec bins |
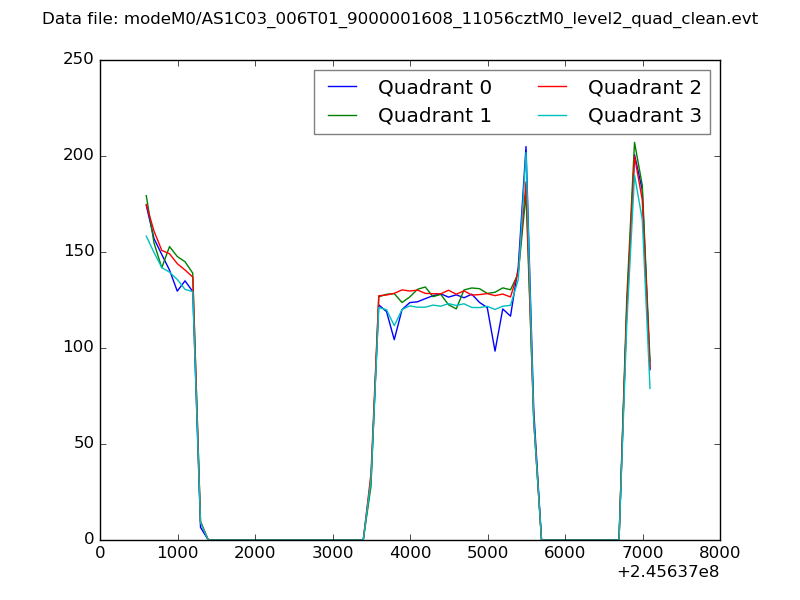 |
|
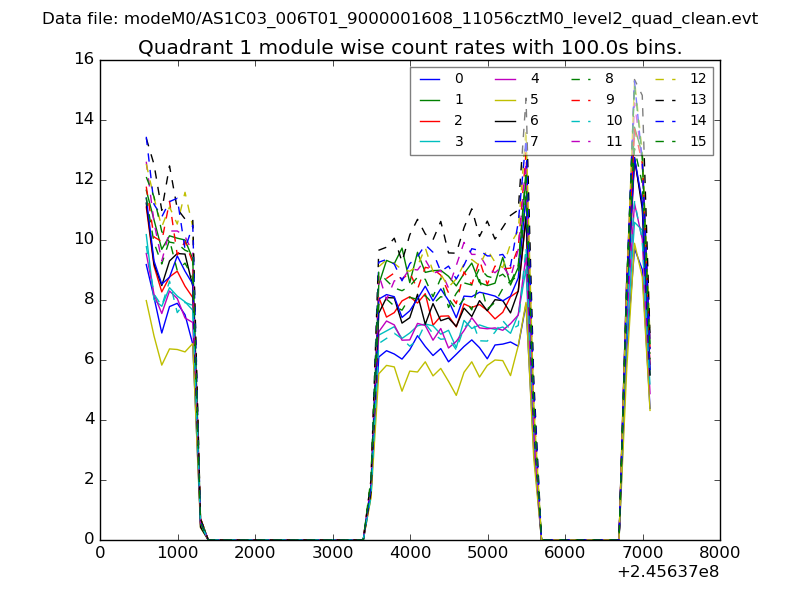
| Module-wise count rates for Quadrant A Data is divided into 100 sec bins |
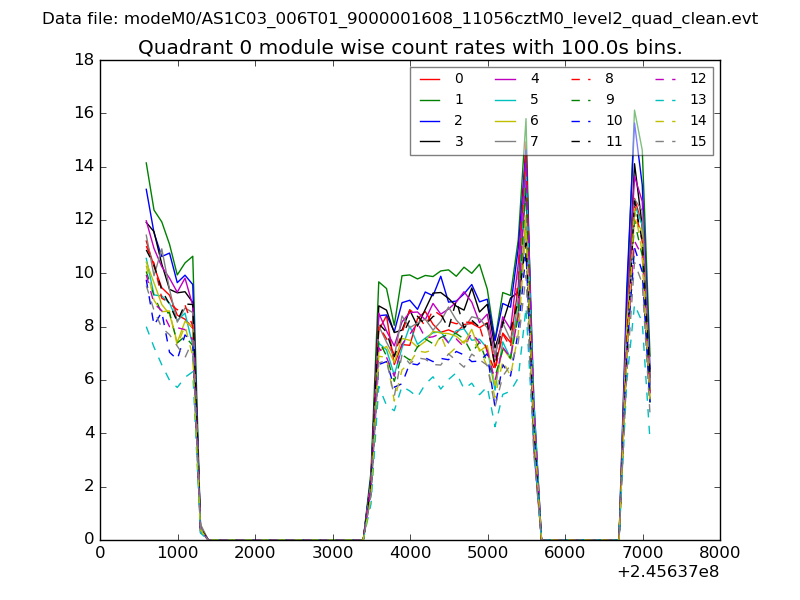 |
 |
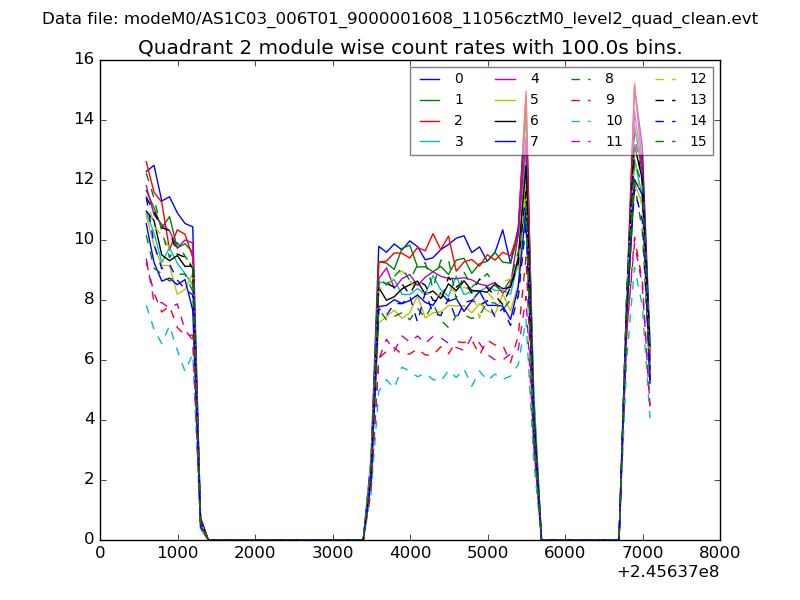
| Module-wise count rates for Quadrant B Data is divided into 100 sec bins |
 |
 |
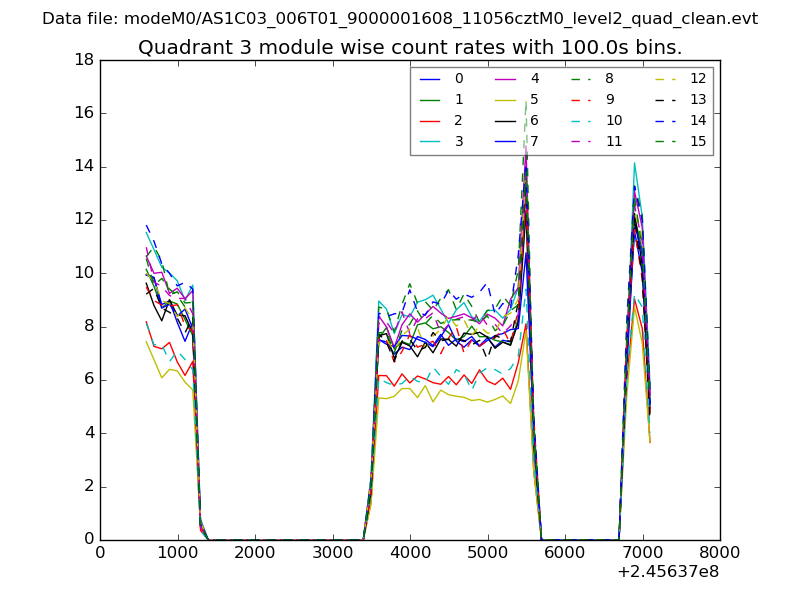
| Module-wise count rates for Quadrant C Data is divided into 100 sec bins |
 |
 |
| Module-wise count rates for Quadrant D Data is divided into 100 sec bins |
 |
 |
| Parameter | Plot |
|---|---|
| CZT HV Monitor | 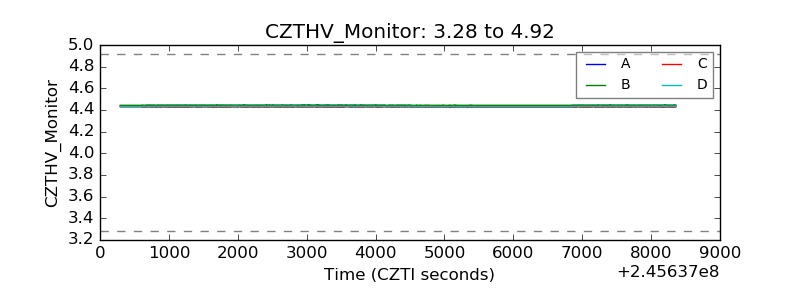 |
| D_VDD | 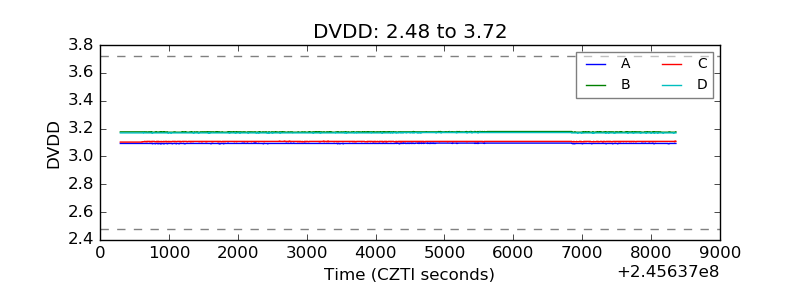 |
| Temperature 1 | 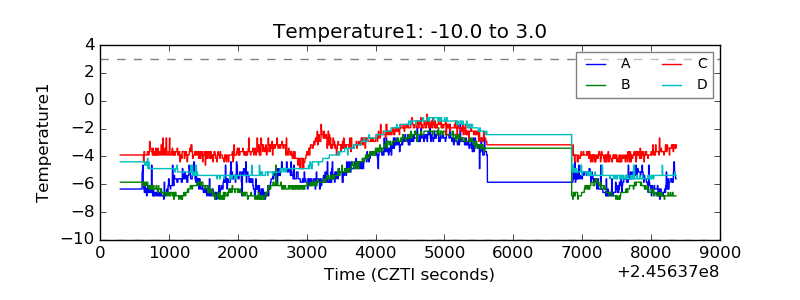 |
| Veto HV Monitor | 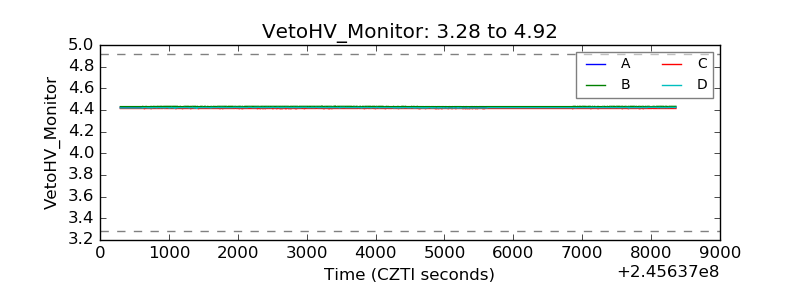 |
| Veto LLD | 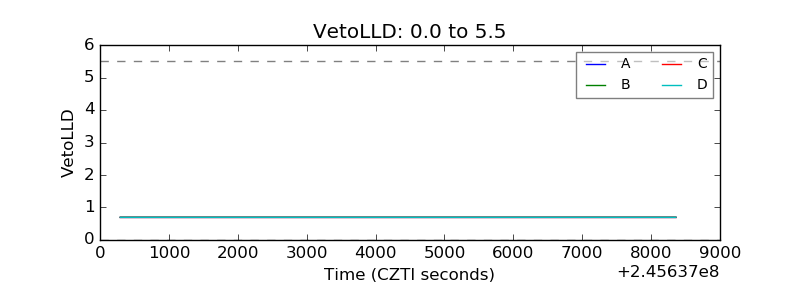 |
| Alpha Counter | 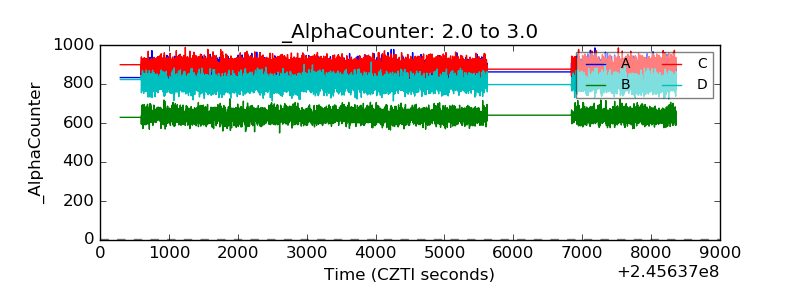 |
| _CPM_Rate | 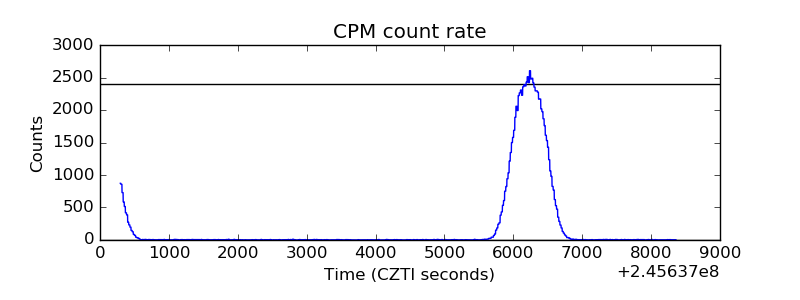 |
| CZT Counter | 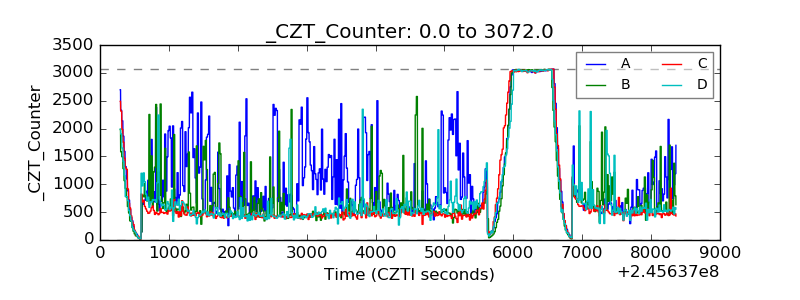 |
| +2.5 Volts monitor |  |
| +5 Volts monitor |  |
| _ROLL_ROT | 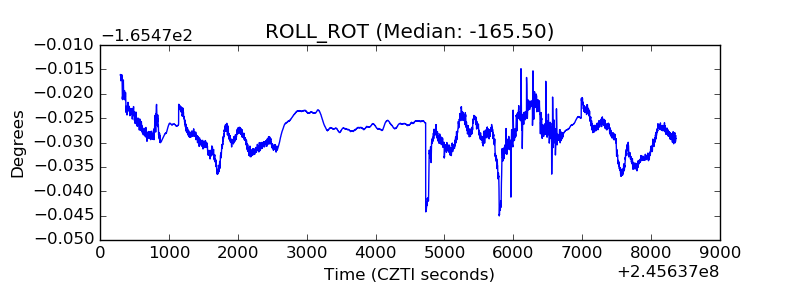 |
| _Roll_DEC | 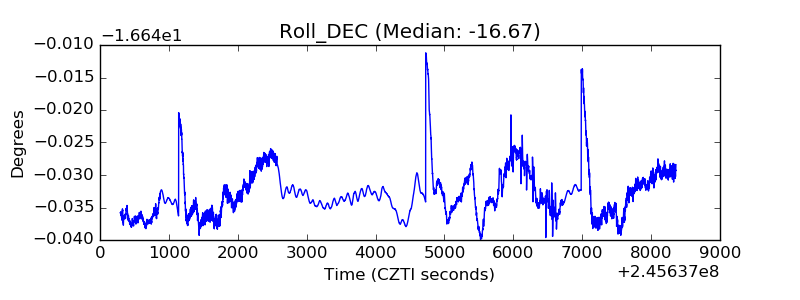 |
| _Roll_RA | 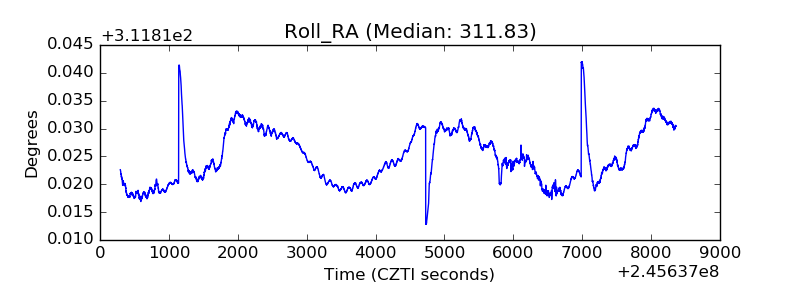 |
| Veto Counter |  |