| Param | Original file | Final file |
|---|---|---|
| Filename | modeM0/AS1C03_006T01_9000001608_11058cztM0_level2.evt | modeM0/AS1C03_006T01_9000001608_11058cztM0_level2_quad_clean.evt |
| Size (bytes) | 593,225,280 | 62,305,920 |
| Size | 565.7 MB | 59.4 MB |
| Events in quadrant A | 6,110,579 | 358,443 |
| Events in quadrant B | 4,305,375 | 371,857 |
| Events in quadrant C | 3,158,138 | 372,639 |
| Events in quadrant D | 3,966,433 | 344,872 |
| Mode M9 | |||
|---|---|---|---|
| Quadrant | BADHDUFLAG | Total packets | Discarded packets |
| A | 0 | 15 | 0 |
| B | 0 | 15 | 0 |
| C | 0 | 15 | 0 |
| D | 0 | 16 | 0 |
| Mode M0 | |||
|---|---|---|---|
| Quadrant | BADHDUFLAG | Total packets | Discarded packets |
| A | 0 | 22176 | 3 |
| B | 0 | 16761 | 2 |
| C | 0 | 13158 | 2 |
| D | 0 | 15664 | 2 |
| Mode SS | |||
|---|---|---|---|
| Quadrant | BADHDUFLAG | Total packets | Discarded packets |
| A | 0 | 128 | 0 |
| B | 0 | 128 | 0 |
| C | 0 | 128 | 0 |
| D | 0 | 128 | 0 |
| Quadrant | Total seconds | Saturated seconds | Saturation percentage |
|---|---|---|---|
| A | 6280 | 963 | 15.334395% |
| B | 6280 | 278 | 4.426752% |
| C | 6280 | 46 | 0.732484% |
| D | 6280 | 225 | 3.582803% |
Noise dominated data is calculated using 1-second bins in cleaned event files. If a bin has >2000 counts, and if more than 50% of those come from <1% of pixels, then it is considered to be noise-dominated and hence unusable.
| Quadrant | # 1 sec bins | Bins with >0 counts | Bins with >2000 counts | High rate bins dominated by noise | Noise dominated (total time) | Noise dominated (detector-on time) | Marked lightcurve |
|---|---|---|---|---|---|---|---|
| A | 7595 | 6281 | 693 | 693 | 9.12% | 11.03% | 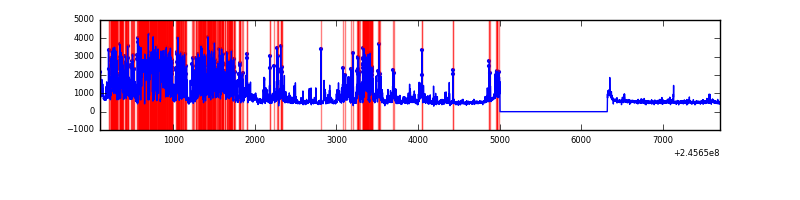 |
| B | 7595 | 6281 | 123 | 123 | 1.62% | 1.96% | 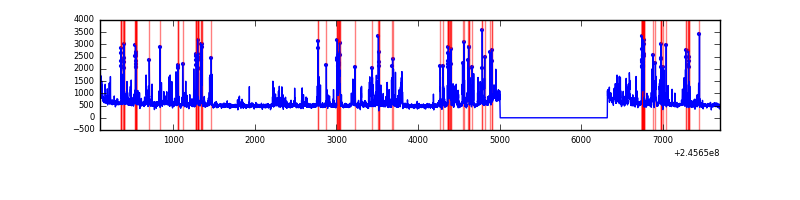 |
| C | 7595 | 6281 | 0 | 0 | 0.00% | 0.00% |  |
| D | 7595 | 6281 | 146 | 146 | 1.92% | 2.32% | 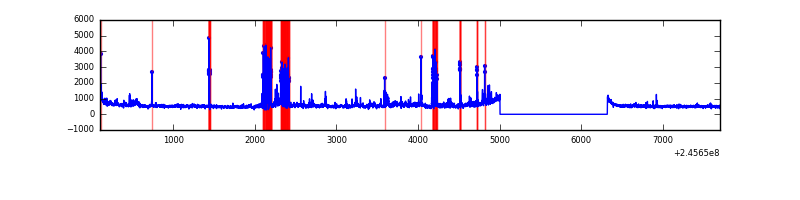 |
Top three noisy pixels from each quadrant. If the there are fewer than three noisy pixels in the level2.evt file, extra rows are filled as -1
| Pixel properties | Quadrant properties | ||||||
|---|---|---|---|---|---|---|---|
| Quadrant | DetID | PixID | Counts | Sigma | Mean | Median | Sigma |
| A | 14 | 238 | 2971120 | 18943.95 | 778 | 764 | 156.8 |
| A | 15 | 174 | 139742 | 886.36 | 778 | 764 | 156.8 |
| A | 11 | 29 | 7579 | 43.46 | 778 | 764 | 156.8 |
| B | 4 | 239 | 1013012 | 6553.55 | 825 | 808 | 154.5 |
| B | 12 | 111 | 17142 | 105.76 | 825 | 808 | 154.5 |
| B | 15 | 204 | 16879 | 104.05 | 825 | 808 | 154.5 |
| C | 13 | 61 | 5938 | 27.67 | 809 | 815 | 185.1 |
| C | 14 | 67 | 2834 | 10.9 | 809 | 815 | 185.1 |
| C | 3 | 202 | 2099 | 6.93 | 809 | 815 | 185.1 |
| D | 13 | 152 | 388711 | 2053.53 | 790 | 769 | 188.9 |
| D | 8 | 195 | 187485 | 988.36 | 790 | 769 | 188.9 |
| D | 11 | 129 | 155274 | 817.86 | 790 | 769 | 188.9 |
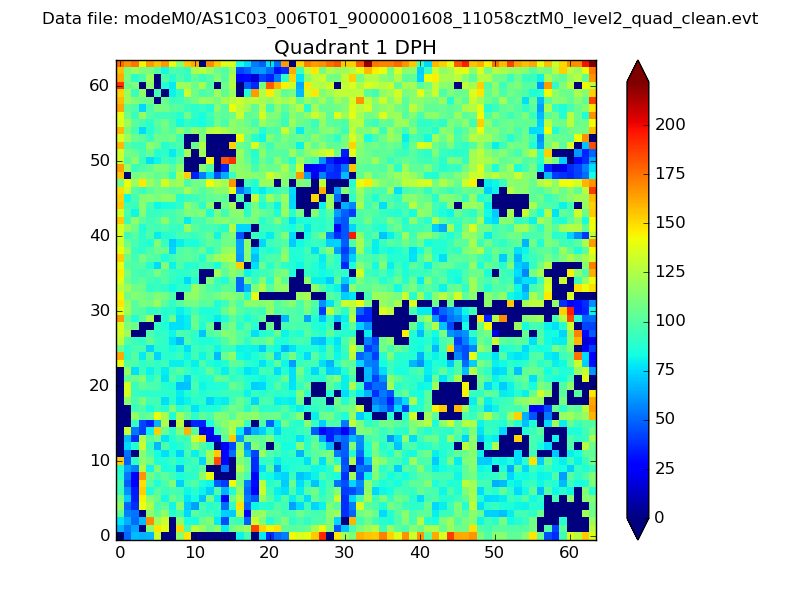
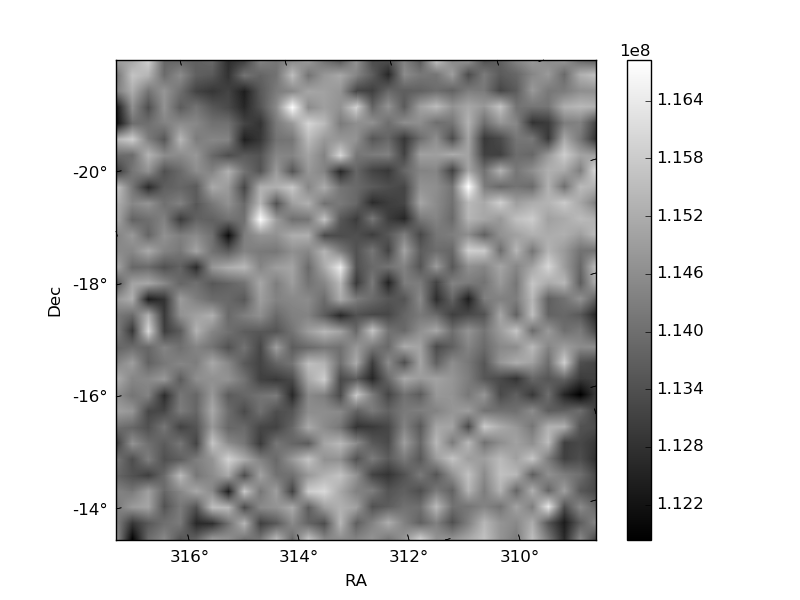
Histogram calculated using DETX and DETY for each event in the final _common_clean file
| Quadrant A | 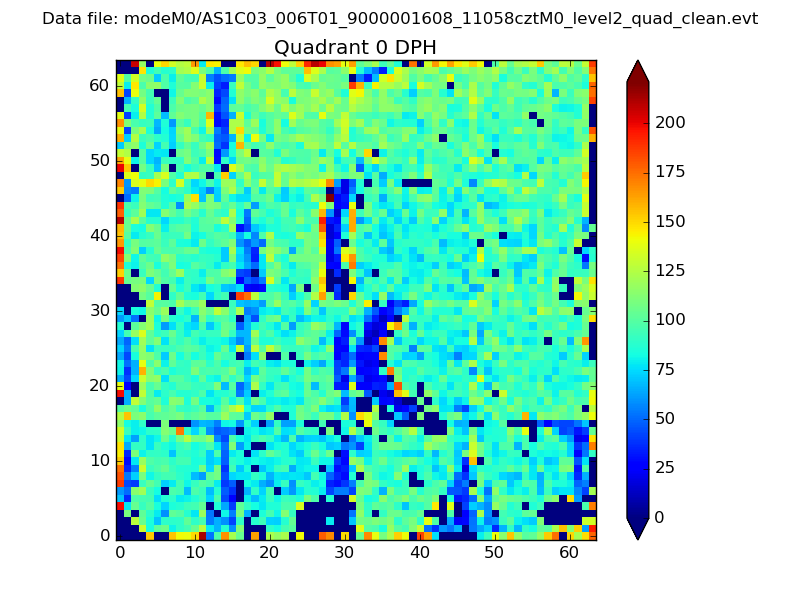 |
 |
Quadrant B |
|---|---|---|---|
| Quadrant D | 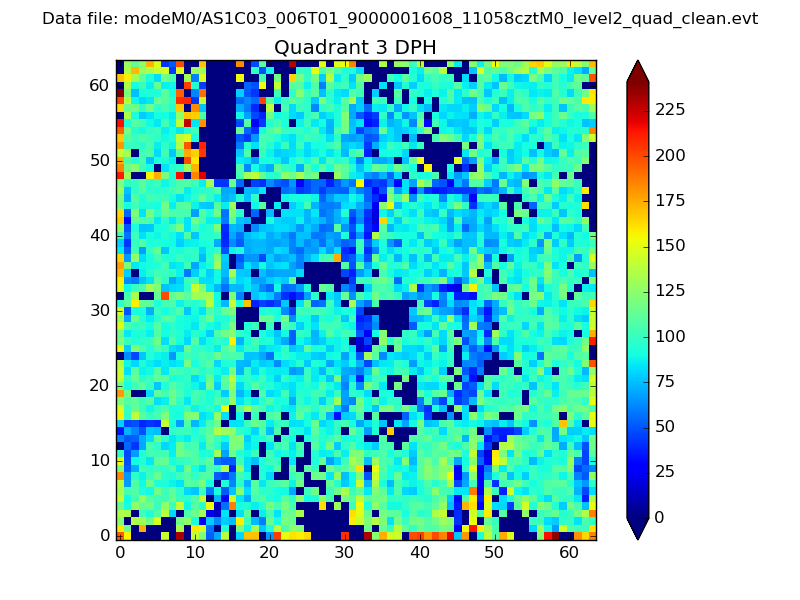 |
 |
Quadrant C |
| Plot type | Count rate plots | Images |
|---|---|---|
| Comparison with Poisson distribution Blue bars denote a histogram of data divided into 1 sec bins. Red curve is a Poisson curve with rate = median count rate of data. |
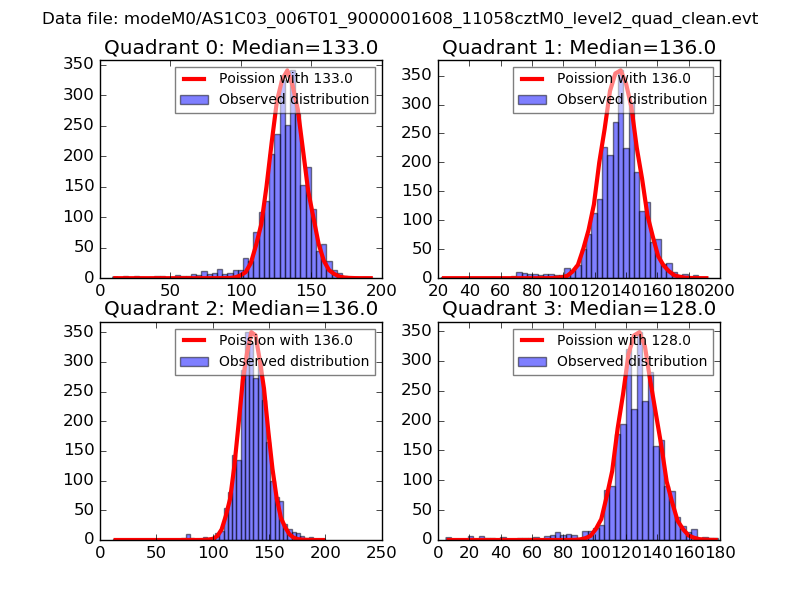 |
 |
| Quadrant-wise count rates Data is divided into 100 sec bins |
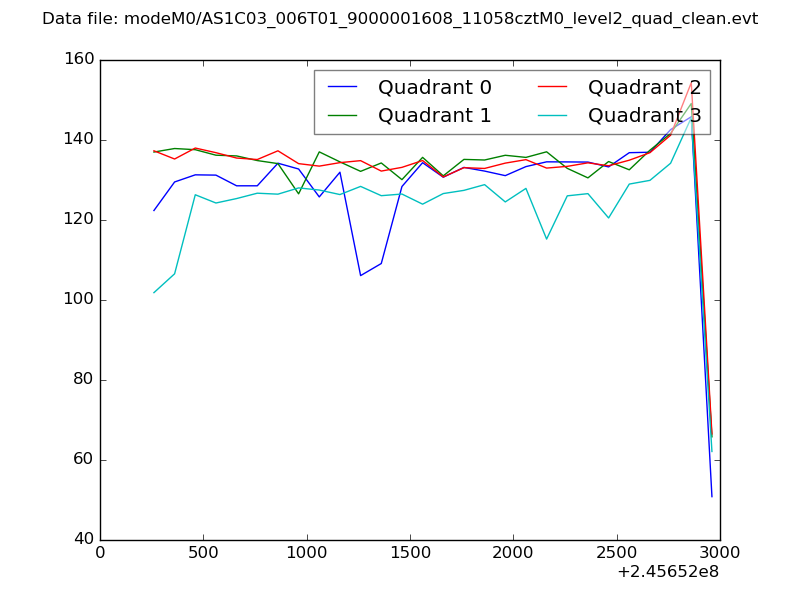 |
|
| Module-wise count rates for Quadrant A Data is divided into 100 sec bins |
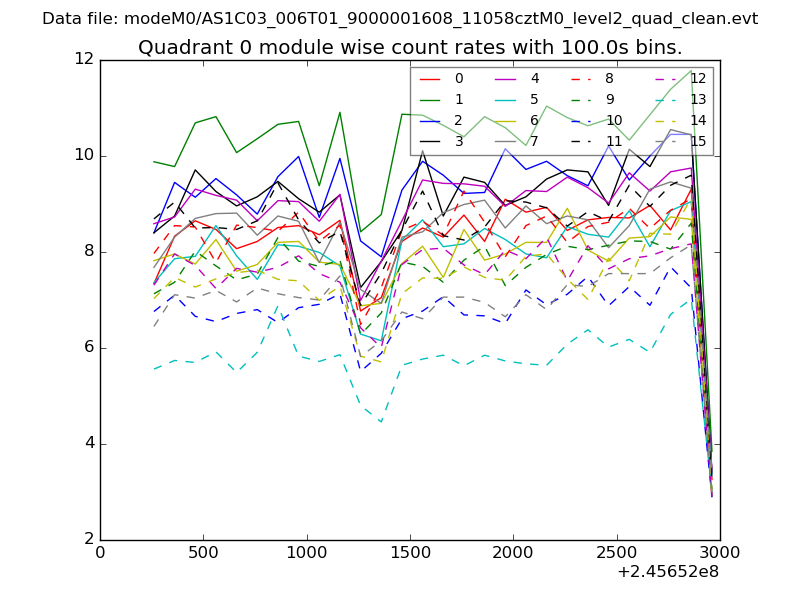 |
 |
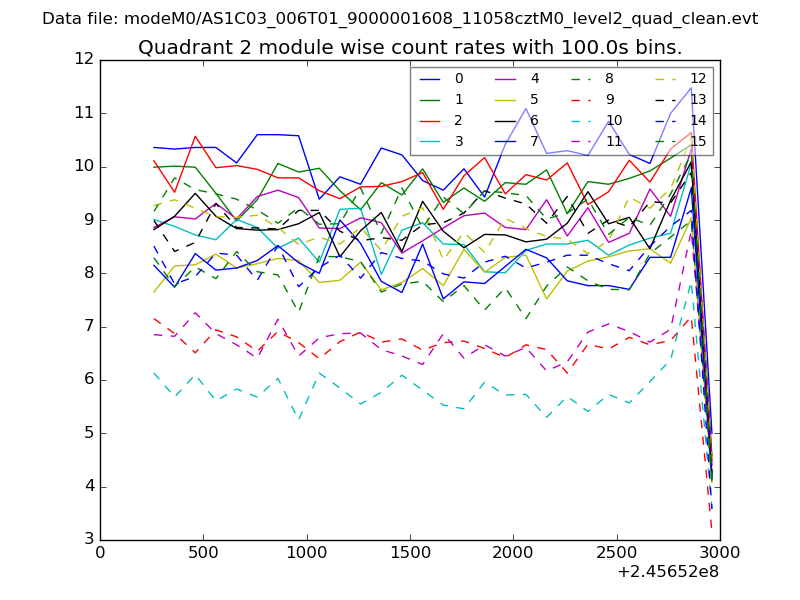
| Module-wise count rates for Quadrant B Data is divided into 100 sec bins |
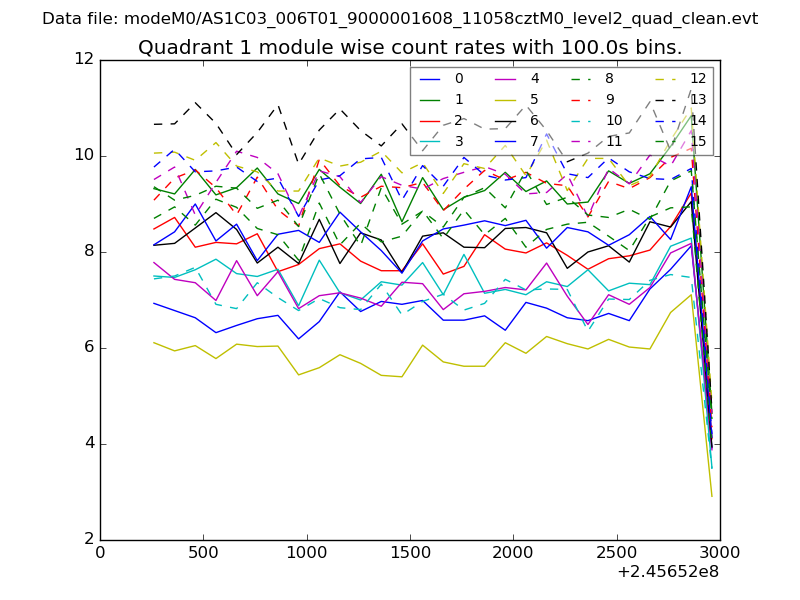 |
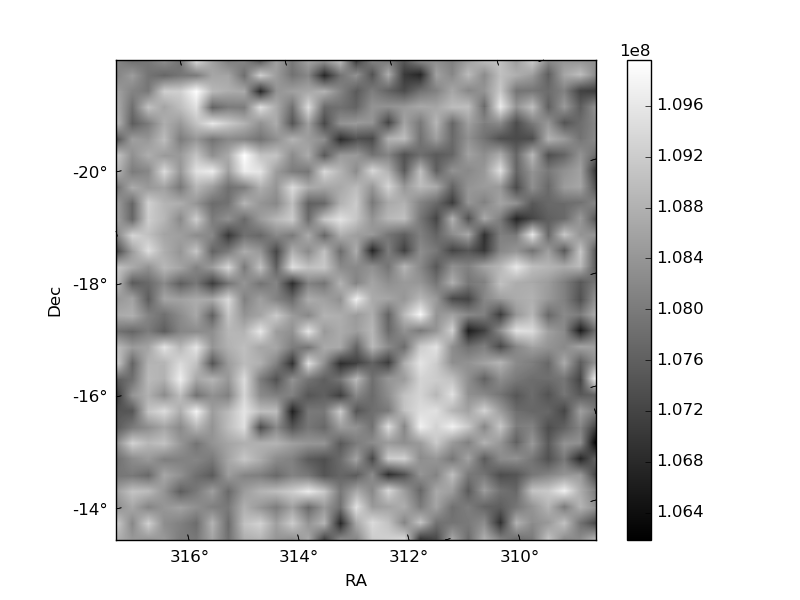 |
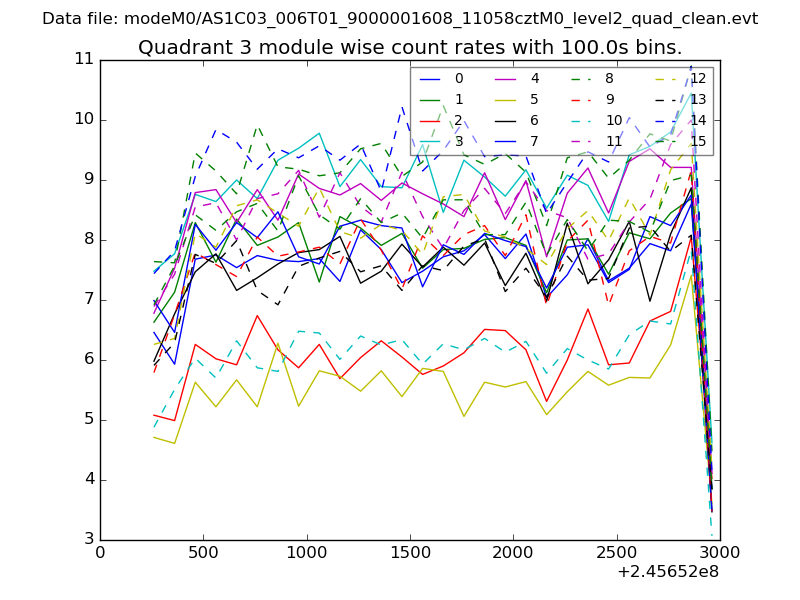
| Module-wise count rates for Quadrant C Data is divided into 100 sec bins |
 |
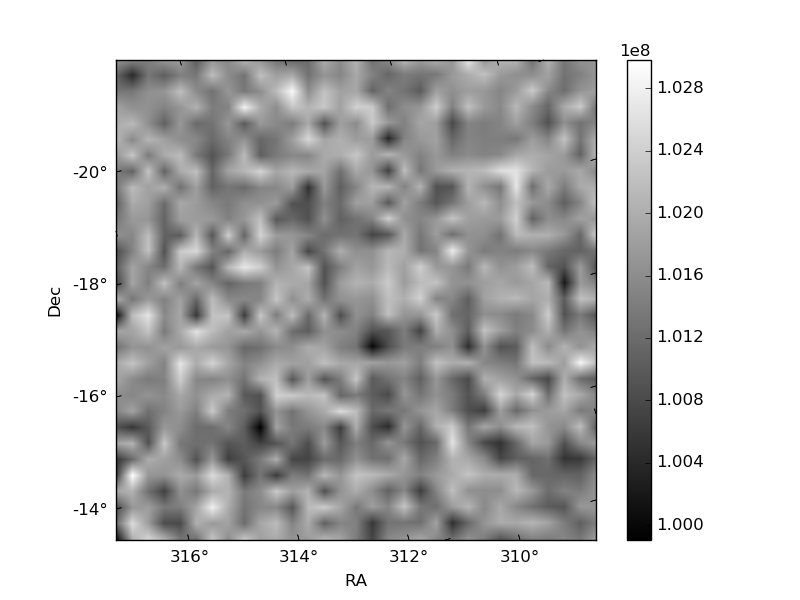 |
| Module-wise count rates for Quadrant D Data is divided into 100 sec bins |
 |
 |
| Parameter | Plot |
|---|---|
| CZT HV Monitor | 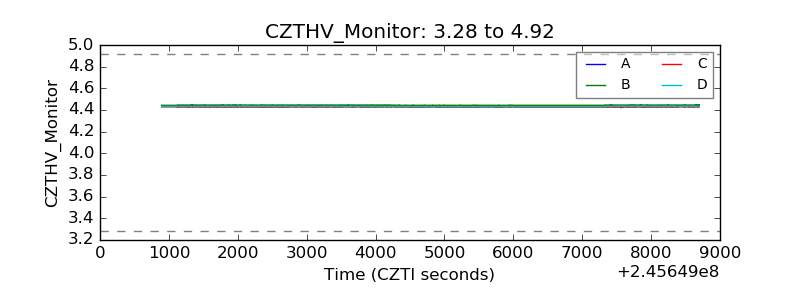 |
| D_VDD | 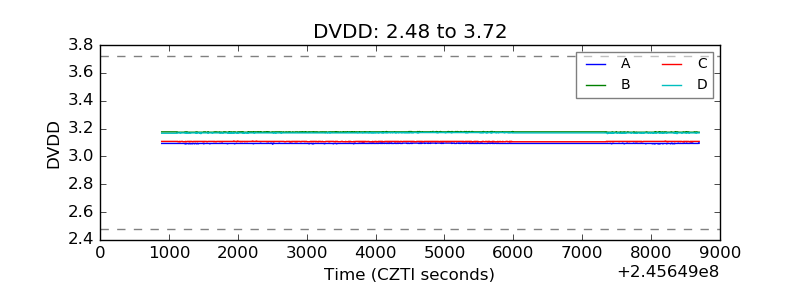 |
| Temperature 1 |  |
| Veto HV Monitor | 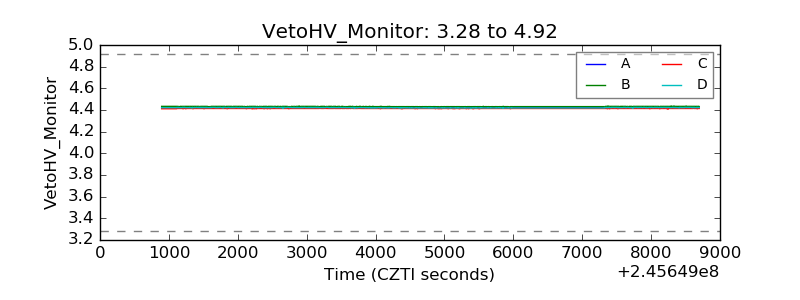 |
| Veto LLD | 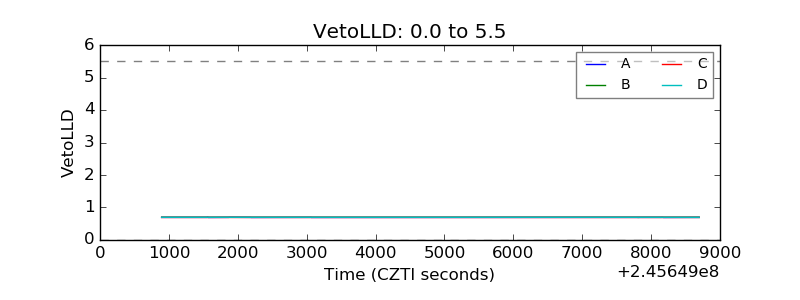 |
| Alpha Counter | 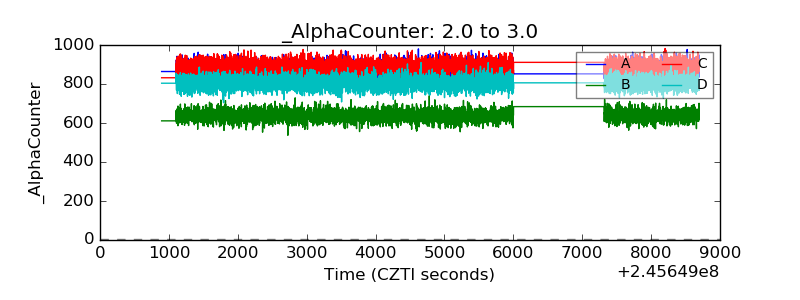 |
| _CPM_Rate | 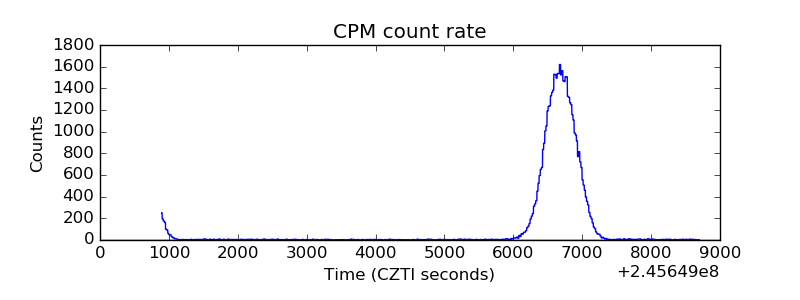 |
| CZT Counter |  |
| +2.5 Volts monitor |  |
| +5 Volts monitor |  |
| _ROLL_ROT | 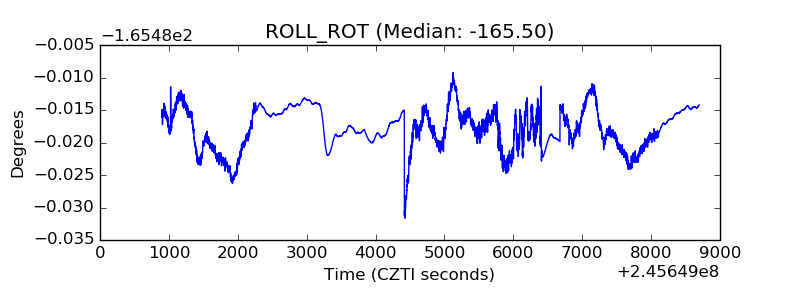 |
| _Roll_DEC | 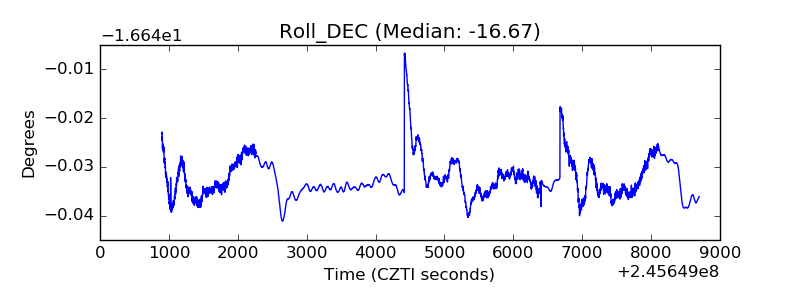 |
| _Roll_RA | 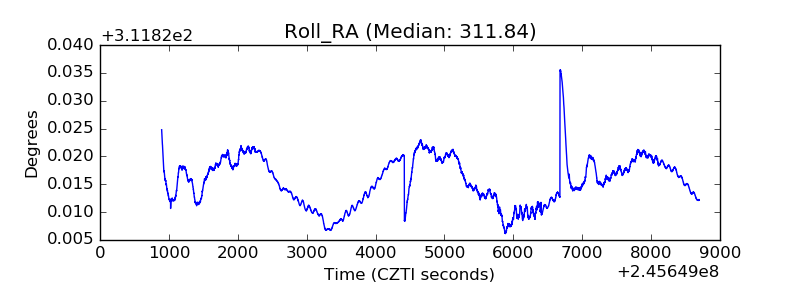 |
| Veto Counter | 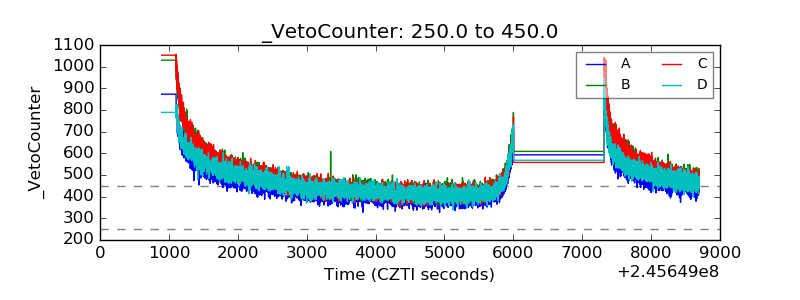 |