| Param | Original file | Final file |
|---|---|---|
| Filename | modeM0/AS1C03_006T01_9000001608_11059cztM0_level2.evt | modeM0/AS1C03_006T01_9000001608_11059cztM0_level2_quad_clean.evt |
| Size (bytes) | 494,435,520 | 70,254,720 |
| Size | 471.5 MB | 67.0 MB |
| Events in quadrant A | 3,325,385 | 425,615 |
| Events in quadrant B | 4,427,333 | 424,621 |
| Events in quadrant C | 3,122,674 | 429,509 |
| Events in quadrant D | 3,670,180 | 406,770 |
| Mode M9 | |||
|---|---|---|---|
| Quadrant | BADHDUFLAG | Total packets | Discarded packets |
| A | 0 | 18 | 0 |
| B | 0 | 18 | 0 |
| C | 0 | 18 | 0 |
| D | 0 | 19 | 0 |
| Mode M0 | |||
|---|---|---|---|
| Quadrant | BADHDUFLAG | Total packets | Discarded packets |
| A | 0 | 13586 | 2 |
| B | 0 | 17120 | 1 |
| C | 0 | 13178 | 1 |
| D | 0 | 14773 | 1 |
| Mode SS | |||
|---|---|---|---|
| Quadrant | BADHDUFLAG | Total packets | Discarded packets |
| A | 0 | 128 | 0 |
| B | 0 | 128 | 0 |
| C | 0 | 128 | 0 |
| D | 0 | 128 | 0 |
| Quadrant | Total seconds | Saturated seconds | Saturation percentage |
|---|---|---|---|
| A | 6314 | 83 | 1.314539% |
| B | 6314 | 355 | 5.622426% |
| C | 6314 | 63 | 0.997783% |
| D | 6314 | 105 | 1.662971% |
Noise dominated data is calculated using 1-second bins in cleaned event files. If a bin has >2000 counts, and if more than 50% of those come from <1% of pixels, then it is considered to be noise-dominated and hence unusable.
| Quadrant | # 1 sec bins | Bins with >0 counts | Bins with >2000 counts | High rate bins dominated by noise | Noise dominated (total time) | Noise dominated (detector-on time) | Marked lightcurve |
|---|---|---|---|---|---|---|---|
| A | 7594 | 6315 | 2 | 2 | 0.03% | 0.03% | 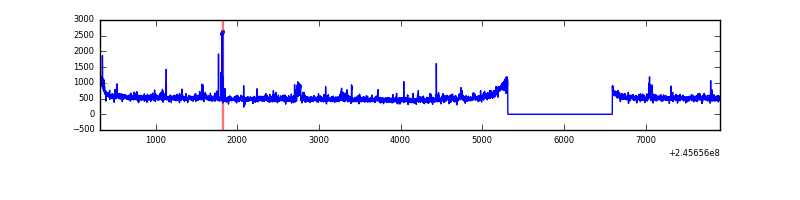 |
| B | 7594 | 6315 | 171 | 171 | 2.25% | 2.71% |  |
| C | 7594 | 6315 | 0 | 0 | 0.00% | 0.00% | 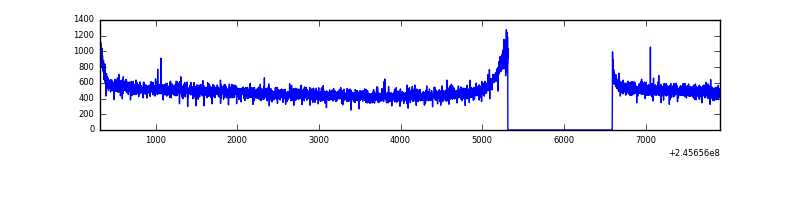 |
| D | 7594 | 6315 | 35 | 35 | 0.46% | 0.55% |  |
Top three noisy pixels from each quadrant. If the there are fewer than three noisy pixels in the level2.evt file, extra rows are filled as -1
| Pixel properties | Quadrant properties | ||||||
|---|---|---|---|---|---|---|---|
| Quadrant | DetID | PixID | Counts | Sigma | Mean | Median | Sigma |
| A | 14 | 238 | 92456 | 548.29 | 823 | 803 | 167.2 |
| A | 15 | 174 | 52483 | 309.16 | 823 | 803 | 167.2 |
| A | 11 | 29 | 12089 | 67.52 | 823 | 803 | 167.2 |
| B | 4 | 239 | 1166708 | 7603.96 | 814 | 796 | 153.3 |
| B | 15 | 204 | 29850 | 189.49 | 814 | 796 | 153.3 |
| B | 0 | 214 | 23764 | 149.8 | 814 | 796 | 153.3 |
| C | 13 | 61 | 6001 | 28.18 | 799 | 806 | 184.3 |
| C | 14 | 234 | 3729 | 15.86 | 799 | 806 | 184.3 |
| C | 14 | 67 | 2020 | 6.59 | 799 | 806 | 184.3 |
| D | 11 | 129 | 173242 | 915.59 | 790 | 770 | 188.4 |
| D | 1 | 52 | 152055 | 803.12 | 790 | 770 | 188.4 |
| D | 10 | 253 | 129354 | 682.61 | 790 | 770 | 188.4 |
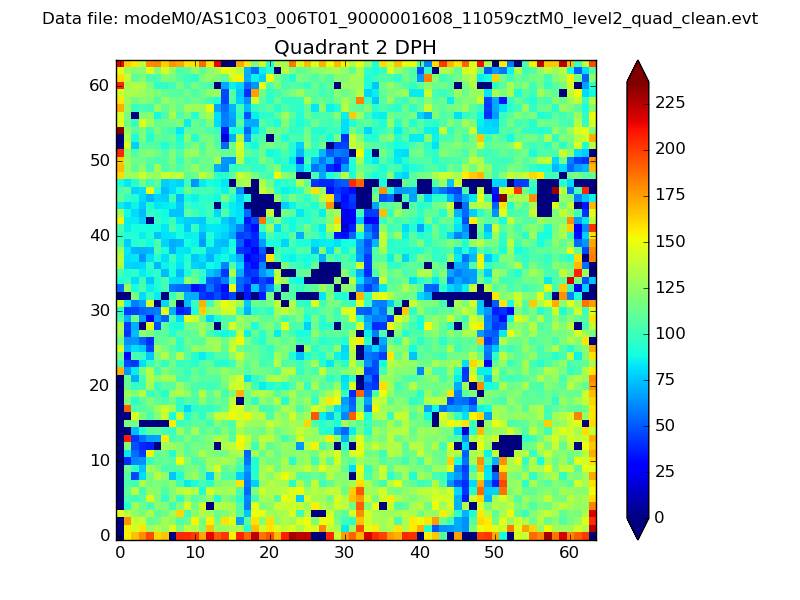
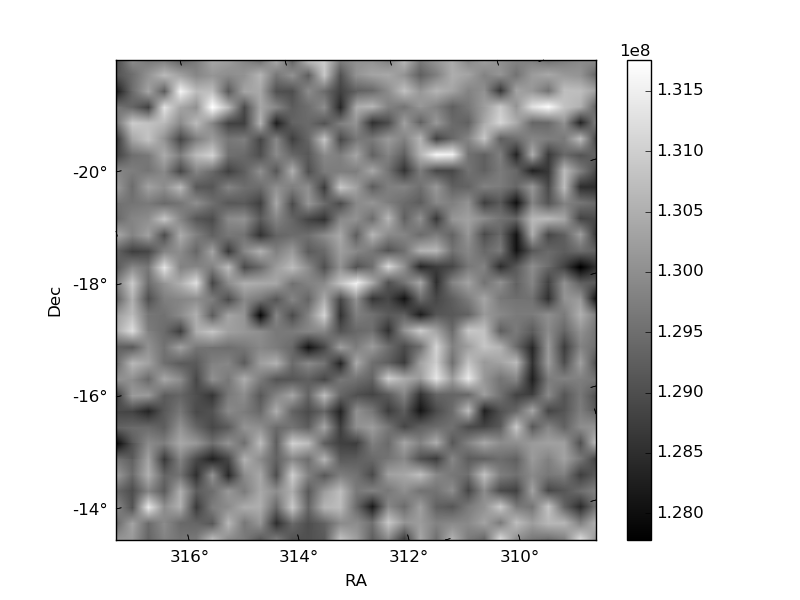
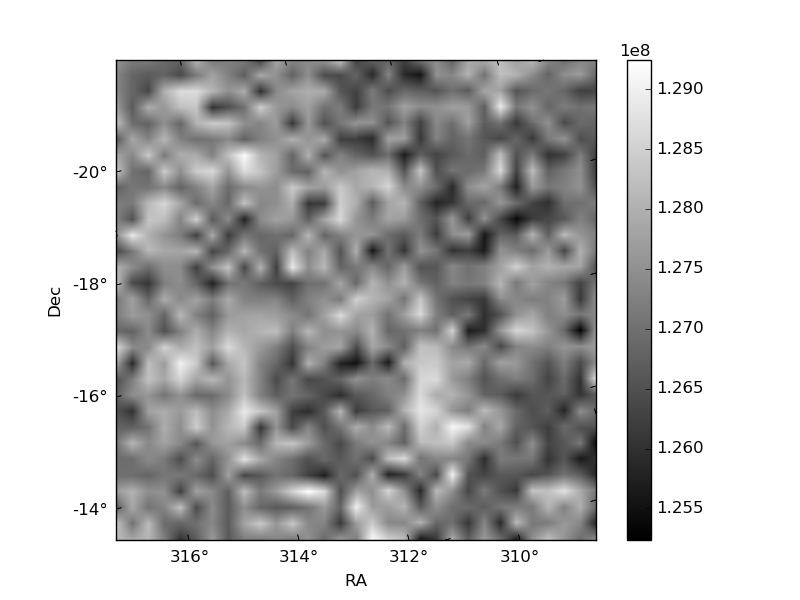
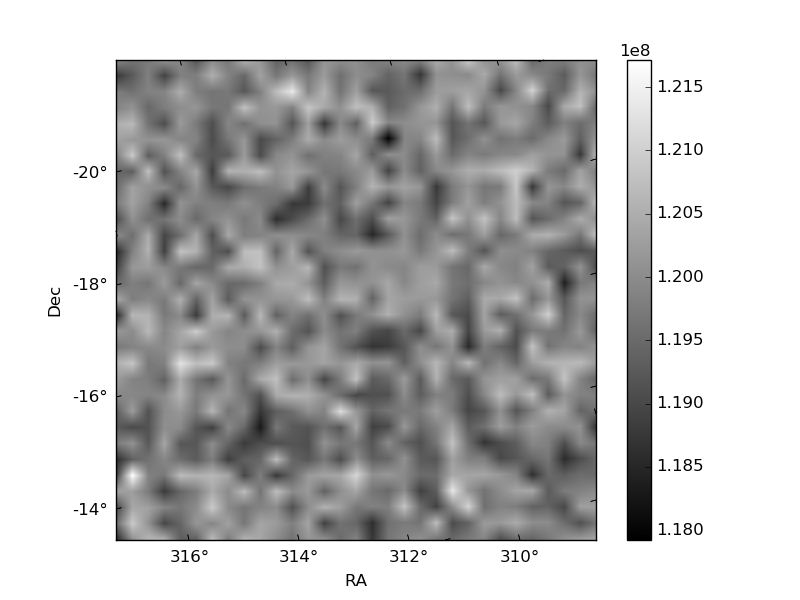
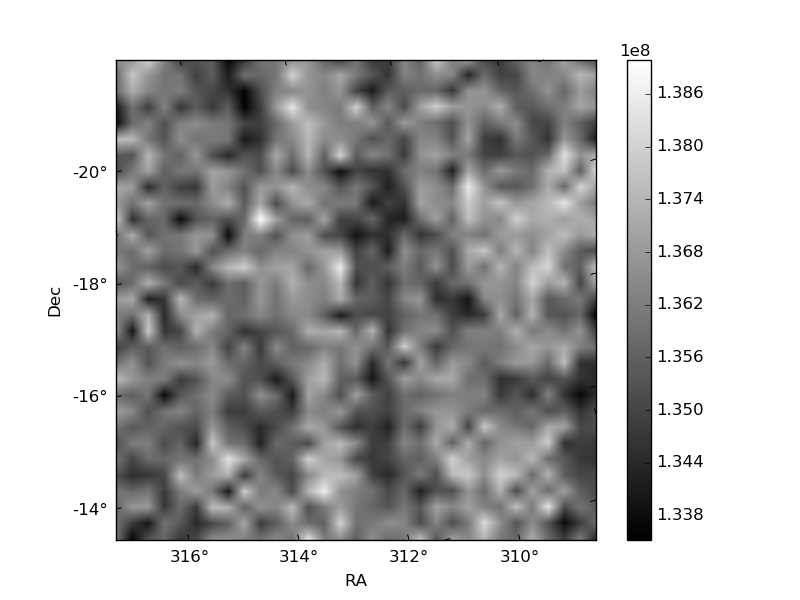
Histogram calculated using DETX and DETY for each event in the final _common_clean file
| Quadrant A | 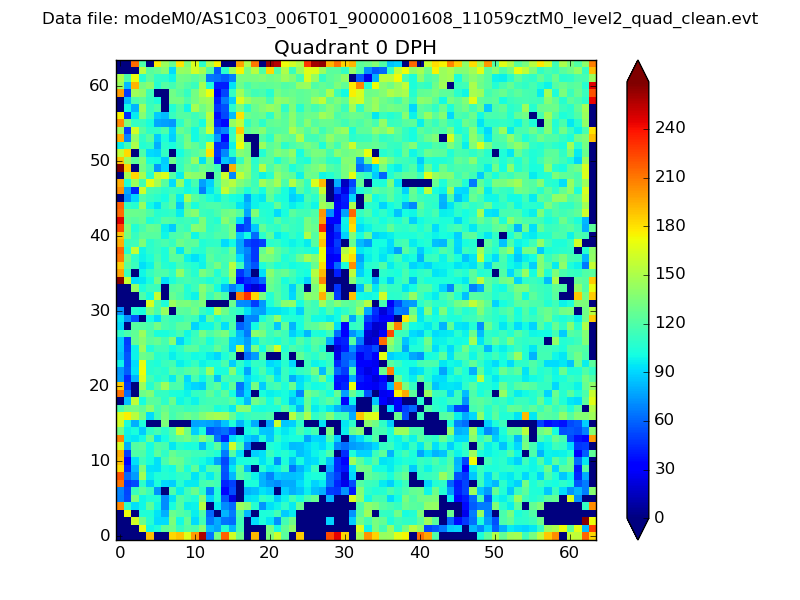 |
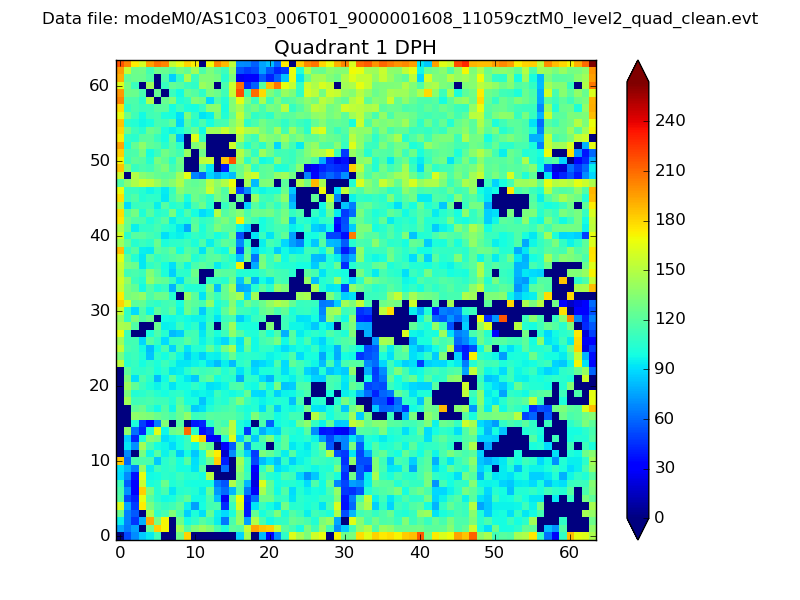 |
Quadrant B |
|---|---|---|---|
| Quadrant D | 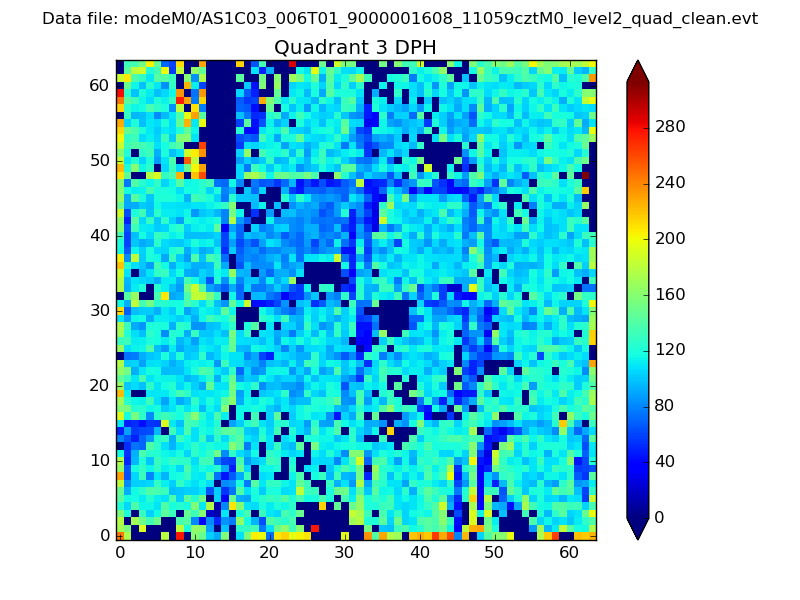 |
 |
Quadrant C |
| Plot type | Count rate plots | Images |
|---|---|---|
| Comparison with Poisson distribution Blue bars denote a histogram of data divided into 1 sec bins. Red curve is a Poisson curve with rate = median count rate of data. |
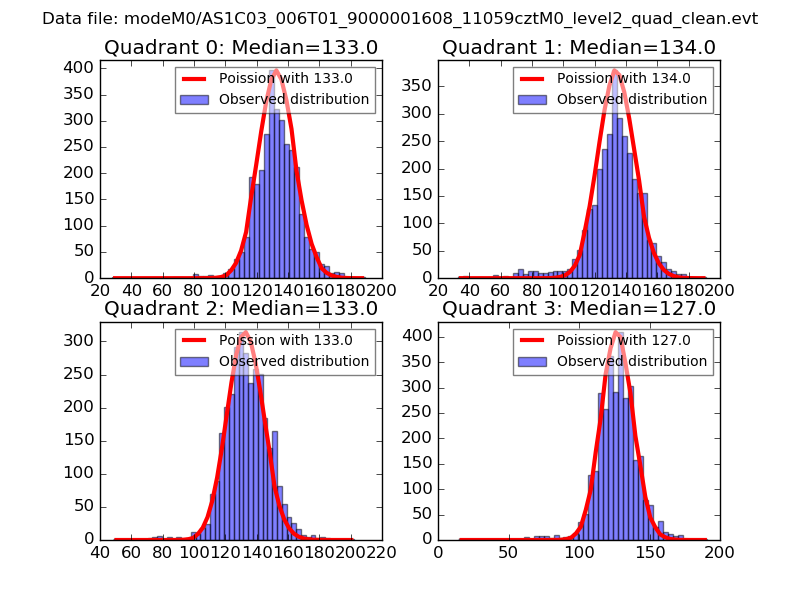 |
 |
| Quadrant-wise count rates Data is divided into 100 sec bins |
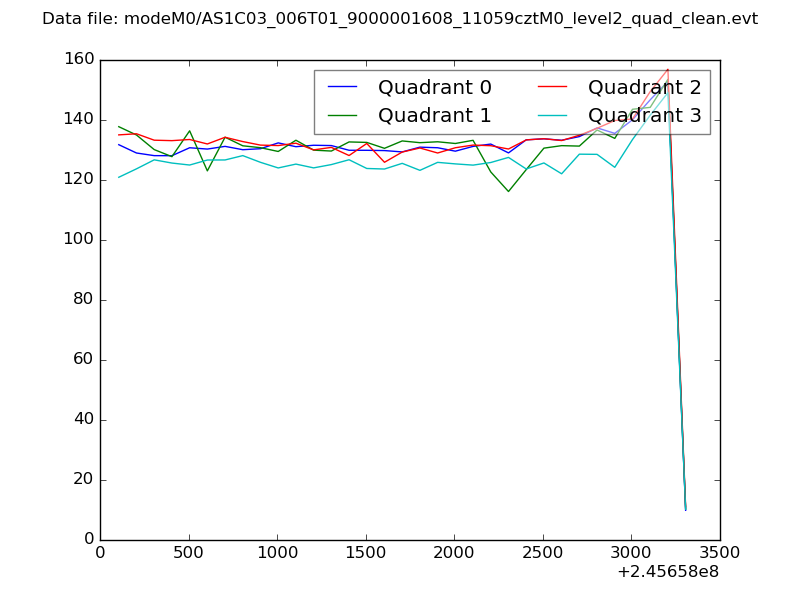 |
|
| Module-wise count rates for Quadrant A Data is divided into 100 sec bins |
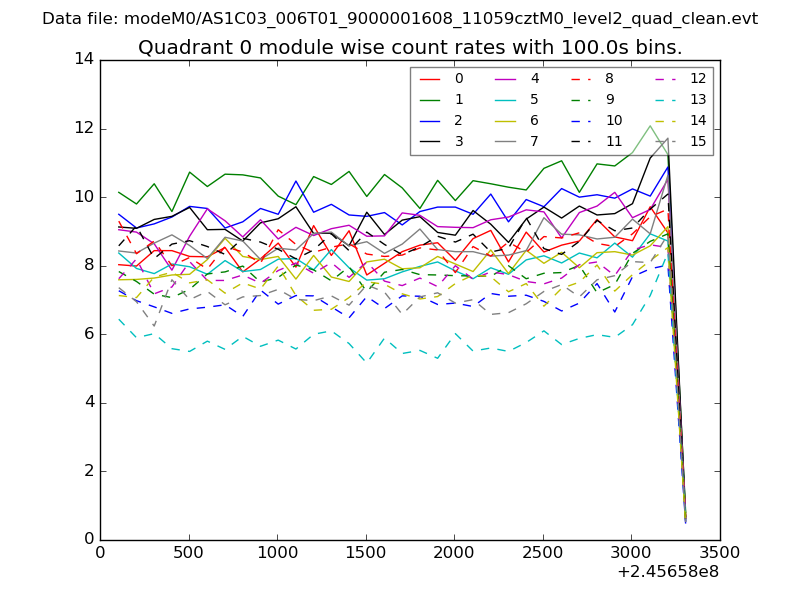 |
 |
| Module-wise count rates for Quadrant B Data is divided into 100 sec bins |
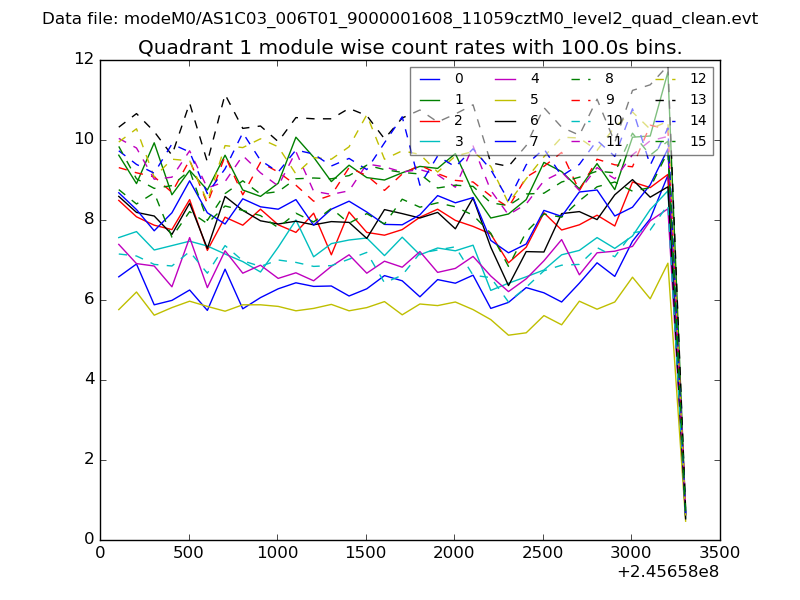 |
 |
| Module-wise count rates for Quadrant C Data is divided into 100 sec bins |
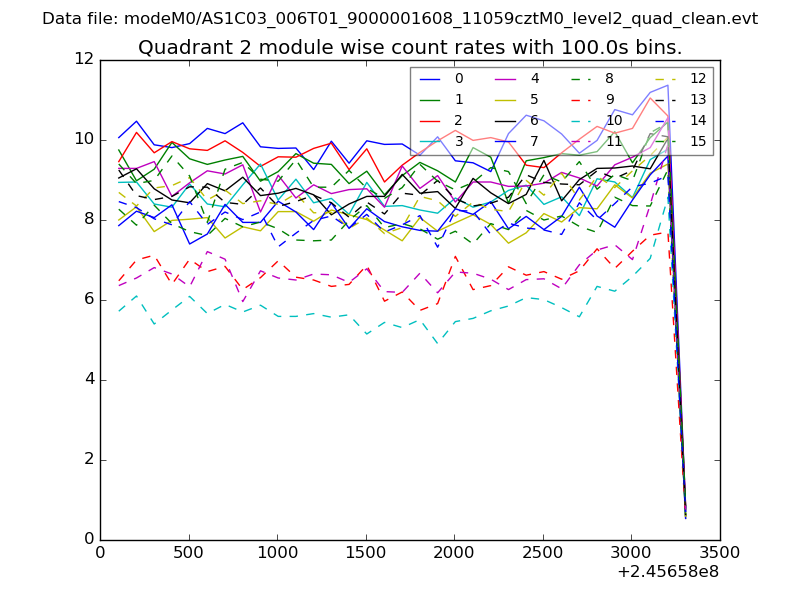 |
 |
| Module-wise count rates for Quadrant D Data is divided into 100 sec bins |
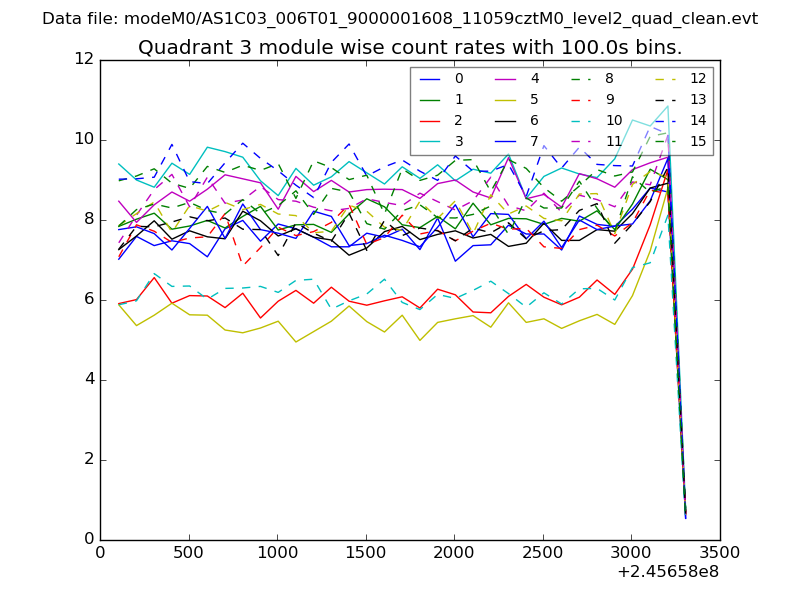 |
 |
| Parameter | Plot |
|---|---|
| CZT HV Monitor | 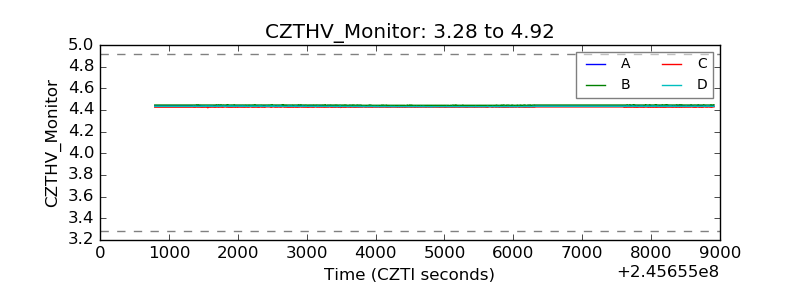 |
| D_VDD | 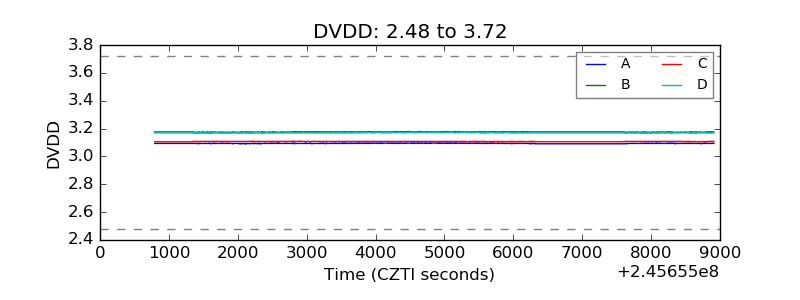 |
| Temperature 1 |  |
| Veto HV Monitor | 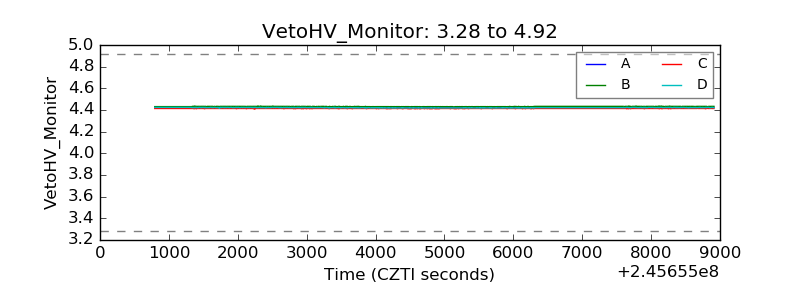 |
| Veto LLD |  |
| Alpha Counter | 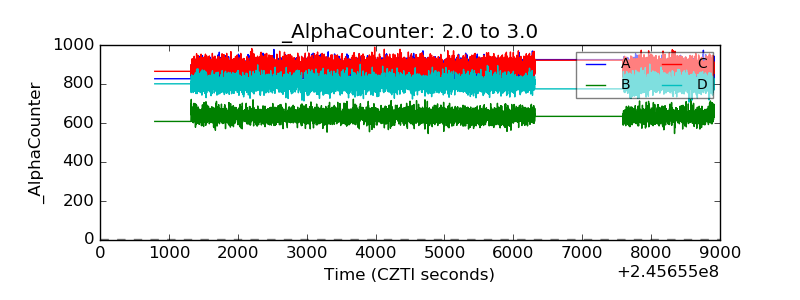 |
| _CPM_Rate | 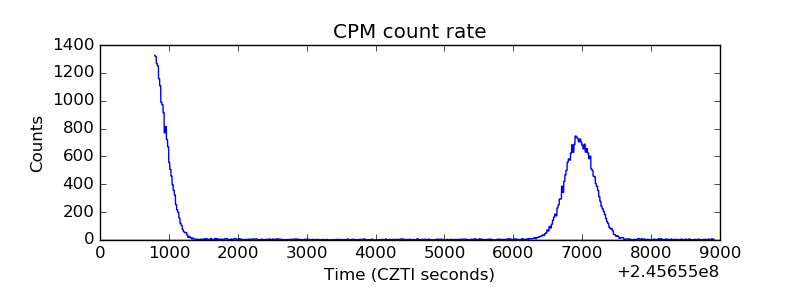 |
| CZT Counter | 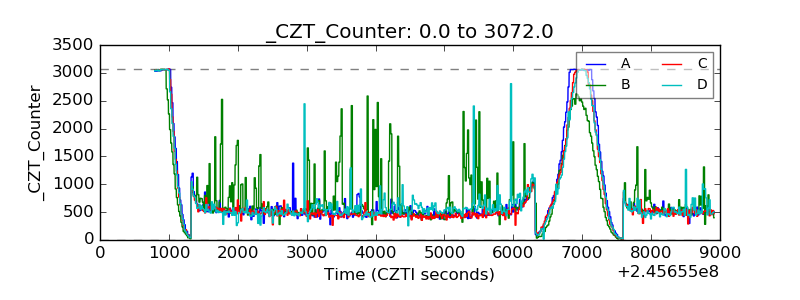 |
| +2.5 Volts monitor |  |
| +5 Volts monitor |  |
| _ROLL_ROT | 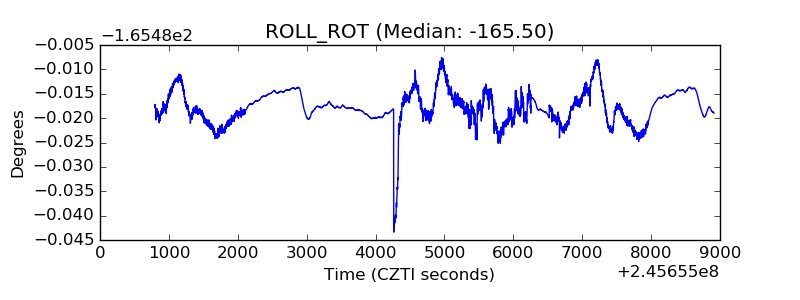 |
| _Roll_DEC | 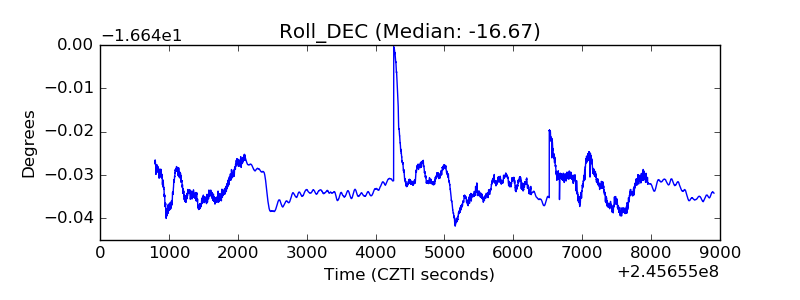 |
| _Roll_RA | 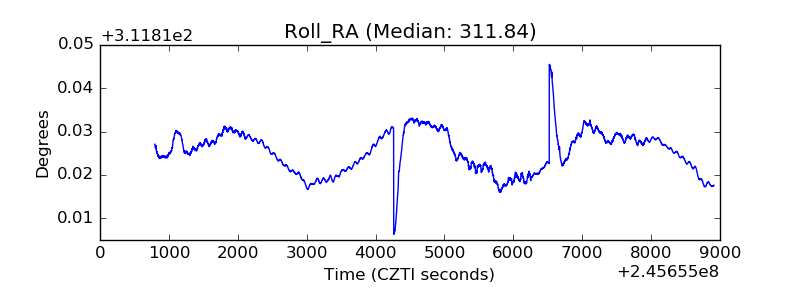 |
| Veto Counter |  |