| Param | Original file | Final file |
|---|---|---|
| Filename | modeM0/AS1C03_006T01_9000001608_11060cztM0_level2.evt | modeM0/AS1C03_006T01_9000001608_11060cztM0_level2_quad_clean.evt |
| Size (bytes) | 547,107,840 | 79,712,640 |
| Size | 521.8 MB | 76.0 MB |
| Events in quadrant A | 4,914,285 | 475,524 |
| Events in quadrant B | 4,390,778 | 499,899 |
| Events in quadrant C | 3,138,298 | 502,151 |
| Events in quadrant D | 3,680,673 | 478,113 |
| Mode M9 | |||
|---|---|---|---|
| Quadrant | BADHDUFLAG | Total packets | Discarded packets |
| A | 0 | 16 | 0 |
| B | 0 | 16 | 0 |
| C | 0 | 16 | 0 |
| D | 0 | 17 | 0 |
| Mode M0 | |||
|---|---|---|---|
| Quadrant | BADHDUFLAG | Total packets | Discarded packets |
| A | 0 | 18700 | 2 |
| B | 0 | 17147 | 1 |
| C | 0 | 13636 | 1 |
| D | 0 | 15137 | 1 |
| Mode SS | |||
|---|---|---|---|
| Quadrant | BADHDUFLAG | Total packets | Discarded packets |
| A | 0 | 132 | 0 |
| B | 0 | 132 | 0 |
| C | 0 | 132 | 0 |
| D | 0 | 132 | 0 |
| Quadrant | Total seconds | Saturated seconds | Saturation percentage |
|---|---|---|---|
| A | 6569 | 541 | 8.235652% |
| B | 6569 | 360 | 5.480286% |
| C | 6569 | 90 | 1.370072% |
| D | 6569 | 128 | 1.948546% |
Noise dominated data is calculated using 1-second bins in cleaned event files. If a bin has >2000 counts, and if more than 50% of those come from <1% of pixels, then it is considered to be noise-dominated and hence unusable.
| Quadrant | # 1 sec bins | Bins with >0 counts | Bins with >2000 counts | High rate bins dominated by noise | Noise dominated (total time) | Noise dominated (detector-on time) | Marked lightcurve |
|---|---|---|---|---|---|---|---|
| A | 7564 | 6569 | 379 | 379 | 5.01% | 5.77% | 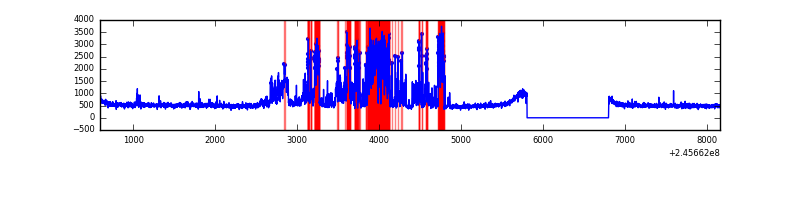 |
| B | 7564 | 6569 | 138 | 138 | 1.82% | 2.10% |  |
| C | 7564 | 6569 | 0 | 0 | 0.00% | 0.00% |  |
| D | 7564 | 6569 | 33 | 33 | 0.44% | 0.50% | 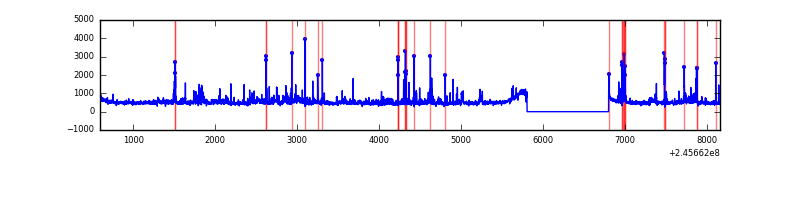 |
Top three noisy pixels from each quadrant. If the there are fewer than three noisy pixels in the level2.evt file, extra rows are filled as -1
| Pixel properties | Quadrant properties | ||||||
|---|---|---|---|---|---|---|---|
| Quadrant | DetID | PixID | Counts | Sigma | Mean | Median | Sigma |
| A | 13 | 210 | 1537759 | 9227.62 | 816 | 799 | 166.6 |
| A | 15 | 174 | 158937 | 949.43 | 816 | 799 | 166.6 |
| A | 14 | 238 | 67479 | 400.33 | 816 | 799 | 166.6 |
| B | 4 | 239 | 981093 | 6253.72 | 820 | 801 | 156.8 |
| B | 0 | 197 | 68027 | 428.86 | 820 | 801 | 156.8 |
| B | 11 | 51 | 41899 | 262.18 | 820 | 801 | 156.8 |
| C | 13 | 61 | 5882 | 27.2 | 804 | 810 | 186.5 |
| C | 14 | 67 | 2859 | 10.99 | 804 | 810 | 186.5 |
| C | 14 | 234 | 2803 | 10.69 | 804 | 810 | 186.5 |
| D | 1 | 52 | 293006 | 1528.43 | 802 | 779 | 191.2 |
| D | 2 | 136 | 76503 | 396.06 | 802 | 779 | 191.2 |
| D | 10 | 253 | 72067 | 372.86 | 802 | 779 | 191.2 |
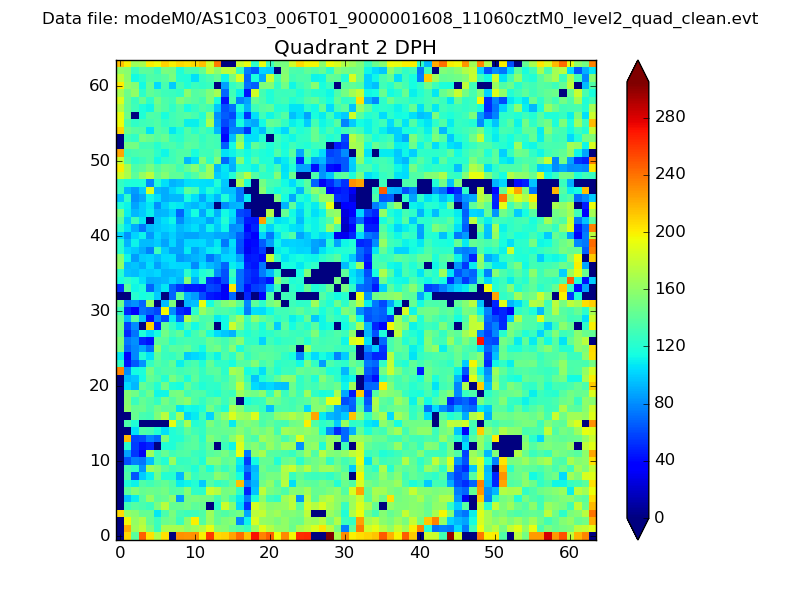
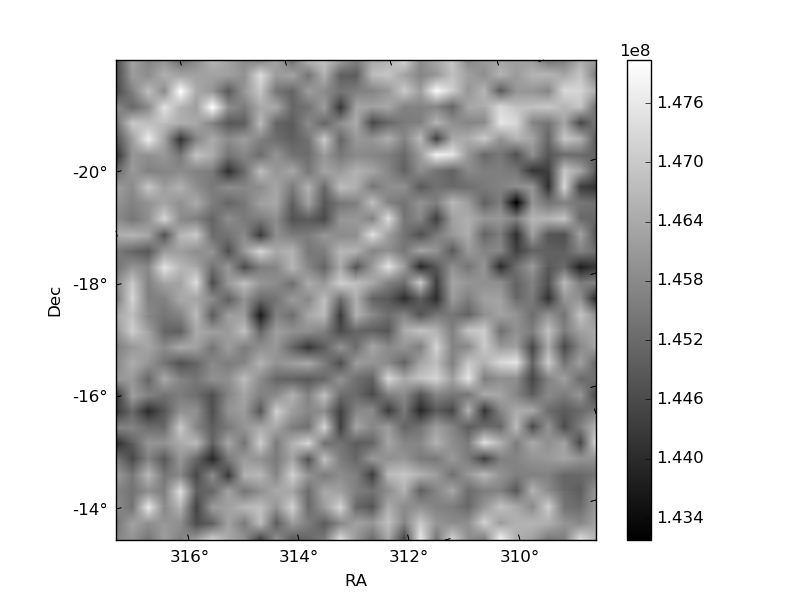
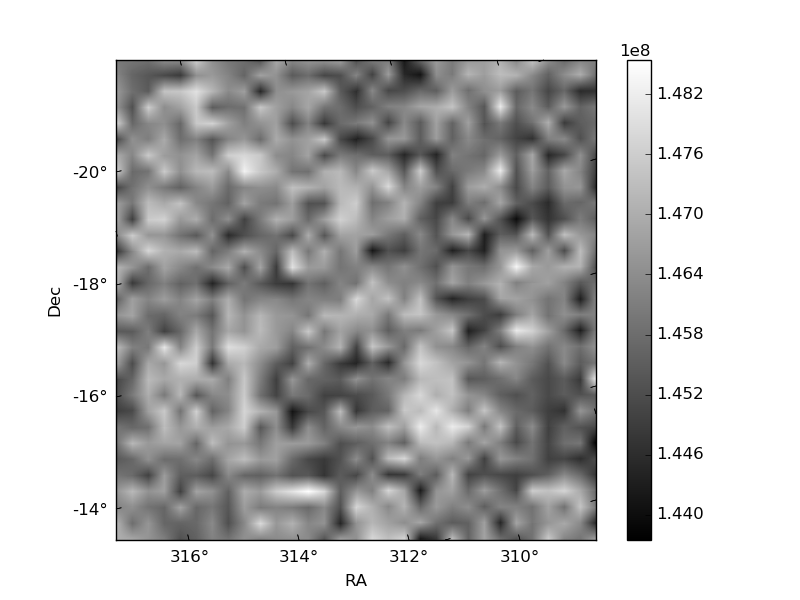
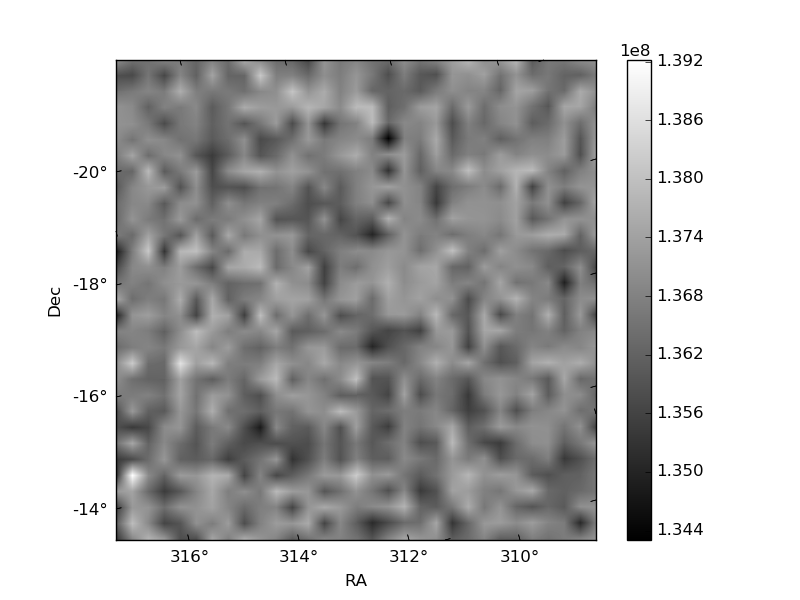
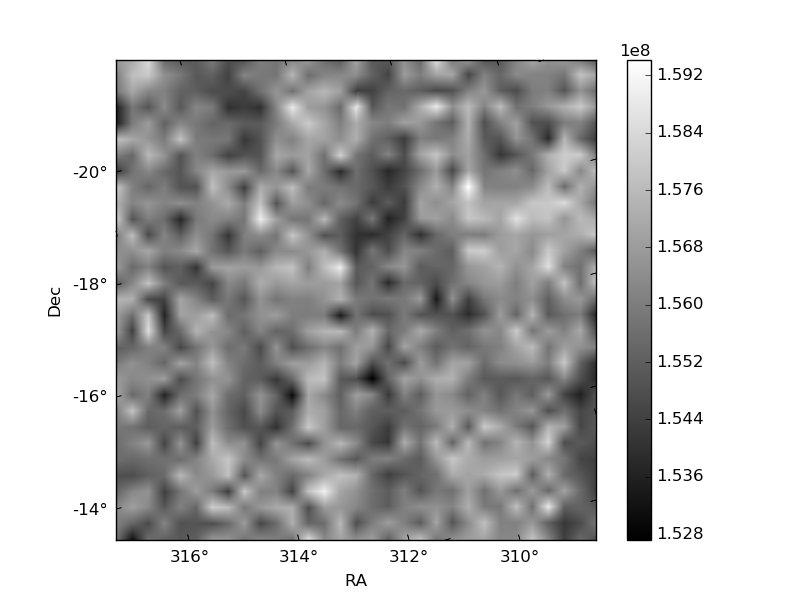
Histogram calculated using DETX and DETY for each event in the final _common_clean file
| Quadrant A | 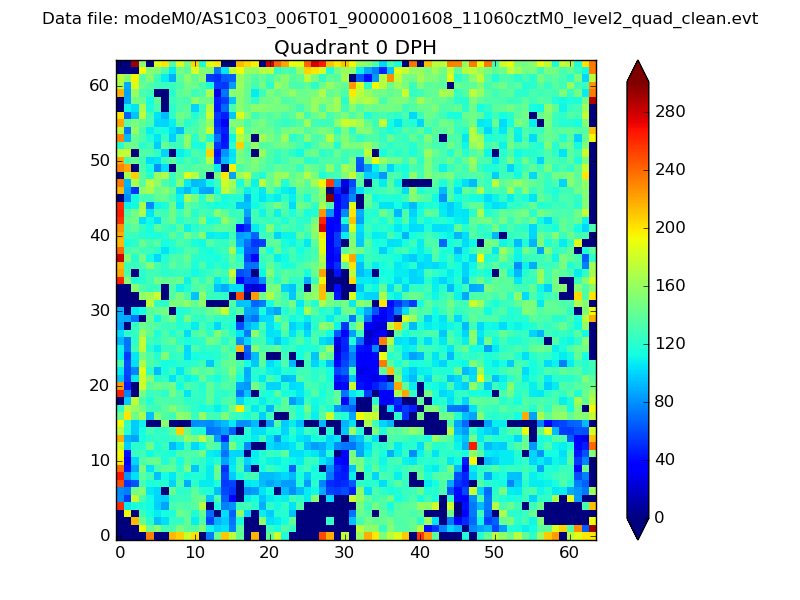 |
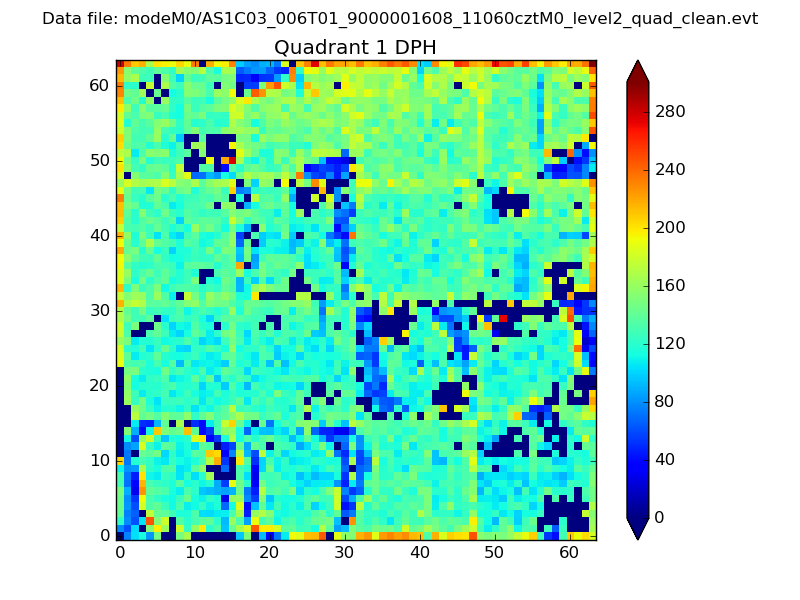 |
Quadrant B |
|---|---|---|---|
| Quadrant D | 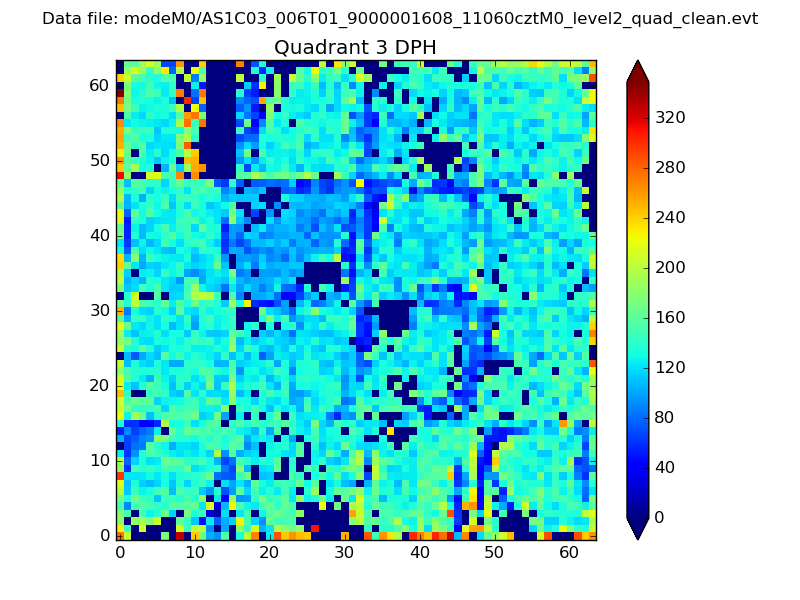 |
 |
Quadrant C |
| Plot type | Count rate plots | Images |
|---|---|---|
| Comparison with Poisson distribution Blue bars denote a histogram of data divided into 1 sec bins. Red curve is a Poisson curve with rate = median count rate of data. |
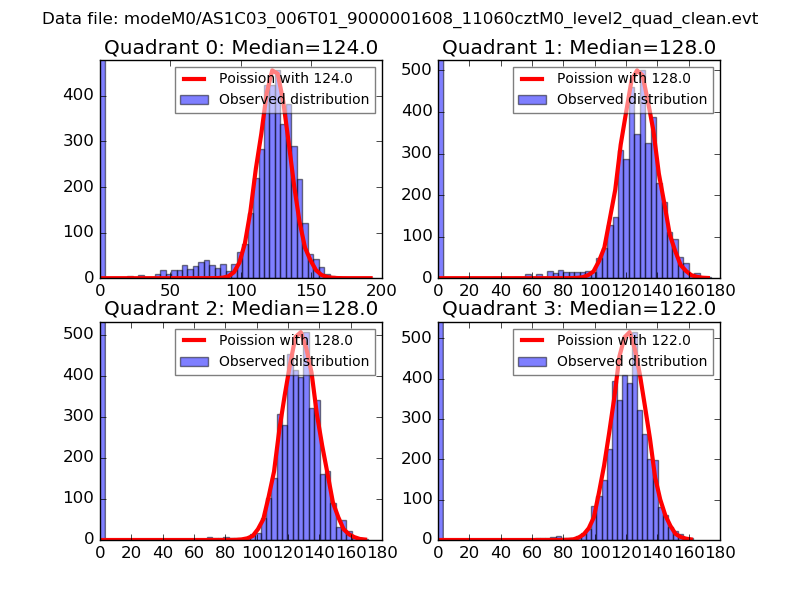 |
 |
| Quadrant-wise count rates Data is divided into 100 sec bins |
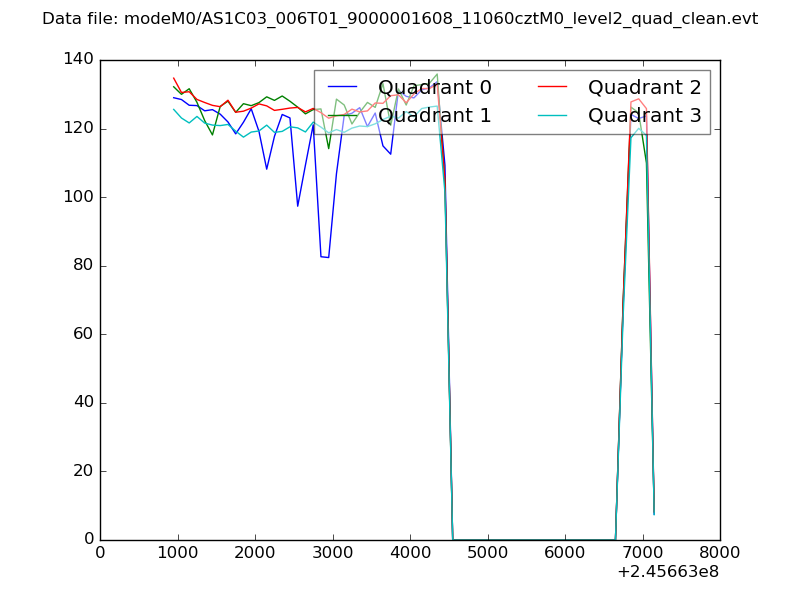 |
|
| Module-wise count rates for Quadrant A Data is divided into 100 sec bins |
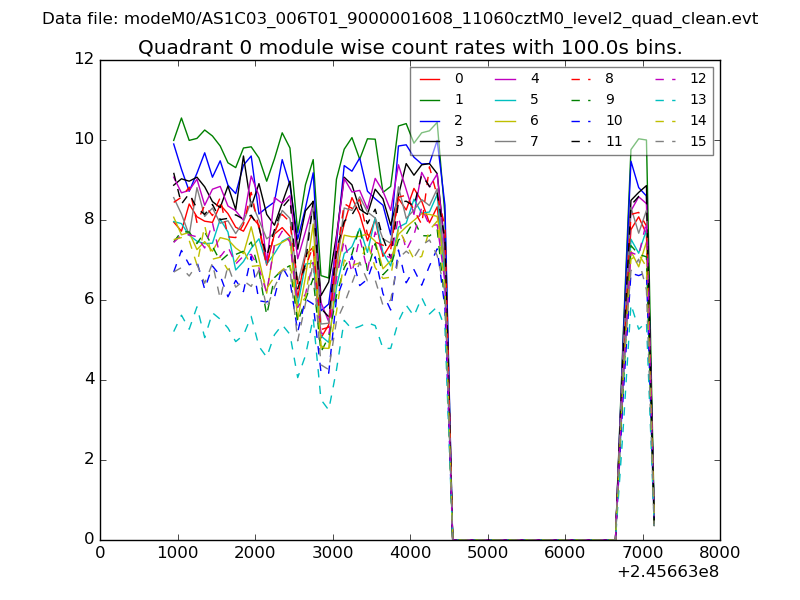 |
 |
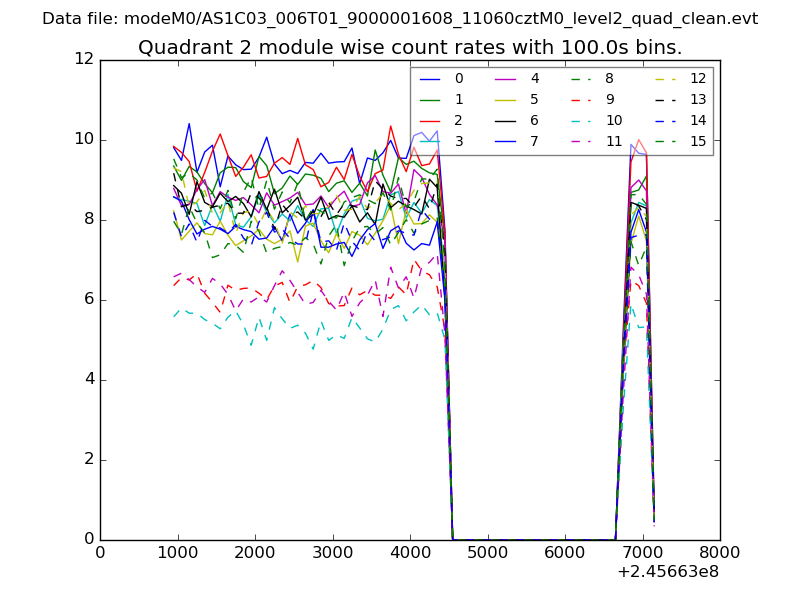
| Module-wise count rates for Quadrant B Data is divided into 100 sec bins |
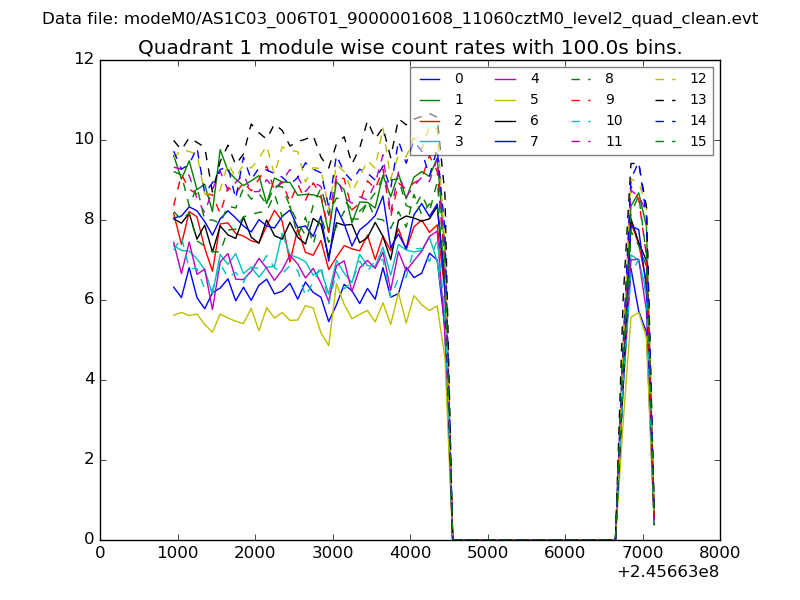 |
 |
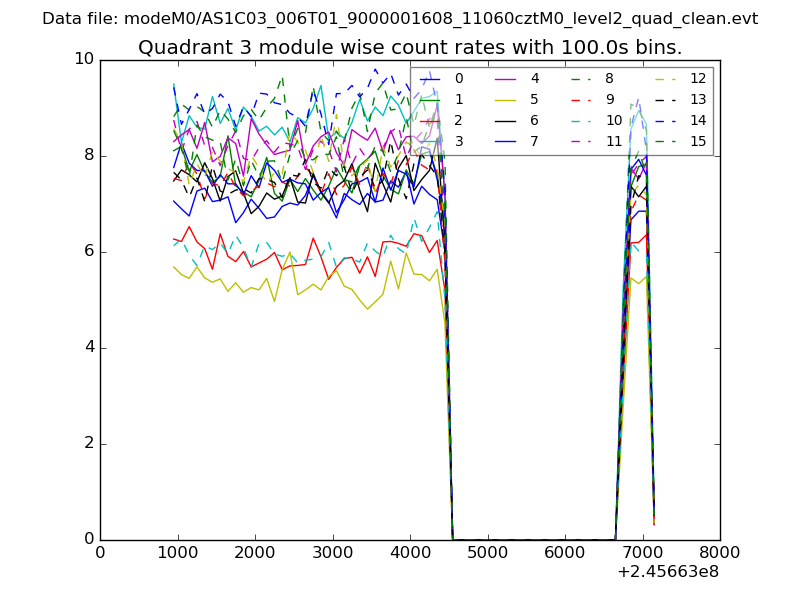
| Module-wise count rates for Quadrant C Data is divided into 100 sec bins |
 |
 |
| Module-wise count rates for Quadrant D Data is divided into 100 sec bins |
 |
 |
| Parameter | Plot |
|---|---|
| CZT HV Monitor | 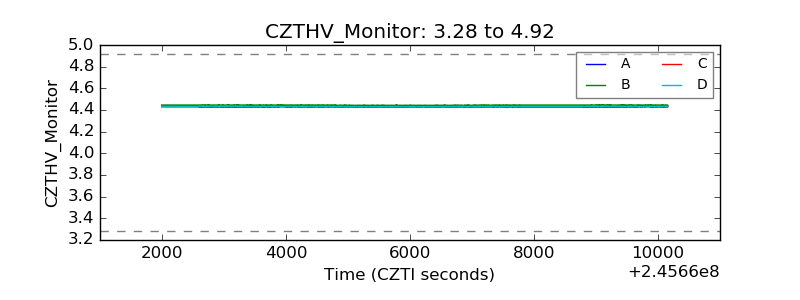 |
| D_VDD | 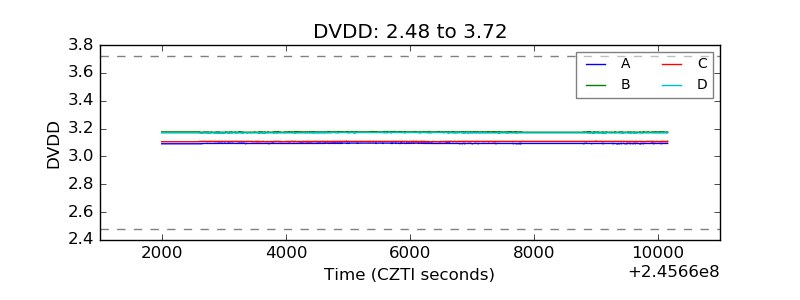 |
| Temperature 1 | 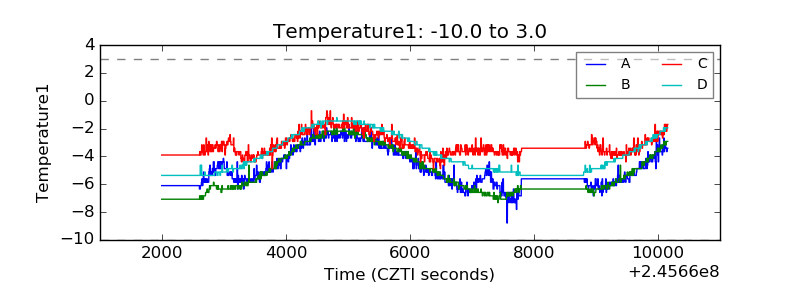 |
| Veto HV Monitor | 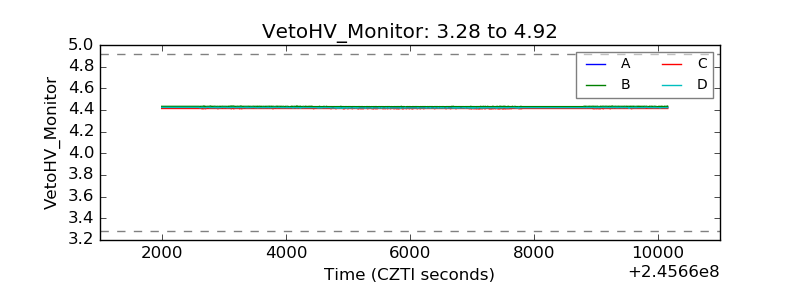 |
| Veto LLD |  |
| Alpha Counter | 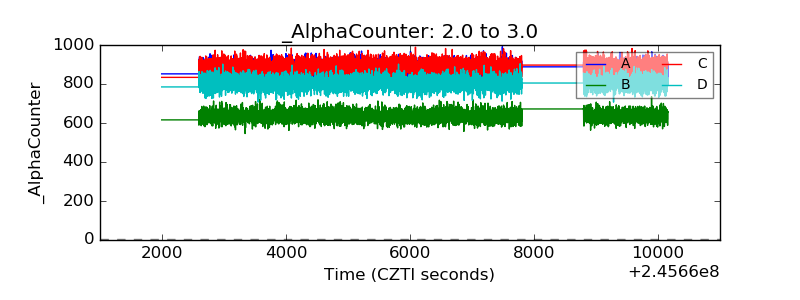 |
| _CPM_Rate | 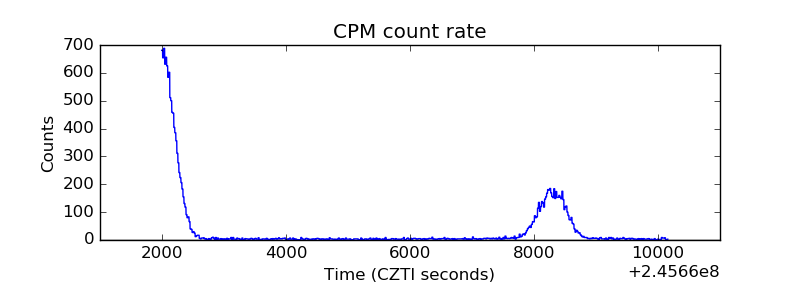 |
| CZT Counter | 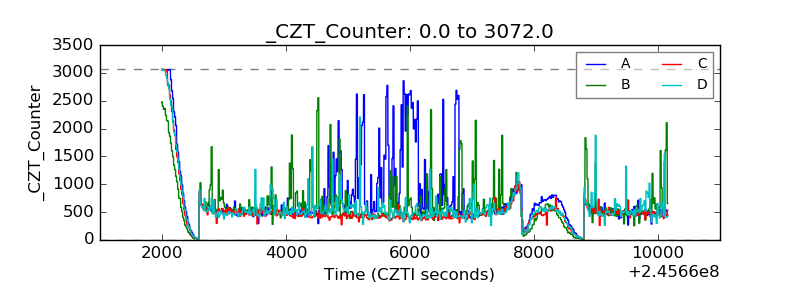 |
| +2.5 Volts monitor |  |
| +5 Volts monitor |  |
| _ROLL_ROT | 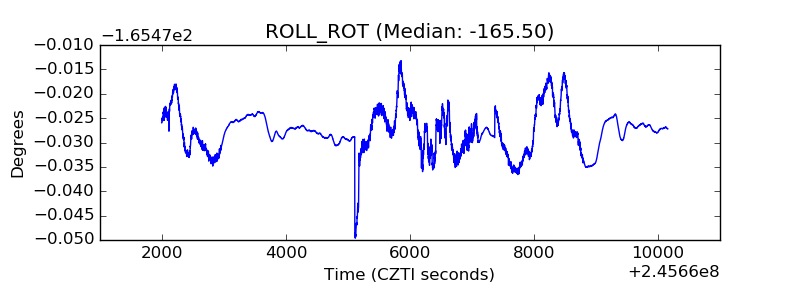 |
| _Roll_DEC | 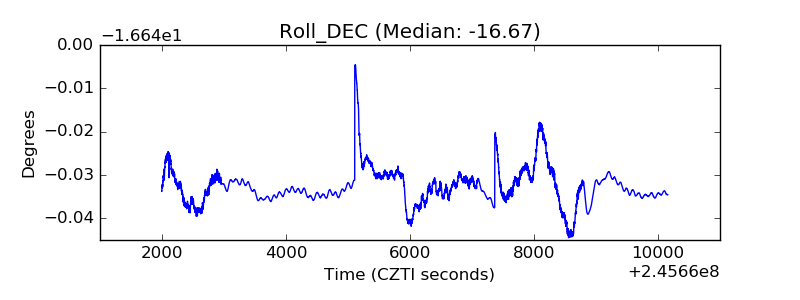 |
| _Roll_RA | 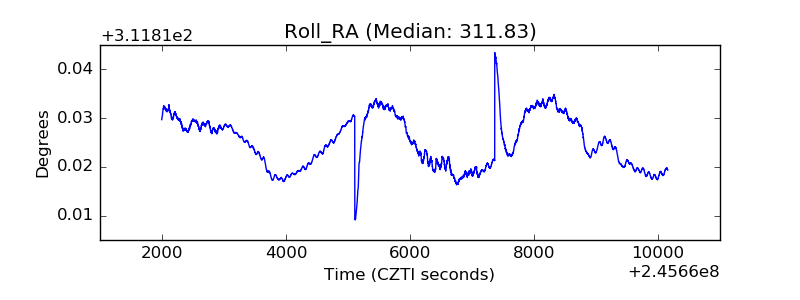 |
| Veto Counter | 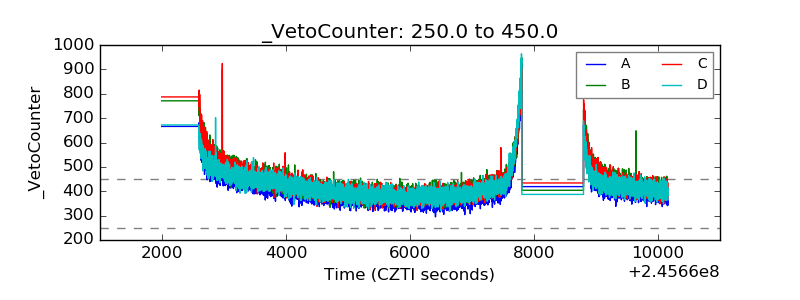 |