| Param | Original file | Final file |
|---|---|---|
| Filename | modeM0/AS1C03_006T01_9000001608_11061cztM0_level2.evt | modeM0/AS1C03_006T01_9000001608_11061cztM0_level2_quad_clean.evt |
| Size (bytes) | 526,089,600 | 85,518,720 |
| Size | 501.7 MB | 81.6 MB |
| Events in quadrant A | 3,502,195 | 531,799 |
| Events in quadrant B | 4,733,825 | 526,938 |
| Events in quadrant C | 3,335,381 | 532,875 |
| Events in quadrant D | 3,881,144 | 505,434 |
| Mode M9 | |||
|---|---|---|---|
| Quadrant | BADHDUFLAG | Total packets | Discarded packets |
| A | 0 | 11 | 0 |
| B | 0 | 11 | 0 |
| C | 0 | 11 | 0 |
| D | 0 | 12 | 0 |
| Mode M0 | |||
|---|---|---|---|
| Quadrant | BADHDUFLAG | Total packets | Discarded packets |
| A | 0 | 15064 | 3 |
| B | 0 | 18704 | 2 |
| C | 0 | 14738 | 2 |
| D | 0 | 16331 | 2 |
| Mode SS | |||
|---|---|---|---|
| Quadrant | BADHDUFLAG | Total packets | Discarded packets |
| A | 0 | 144 | 0 |
| B | 0 | 144 | 0 |
| C | 0 | 144 | 0 |
| D | 0 | 144 | 0 |
| Quadrant | Total seconds | Saturated seconds | Saturation percentage |
|---|---|---|---|
| A | 7071 | 149 | 2.107198% |
| B | 7071 | 452 | 6.392307% |
| C | 7071 | 96 | 1.357658% |
| D | 7071 | 161 | 2.276906% |
Noise dominated data is calculated using 1-second bins in cleaned event files. If a bin has >2000 counts, and if more than 50% of those come from <1% of pixels, then it is considered to be noise-dominated and hence unusable.
| Quadrant | # 1 sec bins | Bins with >0 counts | Bins with >2000 counts | High rate bins dominated by noise | Noise dominated (total time) | Noise dominated (detector-on time) | Marked lightcurve |
|---|---|---|---|---|---|---|---|
| A | 7631 | 7072 | 6 | 6 | 0.08% | 0.08% | 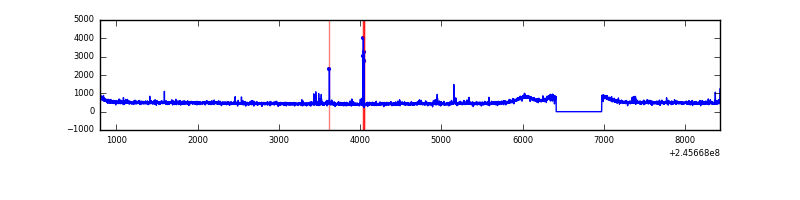 |
| B | 7631 | 7071 | 185 | 185 | 2.42% | 2.62% | 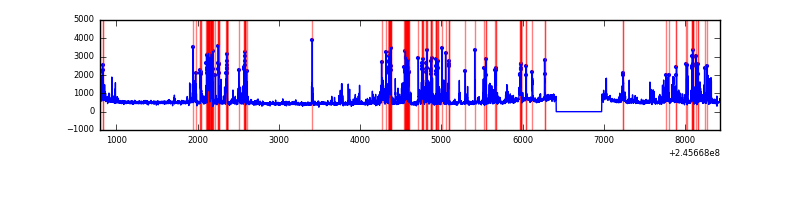 |
| C | 7631 | 7072 | 0 | 0 | 0.00% | 0.00% | 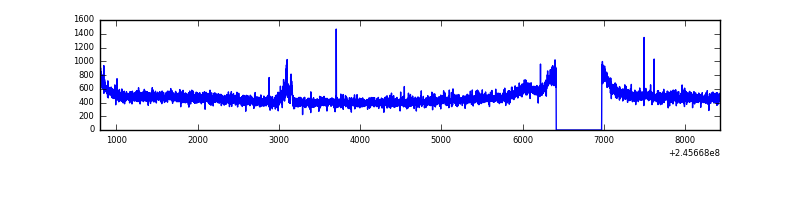 |
| D | 7631 | 7072 | 43 | 43 | 0.56% | 0.61% |  |
Top three noisy pixels from each quadrant. If the there are fewer than three noisy pixels in the level2.evt file, extra rows are filled as -1
| Pixel properties | Quadrant properties | ||||||
|---|---|---|---|---|---|---|---|
| Quadrant | DetID | PixID | Counts | Sigma | Mean | Median | Sigma |
| A | 14 | 238 | 38246 | 207.49 | 886 | 869 | 180.1 |
| A | 15 | 174 | 21819 | 116.3 | 886 | 869 | 180.1 |
| A | 14 | 254 | 19598 | 103.97 | 886 | 869 | 180.1 |
| B | 4 | 239 | 1202731 | 7243.39 | 865 | 843 | 165.9 |
| B | 15 | 204 | 37861 | 223.1 | 865 | 843 | 165.9 |
| B | 3 | 189 | 27018 | 157.75 | 865 | 843 | 165.9 |
| C | 8 | 222 | 28654 | 141.25 | 846 | 851 | 196.8 |
| C | 13 | 61 | 6286 | 27.61 | 846 | 851 | 196.8 |
| C | 14 | 234 | 5625 | 24.25 | 846 | 851 | 196.8 |
| D | 1 | 52 | 205822 | 1001.93 | 849 | 827 | 204.6 |
| D | 13 | 152 | 150191 | 730.03 | 849 | 827 | 204.6 |
| D | 2 | 136 | 77757 | 376.0 | 849 | 827 | 204.6 |
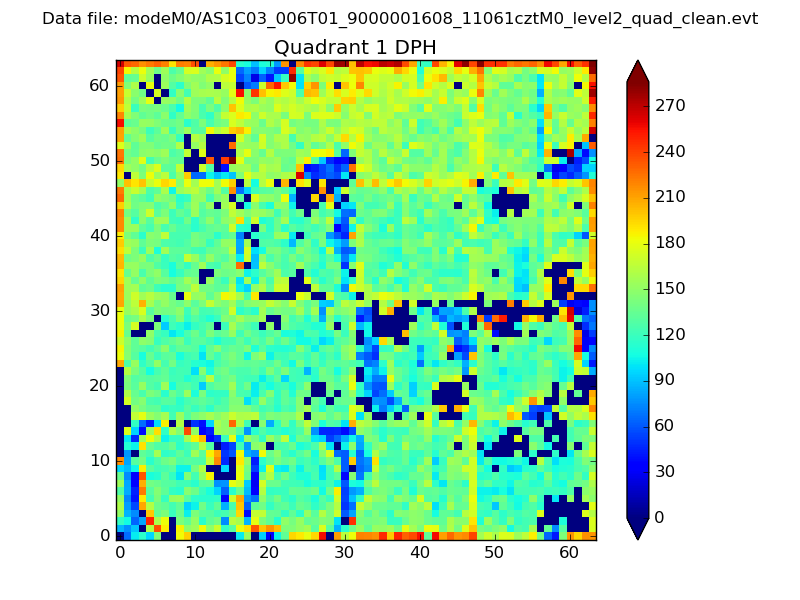
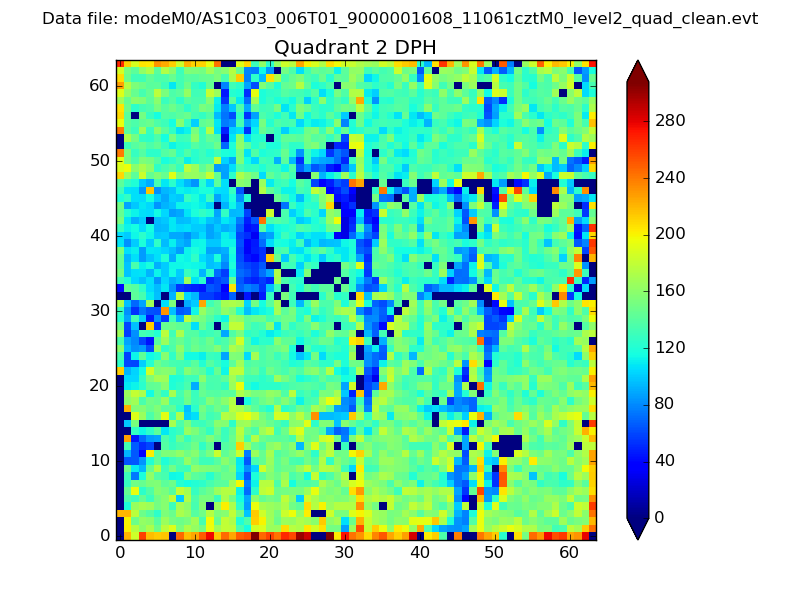
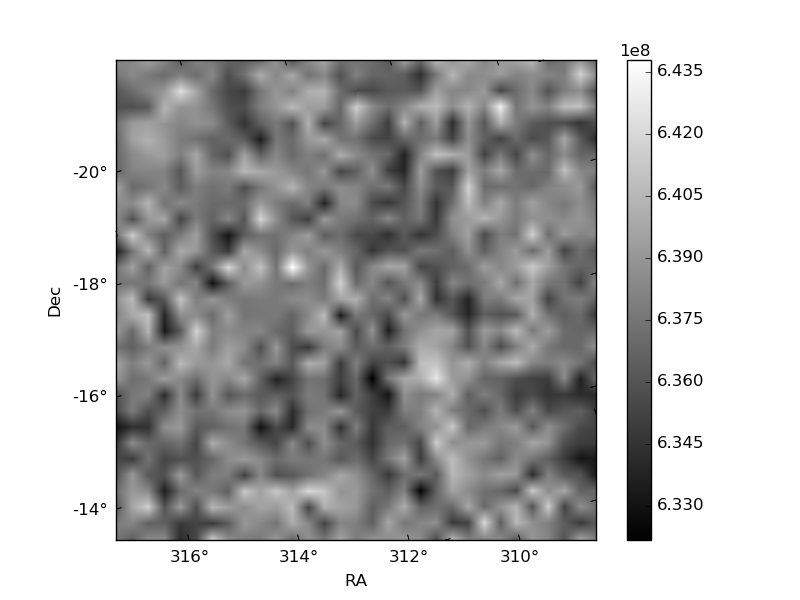
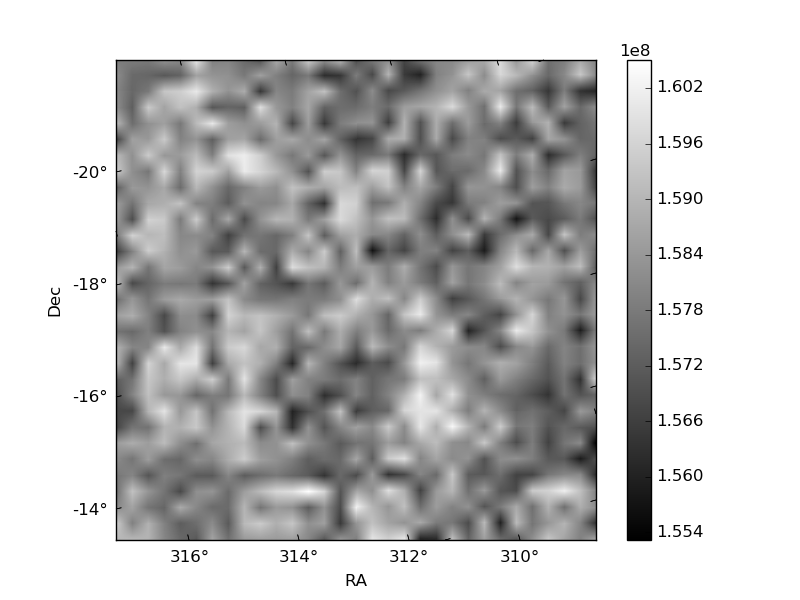
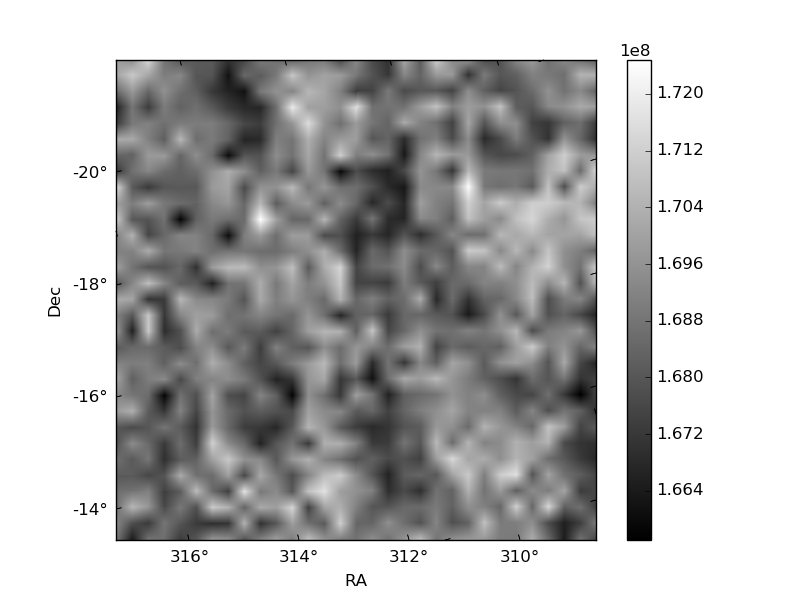
Histogram calculated using DETX and DETY for each event in the final _common_clean file
| Quadrant A | 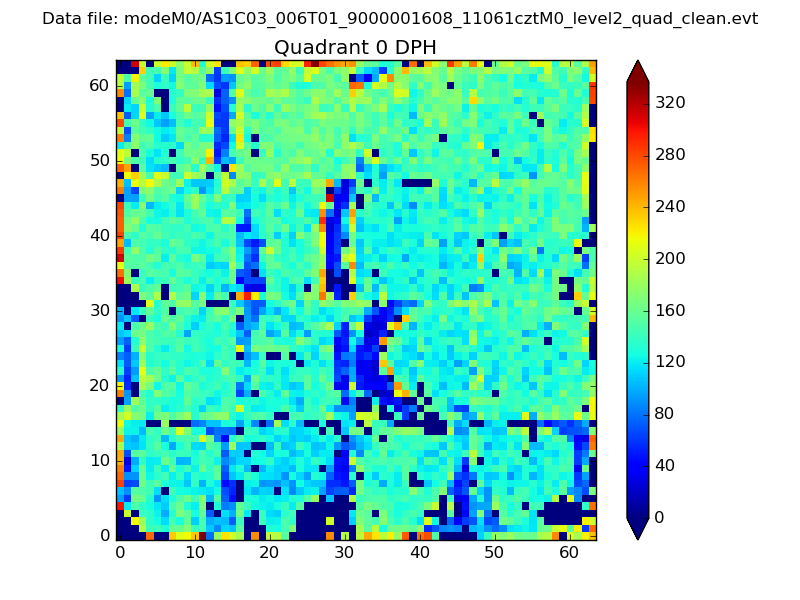 |
 |
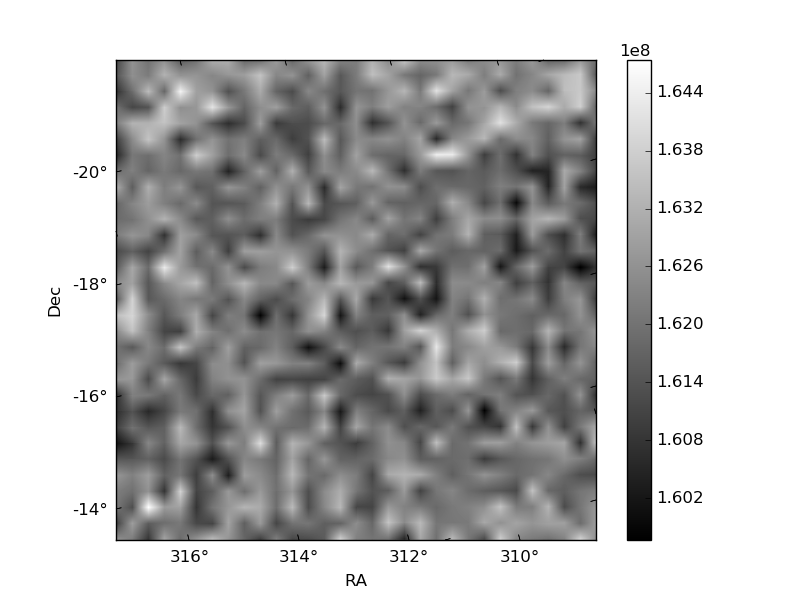
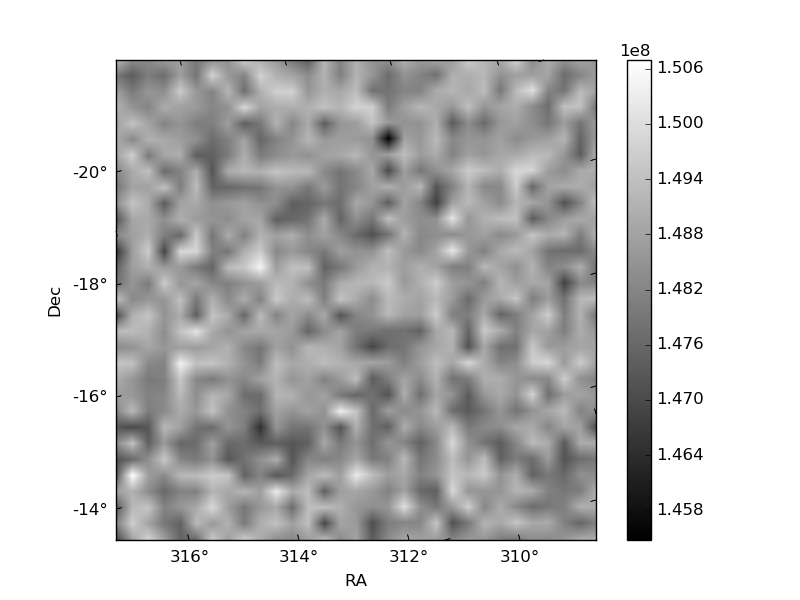
Quadrant B |
|---|---|---|---|
| Quadrant D | 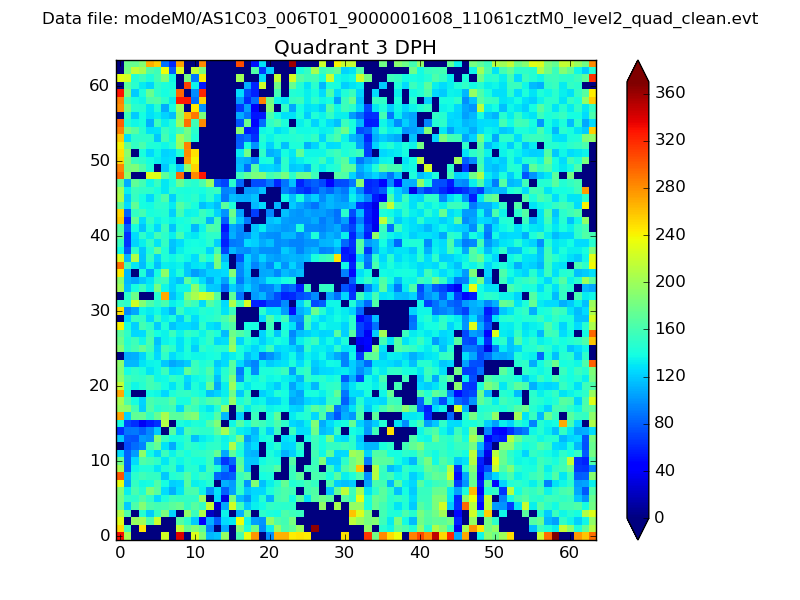 |
 |
Quadrant C |
| Plot type | Count rate plots | Images |
|---|---|---|
| Comparison with Poisson distribution Blue bars denote a histogram of data divided into 1 sec bins. Red curve is a Poisson curve with rate = median count rate of data. |
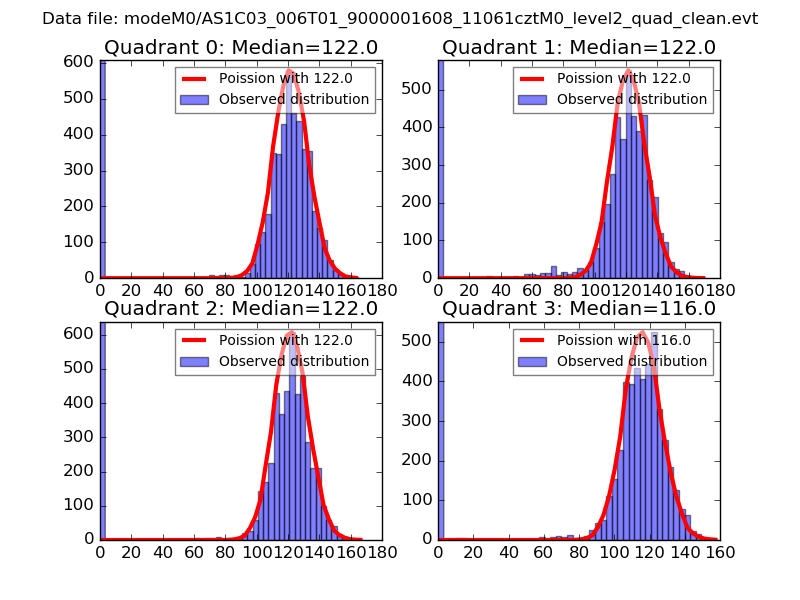 |
 |
| Quadrant-wise count rates Data is divided into 100 sec bins |
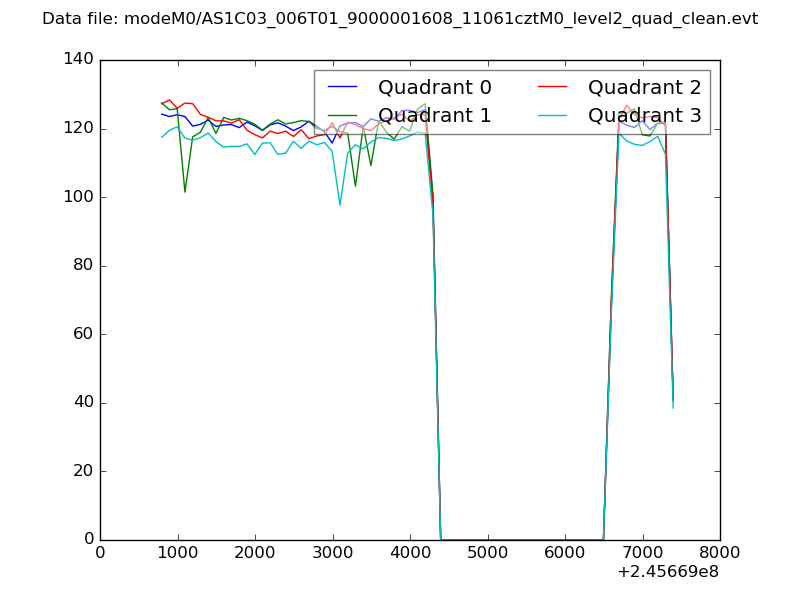 |
|
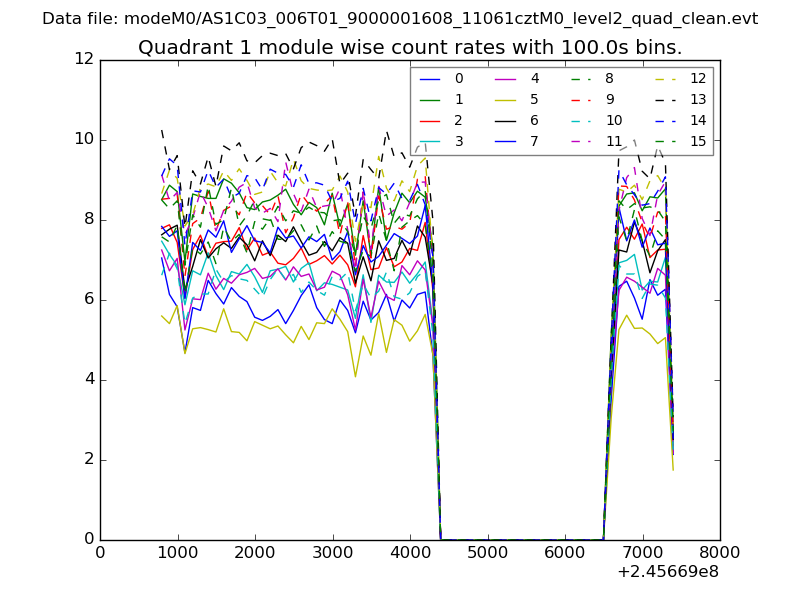
| Module-wise count rates for Quadrant A Data is divided into 100 sec bins |
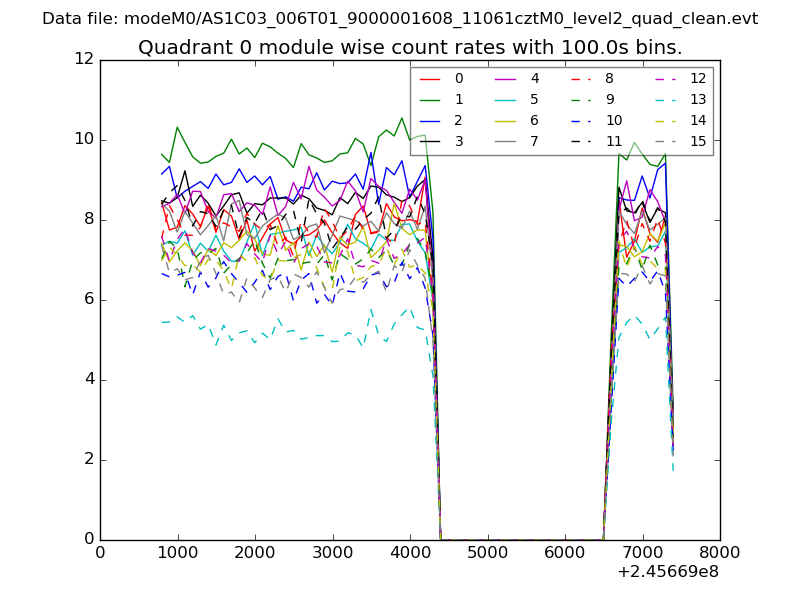 |
 |
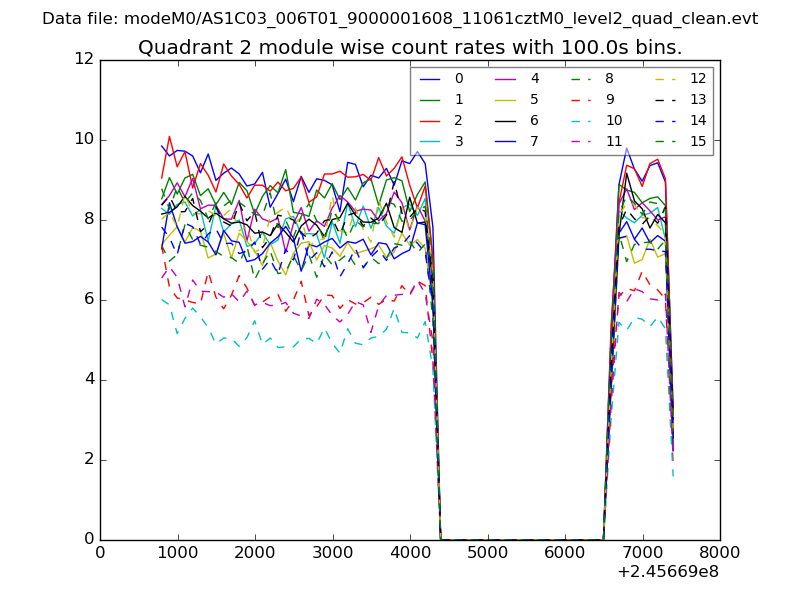
| Module-wise count rates for Quadrant B Data is divided into 100 sec bins |
 |
 |
| Module-wise count rates for Quadrant C Data is divided into 100 sec bins |
 |
 |
| Module-wise count rates for Quadrant D Data is divided into 100 sec bins |
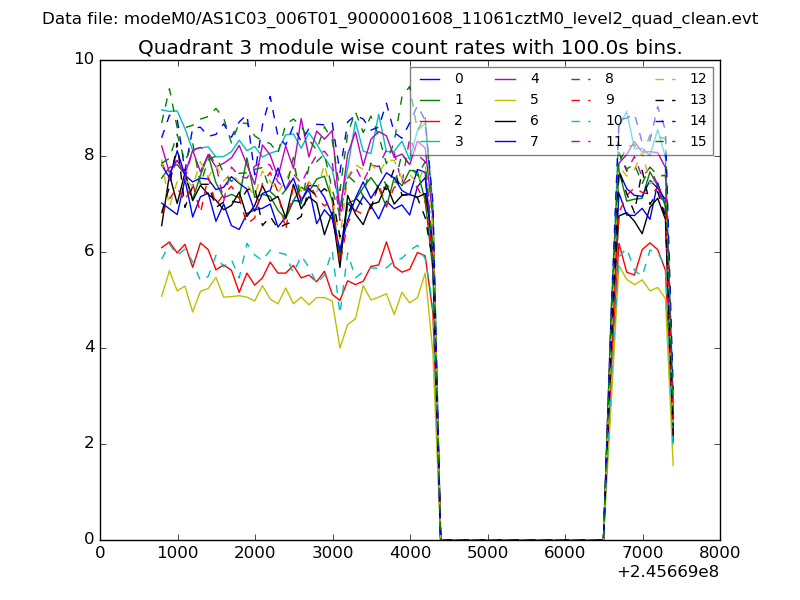 |
 |
| Parameter | Plot |
|---|---|
| CZT HV Monitor | 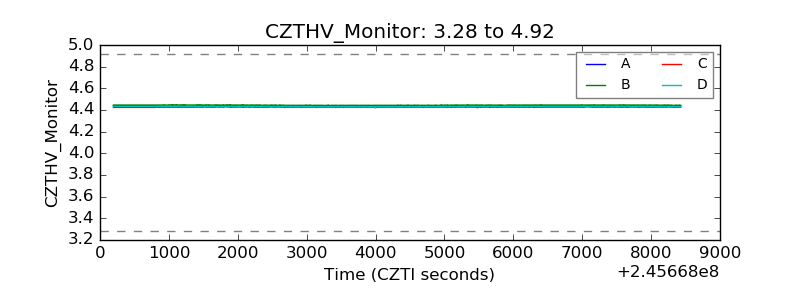 |
| D_VDD | 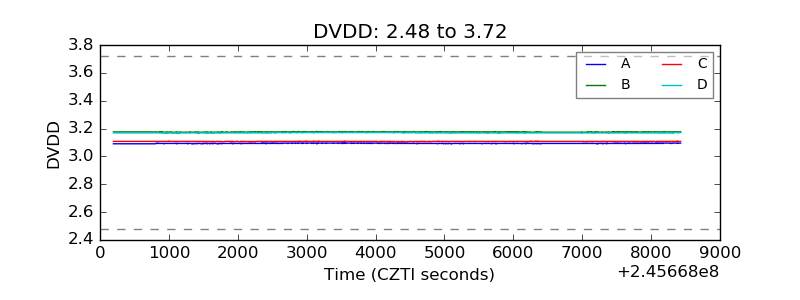 |
| Temperature 1 | 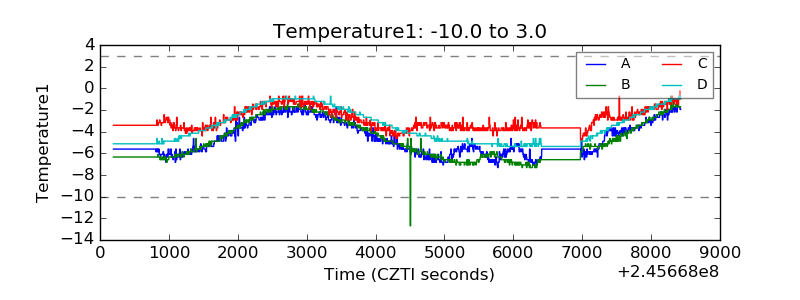 |
| Veto HV Monitor | 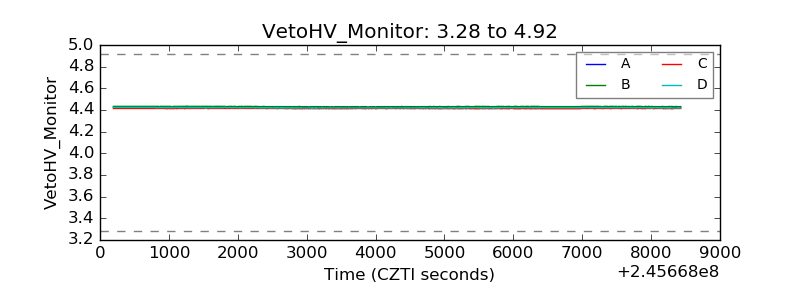 |
| Veto LLD | 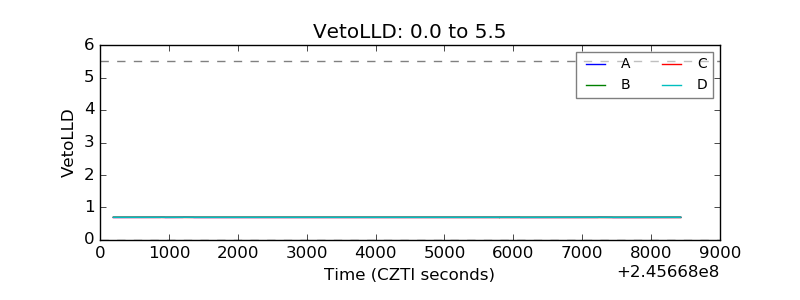 |
| Alpha Counter | 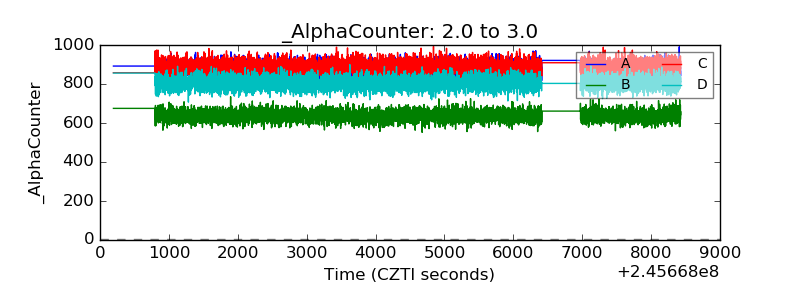 |
| _CPM_Rate | 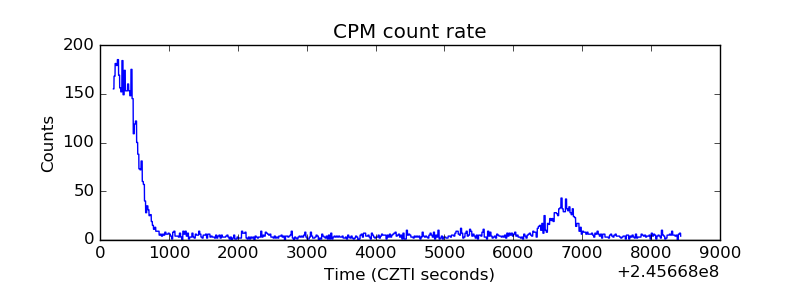 |
| CZT Counter | 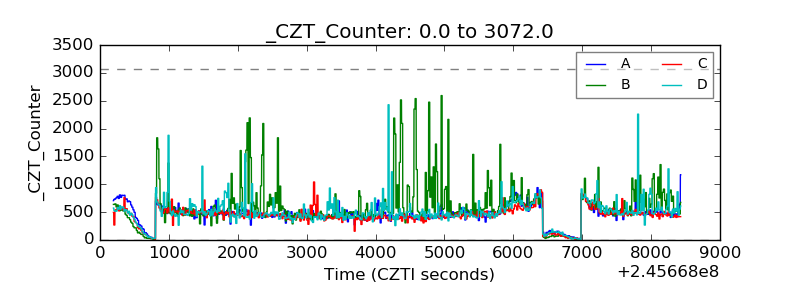 |
| +2.5 Volts monitor |  |
| +5 Volts monitor |  |
| _ROLL_ROT | 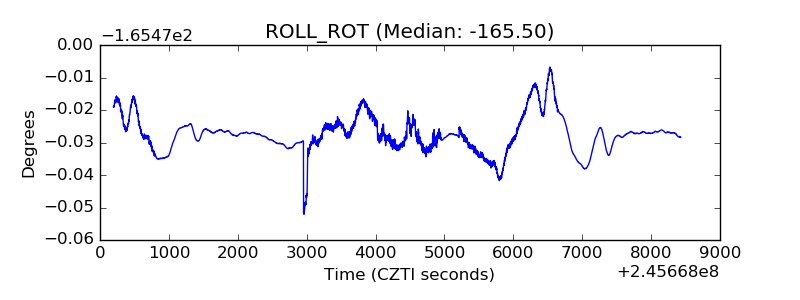 |
| _Roll_DEC | 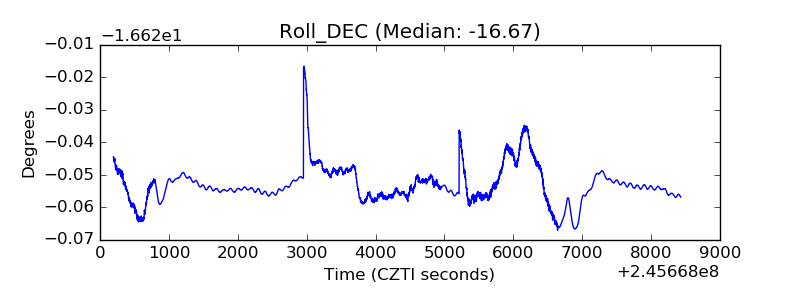 |
| _Roll_RA | 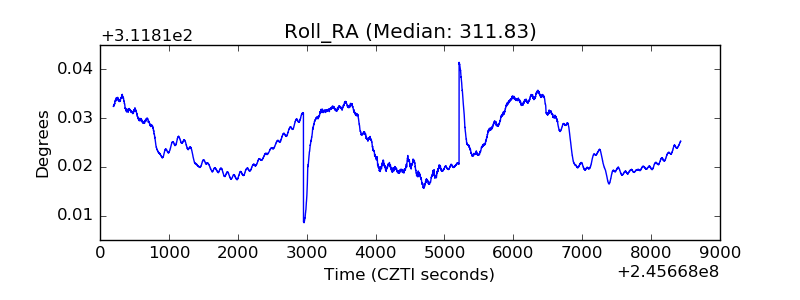 |
| Veto Counter | 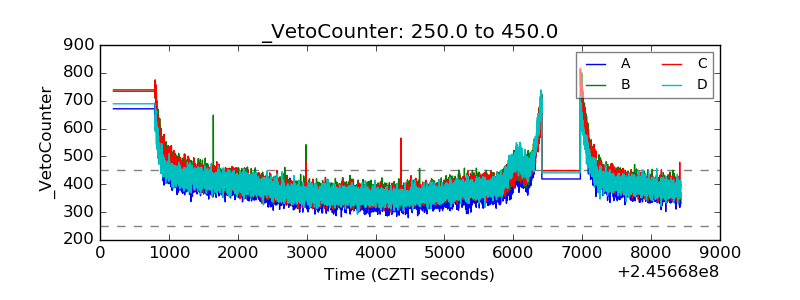 |