| Param | Original file | Final file |
|---|---|---|
| Filename | modeM0/AS1A04_053T01_9000001610cztM0_level2.fits | modeM0/AS1A04_053T01_9000001610cztM0_level2_quad_clean.evt |
| Size (bytes) | 75,991,680 | 63,155,520 |
| Size | 72.5 MB | 60.2 MB |
| Events in quadrant A | 453,498 | 349,105 |
| Events in quadrant B | 428,218 | 335,035 |
| Events in quadrant C | 447,802 | 334,106 |
| Events in quadrant D | 384,648 | 306,247 |
| Mode M9 | |||
|---|---|---|---|
| Quadrant | BADHDUFLAG | Total packets | Discarded packets |
| A | 0 | 1 | 0 |
| B | 0 | 1 | 0 |
| C | 0 | 1 | 0 |
| D | 0 | 1 | 0 |
| Mode M0 | |||
|---|---|---|---|
| Quadrant | BADHDUFLAG | Total packets | Discarded packets |
| A | 0 | 17443 | 0 |
| B | 0 | 22852 | 0 |
| C | 0 | 17396 | 0 |
| D | 0 | 20843 | 0 |
| Mode SS | |||
|---|---|---|---|
| Quadrant | BADHDUFLAG | Total packets | Discarded packets |
| A | 0 | 170 | 0 |
| B | 0 | 170 | 0 |
| C | 0 | 170 | 0 |
| D | 0 | 170 | 0 |
| Quadrant | Total seconds | Saturated seconds | Saturation percentage |
|---|---|---|---|
| A | 8457 | 111 | 1.312522% |
| B | 8457 | 514 | 6.077805% |
| C | 8457 | 42 | 0.496630% |
| D | 8457 | 155 | 1.832801% |
Noise dominated data is calculated using 1-second bins in cleaned event files. If a bin has >2000 counts, and if more than 50% of those come from <1% of pixels, then it is considered to be noise-dominated and hence unusable.
| Quadrant | # 1 sec bins | Bins with >0 counts | Bins with >2000 counts | High rate bins dominated by noise | Noise dominated (total time) | Noise dominated (detector-on time) | Marked lightcurve |
|---|---|---|---|---|---|---|---|
| A | 8472 | 8457 | 0 | 0 | 0.00% | 0.00% |  |
| B | 8472 | 8457 | 0 | 0 | 0.00% | 0.00% |  |
| C | 8472 | 8457 | 0 | 0 | 0.00% | 0.00% |  |
| D | 8472 | 8455 | 0 | 0 | 0.00% | 0.00% |  |
Top three noisy pixels from each quadrant. If the there are fewer than three noisy pixels in the level2.evt file, extra rows are filled as -1
| Pixel properties | Quadrant properties | ||||||
|---|---|---|---|---|---|---|---|
| Quadrant | DetID | PixID | Counts | Sigma | Mean | Median | Sigma |
| A | 0 | 29 | 434 | 10.18 | 117 | 110 | 31.8 |
| A | 14 | 188 | 408 | 9.36 | 117 | 110 | 31.8 |
| A | 7 | 110 | 373 | 8.26 | 117 | 110 | 31.8 |
| B | 2 | 9 | 377 | 10.48 | 113 | 107 | 25.8 |
| B | 5 | 225 | 308 | 7.8 | 113 | 107 | 25.8 |
| B | 14 | 254 | 307 | 7.76 | 113 | 107 | 25.8 |
| C | 12 | 241 | 342 | 7.1 | 118 | 109 | 32.8 |
| C | 1 | 80 | 333 | 6.83 | 118 | 109 | 32.8 |
| C | 1 | 81 | 330 | 6.74 | 118 | 109 | 32.8 |
| D | 1 | 3 | 283 | 5.73 | 109 | 99 | 32.1 |
| D | 10 | 189 | 282 | 5.7 | 109 | 99 | 32.1 |
| D | 6 | 38 | 280 | 5.64 | 109 | 99 | 32.1 |
Histogram calculated using DETX and DETY for each event in the final _common_clean file
| Quadrant A | 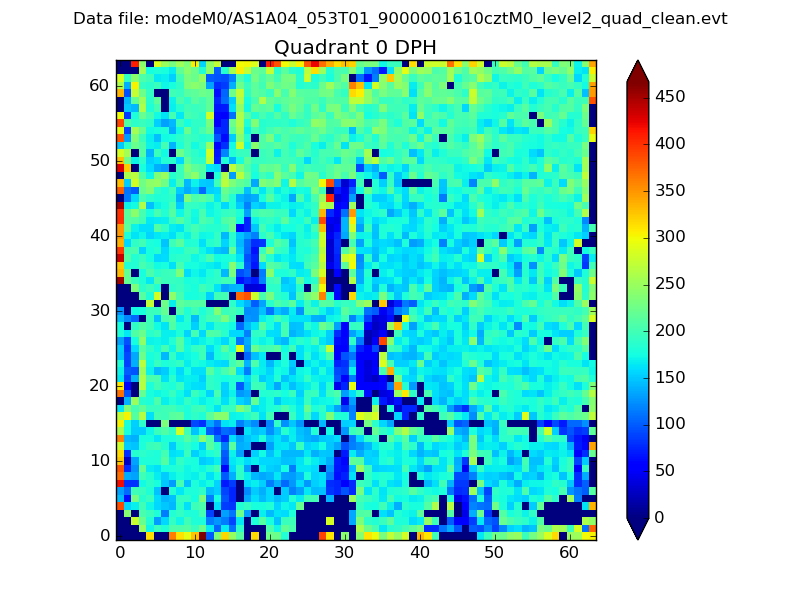 |
 |
Quadrant B |
|---|---|---|---|
| Quadrant D |  |
 |
Quadrant C |
| Plot type | Count rate plots | Images |
|---|---|---|
| Comparison with Poisson distribution Blue bars denote a histogram of data divided into 1 sec bins. Red curve is a Poisson curve with rate = median count rate of data. |
 |
 |
| Quadrant-wise count rates Data is divided into 100 sec bins |
 |
|
| Module-wise count rates for Quadrant A Data is divided into 100 sec bins |
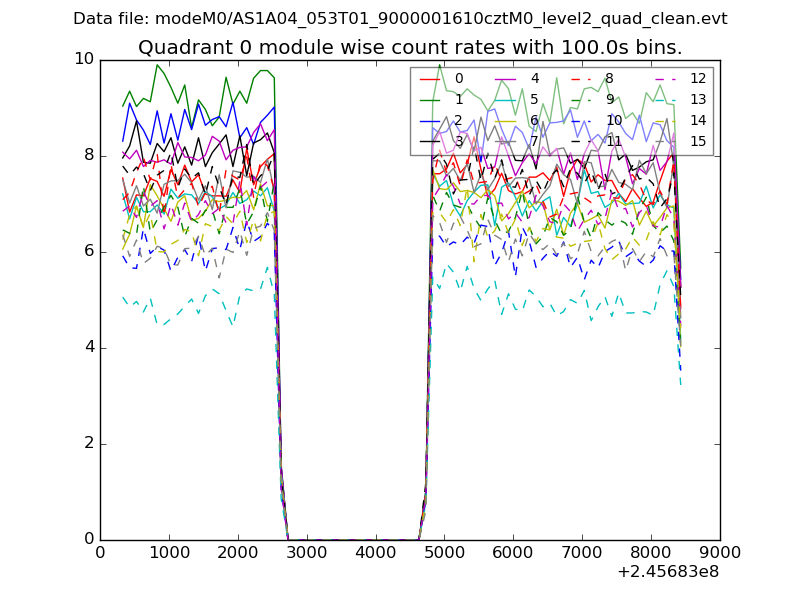 |
 |
| Module-wise count rates for Quadrant B Data is divided into 100 sec bins |
 |
 |
| Module-wise count rates for Quadrant C Data is divided into 100 sec bins |
 |
 |
| Module-wise count rates for Quadrant D Data is divided into 100 sec bins |
 |
 |
| Parameter | Plot |
|---|---|
| CZT HV Monitor |  |
| D_VDD |  |
| Temperature 1 |  |
| Veto HV Monitor |  |
| Veto LLD | 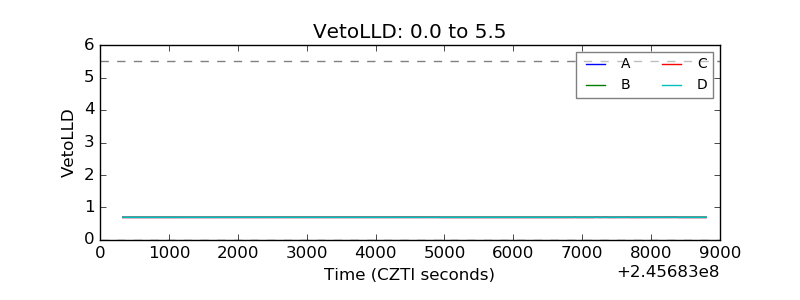 |
| Alpha Counter |  |
| _CPM_Rate |  |
| CZT Counter |  |
| +2.5 Volts monitor |  |
| +5 Volts monitor |  |
| _ROLL_ROT |  |
| _Roll_DEC |  |
| _Roll_RA | 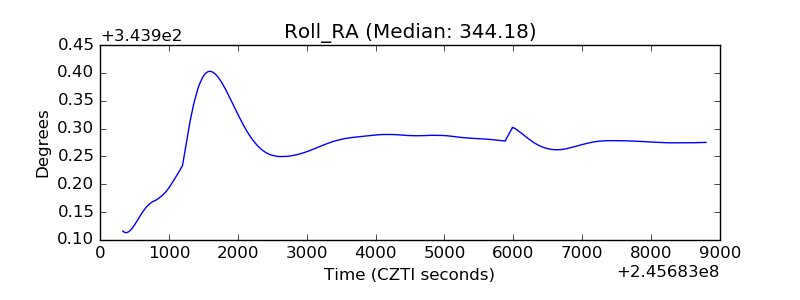 |
| Veto Counter |  |