| Param | Original file | Final file |
|---|---|---|
| Filename | modeM0/AS1A04_053T01_9000001610_11064cztM0_level2.evt | modeM0/AS1A04_053T01_9000001610_11064cztM0_level2_quad_clean.evt |
| Size (bytes) | 255,216,960 | 57,916,800 |
| Size | 243.4 MB | 55.2 MB |
| Events in quadrant A | 1,499,413 | 381,645 |
| Events in quadrant B | 2,368,579 | 375,983 |
| Events in quadrant C | 1,465,325 | 377,342 |
| Events in quadrant D | 2,146,738 | 360,891 |
| Mode M0 | |||
|---|---|---|---|
| Quadrant | BADHDUFLAG | Total packets | Discarded packets |
| A | 0 | 7287 | 0 |
| B | 0 | 9569 | 0 |
| C | 0 | 7294 | 0 |
| D | 0 | 8903 | 0 |
| Mode SS | |||
|---|---|---|---|
| Quadrant | BADHDUFLAG | Total packets | Discarded packets |
| A | 0 | 74 | 0 |
| B | 0 | 74 | 0 |
| C | 0 | 74 | 0 |
| D | 0 | 74 | 0 |
| Quadrant | Total seconds | Saturated seconds | Saturation percentage |
|---|---|---|---|
| A | 3637 | 3 | 0.082486% |
| B | 3637 | 141 | 3.876822% |
| C | 3637 | 3 | 0.082486% |
| D | 3637 | 55 | 1.512235% |
Noise dominated data is calculated using 1-second bins in cleaned event files. If a bin has >2000 counts, and if more than 50% of those come from <1% of pixels, then it is considered to be noise-dominated and hence unusable.
| Quadrant | # 1 sec bins | Bins with >0 counts | Bins with >2000 counts | High rate bins dominated by noise | Noise dominated (total time) | Noise dominated (detector-on time) | Marked lightcurve |
|---|---|---|---|---|---|---|---|
| A | 3637 | 3637 | 0 | 0 | 0.00% | 0.00% | 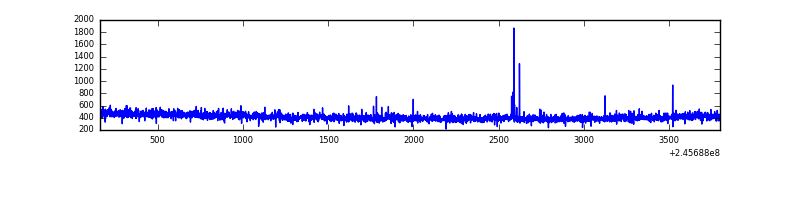 |
| B | 3637 | 3637 | 108 | 108 | 2.97% | 2.97% | 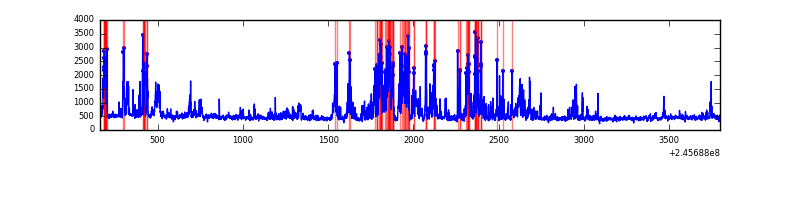 |
| C | 3637 | 3637 | 1 | 1 | 0.03% | 0.03% | 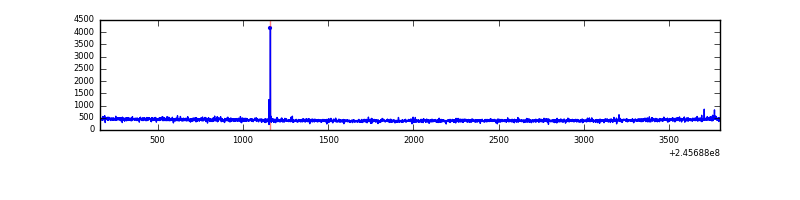 |
| D | 3637 | 3637 | 55 | 55 | 1.51% | 1.51% | 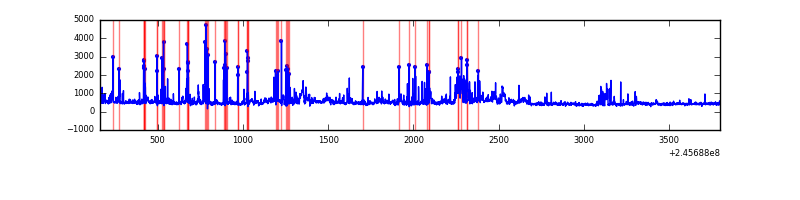 |
Top three noisy pixels from each quadrant. If the there are fewer than three noisy pixels in the level2.evt file, extra rows are filled as -1
| Pixel properties | Quadrant properties | ||||||
|---|---|---|---|---|---|---|---|
| Quadrant | DetID | PixID | Counts | Sigma | Mean | Median | Sigma |
| A | 14 | 254 | 7822 | 92.46 | 387 | 379 | 80.5 |
| A | 0 | 226 | 3479 | 38.51 | 387 | 379 | 80.5 |
| A | 12 | 194 | 3081 | 33.57 | 387 | 379 | 80.5 |
| B | 4 | 239 | 672967 | 9056.43 | 383 | 375 | 74.3 |
| B | 0 | 197 | 72932 | 976.98 | 383 | 375 | 74.3 |
| B | 15 | 204 | 42440 | 566.4 | 383 | 375 | 74.3 |
| C | 14 | 234 | 7630 | 83.12 | 370 | 373 | 87.3 |
| C | 8 | 128 | 5947 | 63.85 | 370 | 373 | 87.3 |
| C | 8 | 112 | 3643 | 37.45 | 370 | 373 | 87.3 |
| D | 1 | 52 | 215724 | 2401.54 | 367 | 356 | 89.7 |
| D | 14 | 34 | 141986 | 1579.3 | 367 | 356 | 89.7 |
| D | 8 | 195 | 135474 | 1506.68 | 367 | 356 | 89.7 |
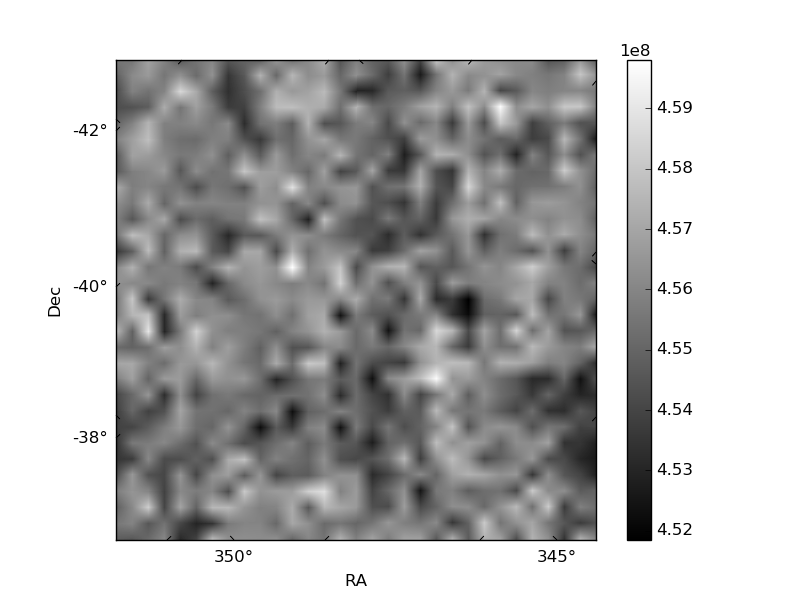
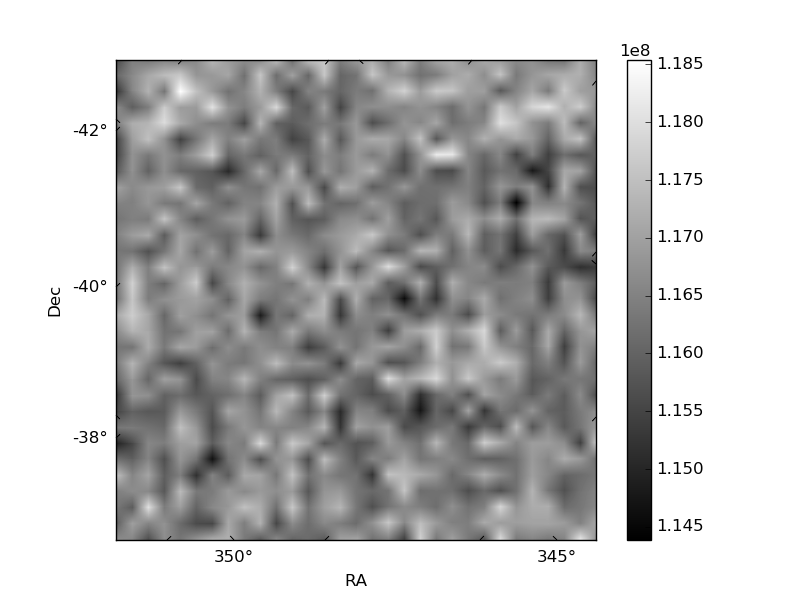
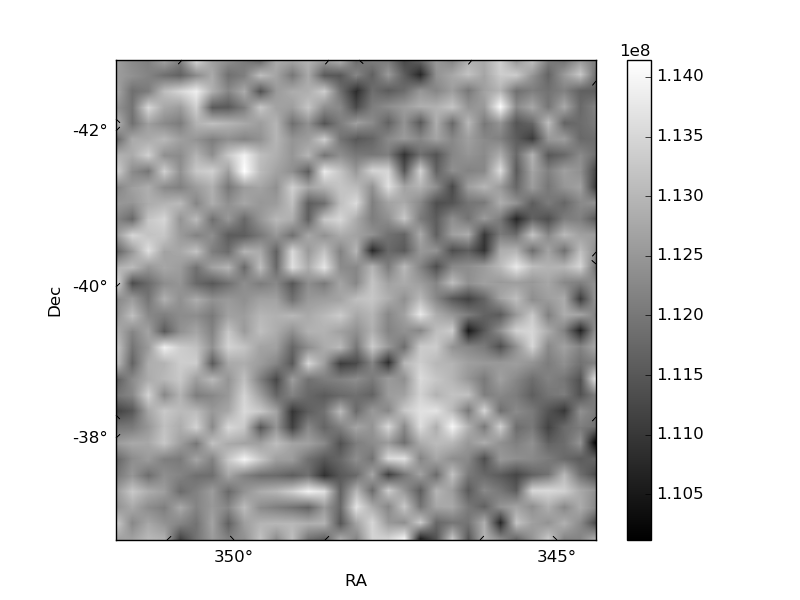
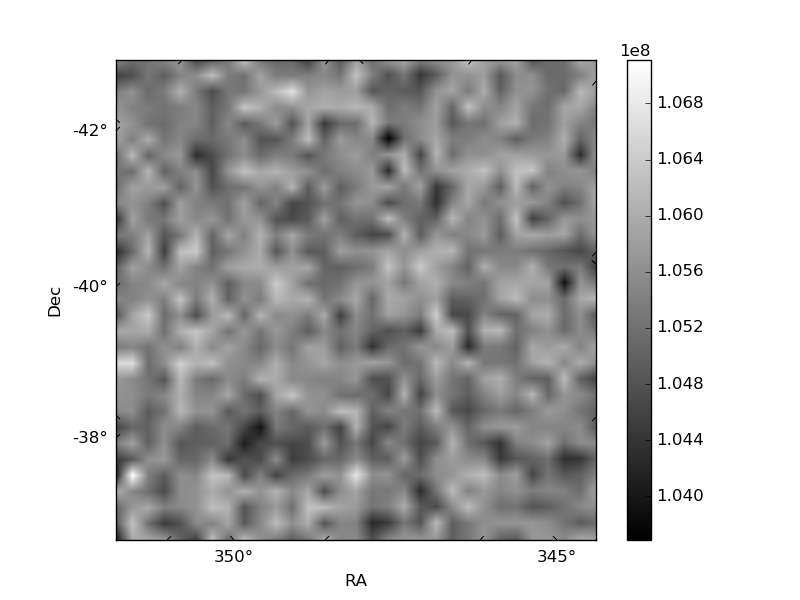
Histogram calculated using DETX and DETY for each event in the final _common_clean file
| Quadrant A | 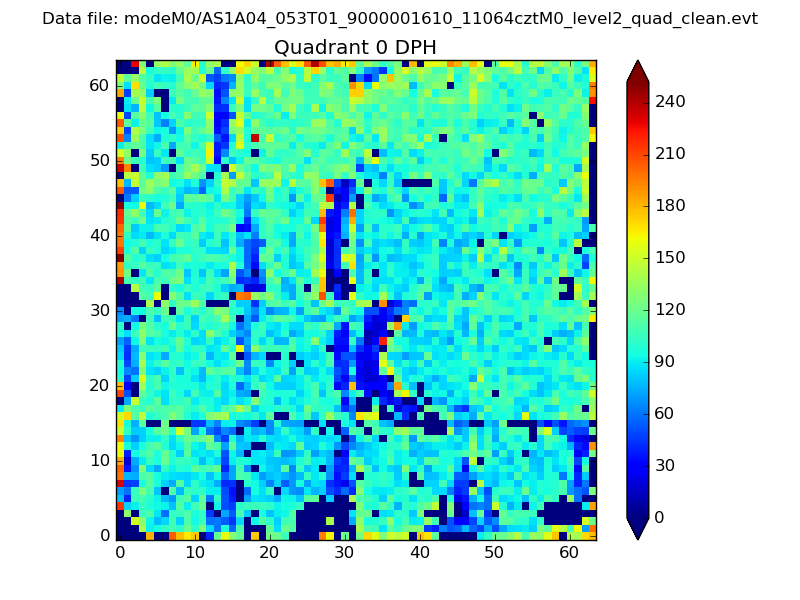 |
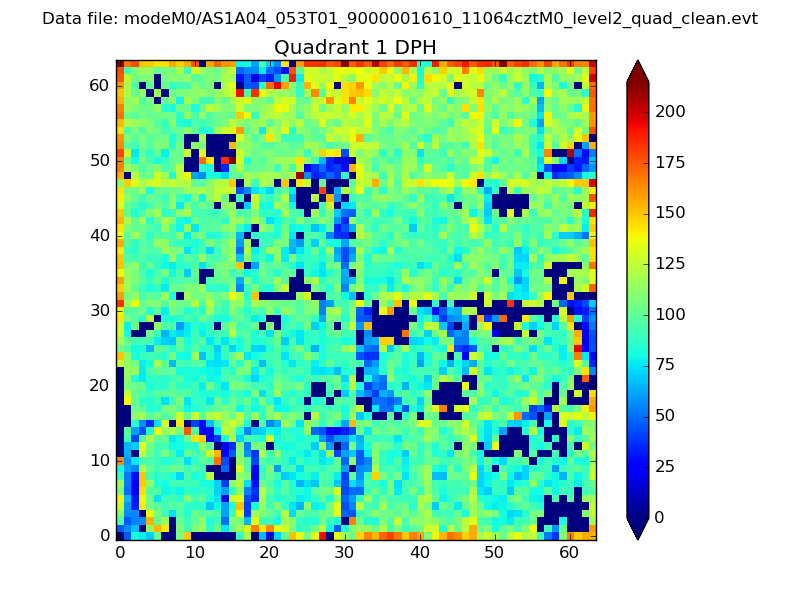 |
Quadrant B |
|---|---|---|---|
| Quadrant D | 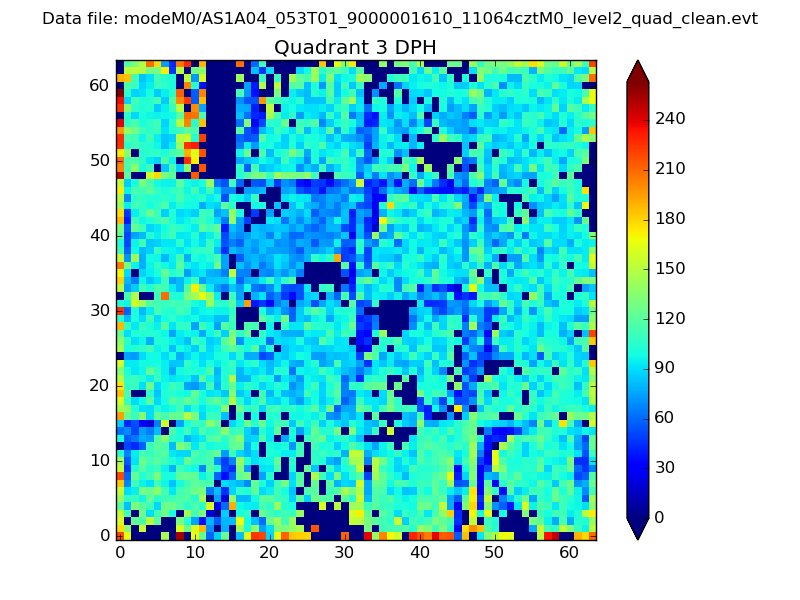 |
 |
Quadrant C |
| Plot type | Count rate plots | Images |
|---|---|---|
| Comparison with Poisson distribution Blue bars denote a histogram of data divided into 1 sec bins. Red curve is a Poisson curve with rate = median count rate of data. |
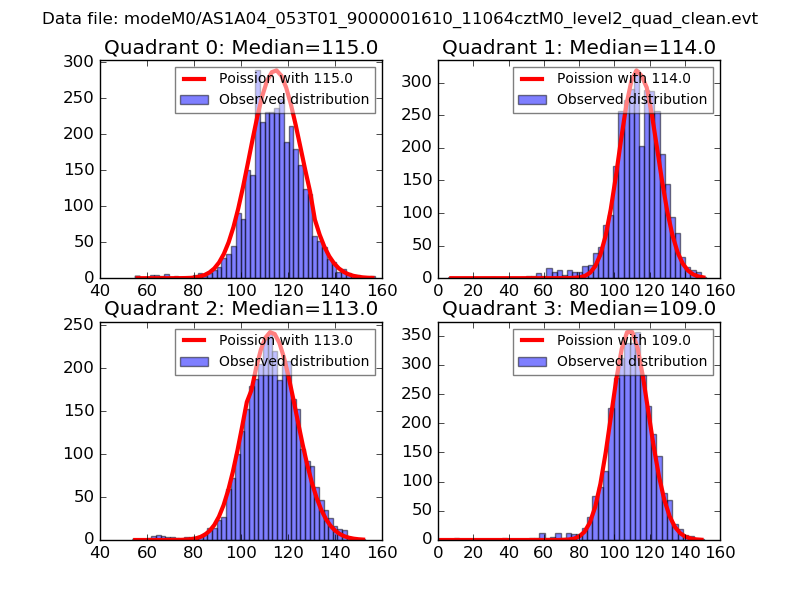 |
 |
| Quadrant-wise count rates Data is divided into 100 sec bins |
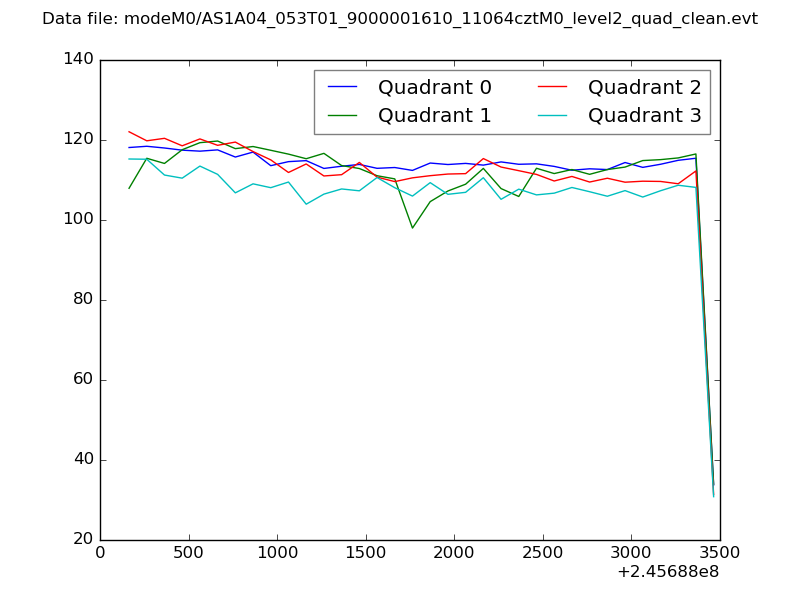 |
|
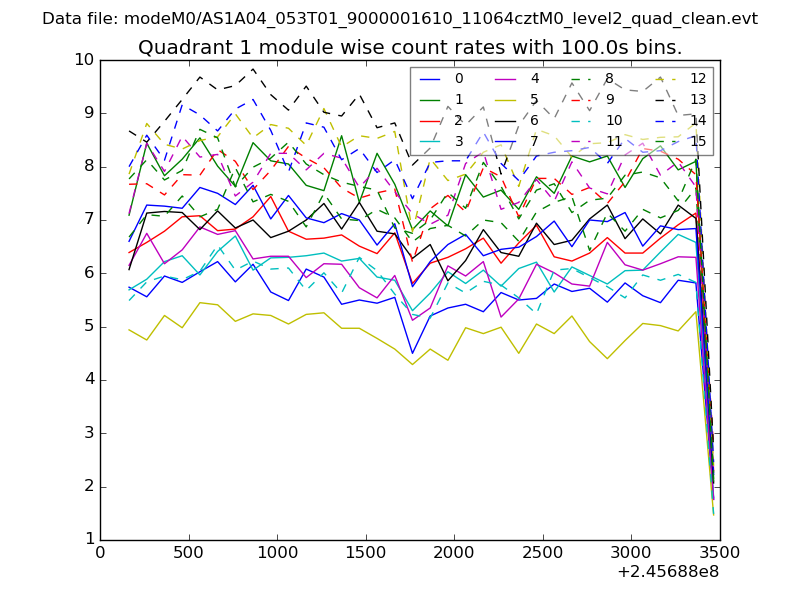
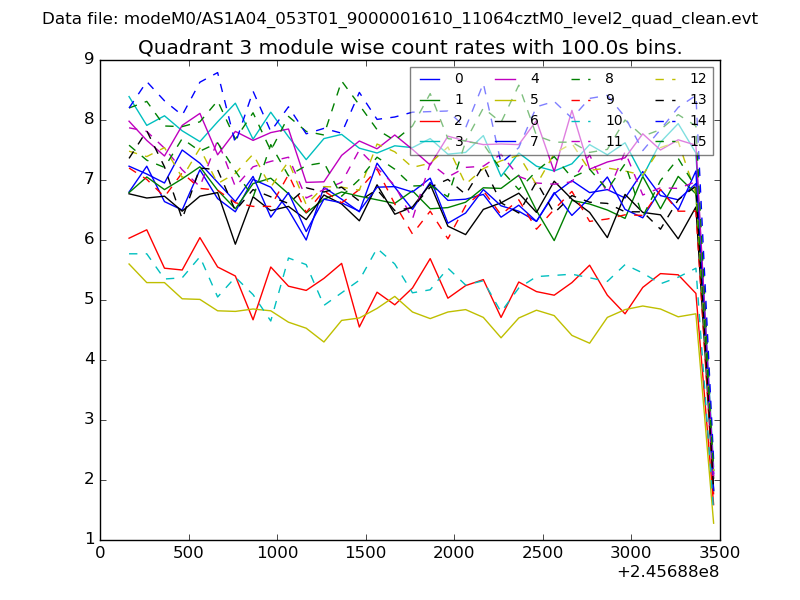
| Module-wise count rates for Quadrant A Data is divided into 100 sec bins |
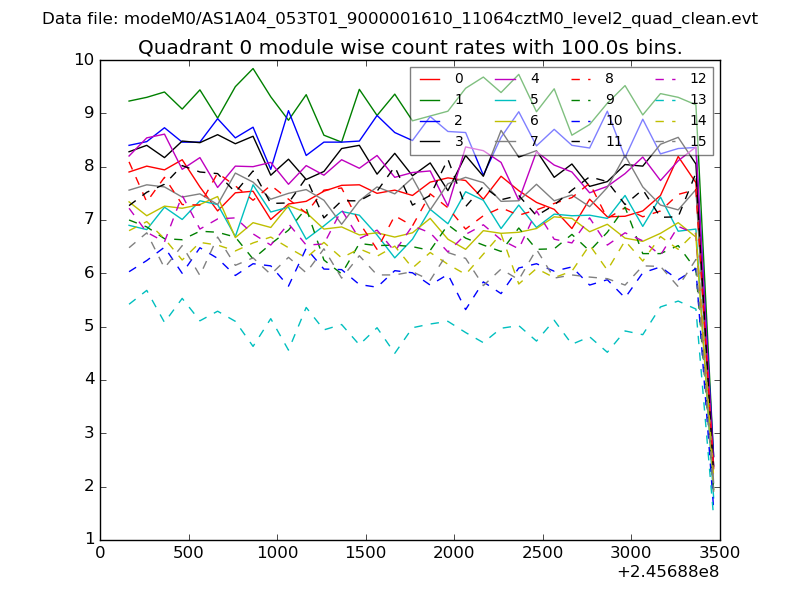 |
 |
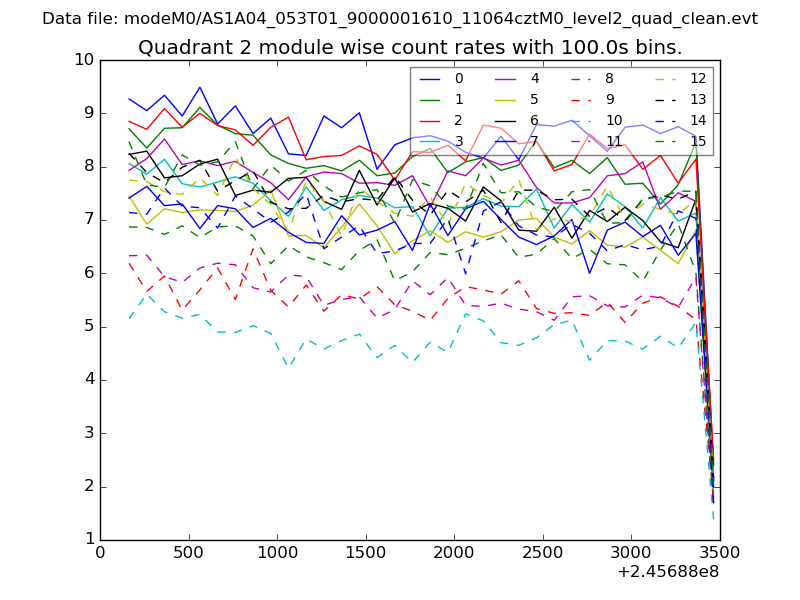
| Module-wise count rates for Quadrant B Data is divided into 100 sec bins |
 |
 |
| Module-wise count rates for Quadrant C Data is divided into 100 sec bins |
 |
 |
| Module-wise count rates for Quadrant D Data is divided into 100 sec bins |
 |
 |
| Parameter | Plot |
|---|---|
| CZT HV Monitor | 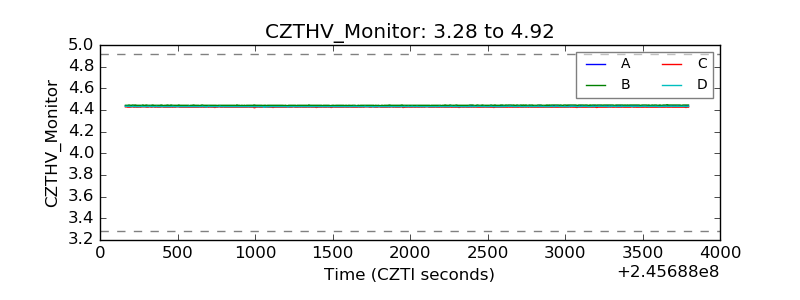 |
| D_VDD | 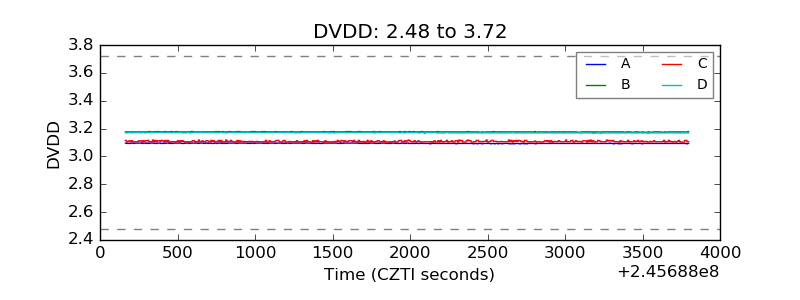 |
| Temperature 1 | 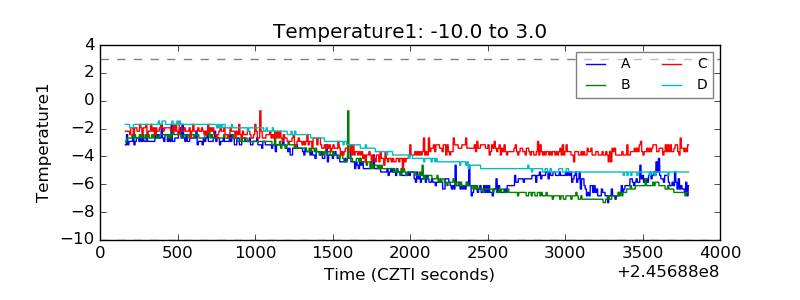 |
| Veto HV Monitor | 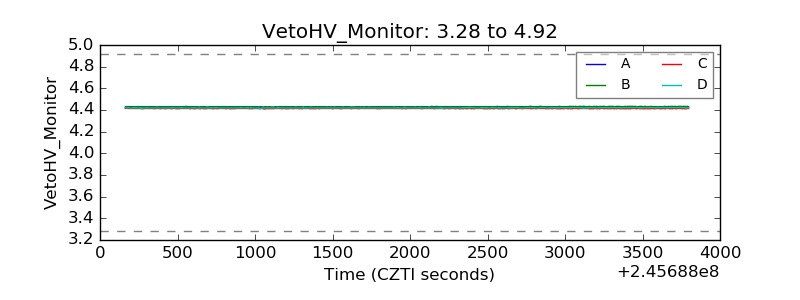 |
| Veto LLD | 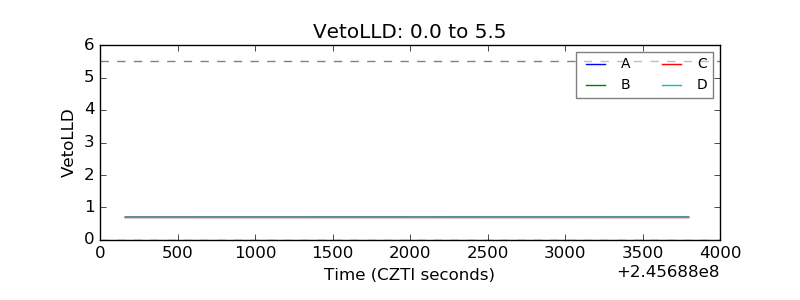 |
| Alpha Counter | 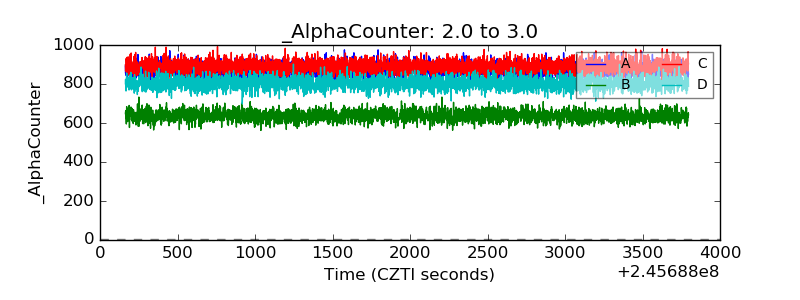 |
| _CPM_Rate | 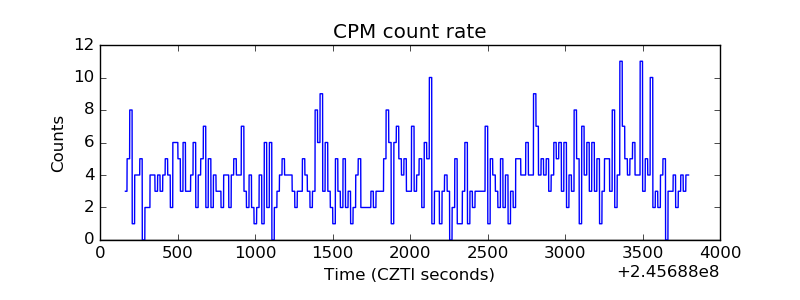 |
| CZT Counter | 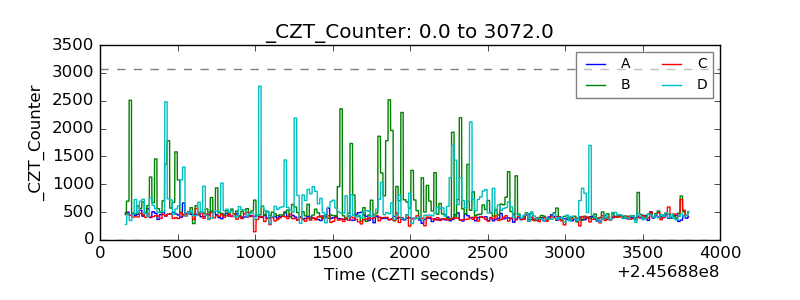 |
| +2.5 Volts monitor |  |
| +5 Volts monitor |  |
| _ROLL_ROT | 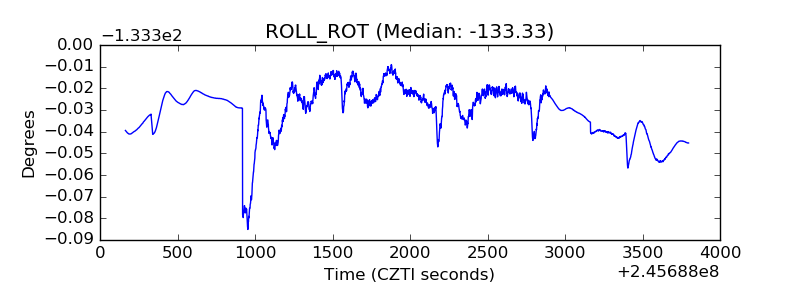 |
| _Roll_DEC |  |
| _Roll_RA | 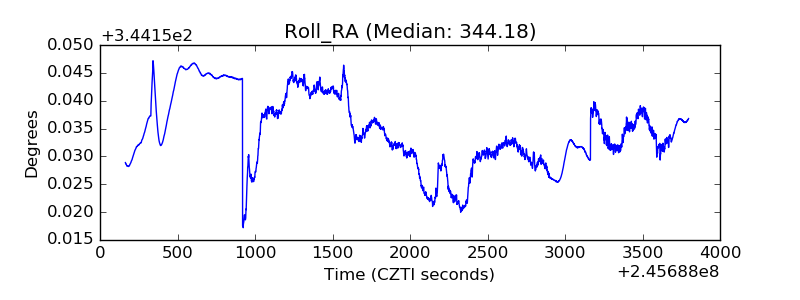 |
| Veto Counter | 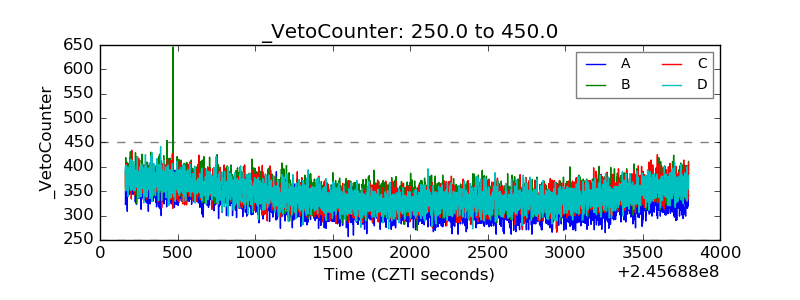 |