| Param | Original file | Final file |
|---|---|---|
| Filename | modeM0/AS1A04_053T03_9000001612cztM0_level2.fits | modeM0/AS1A04_053T03_9000001612cztM0_level2_quad_clean.evt |
| Size (bytes) | 75,720,960 | 64,039,680 |
| Size | 72.2 MB | 61.1 MB |
| Events in quadrant A | 452,956 | 361,081 |
| Events in quadrant B | 434,020 | 344,022 |
| Events in quadrant C | 446,806 | 344,268 |
| Events in quadrant D | 388,984 | 318,676 |
| Mode SS | |||
|---|---|---|---|
| Quadrant | BADHDUFLAG | Total packets | Discarded packets |
| A | 0 | 168 | 0 |
| B | 0 | 168 | 0 |
| C | 0 | 168 | 0 |
| D | 0 | 168 | 0 |
| Mode M9 | |||
|---|---|---|---|
| Quadrant | BADHDUFLAG | Total packets | Discarded packets |
| A | 0 | 10 | 0 |
| B | 0 | 10 | 0 |
| C | 0 | 10 | 0 |
| D | 0 | 10 | 0 |
| Mode M0 | |||
|---|---|---|---|
| Quadrant | BADHDUFLAG | Total packets | Discarded packets |
| A | 0 | 17388 | 0 |
| B | 0 | 19515 | 0 |
| C | 0 | 16799 | 0 |
| D | 0 | 19220 | 0 |
| Quadrant | Total seconds | Saturated seconds | Saturation percentage |
|---|---|---|---|
| A | 8211 | 68 | 0.828157% |
| B | 8211 | 313 | 3.811960% |
| C | 8211 | 25 | 0.304470% |
| D | 8211 | 168 | 2.046036% |
Noise dominated data is calculated using 1-second bins in cleaned event files. If a bin has >2000 counts, and if more than 50% of those come from <1% of pixels, then it is considered to be noise-dominated and hence unusable.
| Quadrant | # 1 sec bins | Bins with >0 counts | Bins with >2000 counts | High rate bins dominated by noise | Noise dominated (total time) | Noise dominated (detector-on time) | Marked lightcurve |
|---|---|---|---|---|---|---|---|
| A | 9156 | 8211 | 0 | 0 | 0.00% | 0.00% |  |
| B | 9156 | 8211 | 0 | 0 | 0.00% | 0.00% |  |
| C | 9156 | 8211 | 0 | 0 | 0.00% | 0.00% |  |
| D | 9156 | 8211 | 0 | 0 | 0.00% | 0.00% | 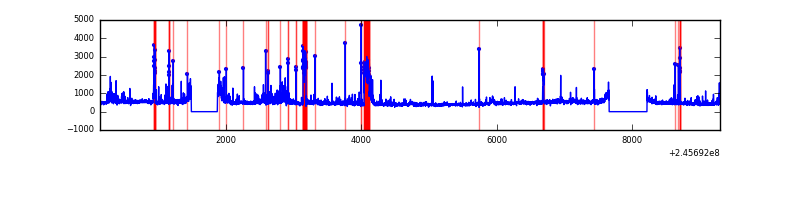 |
Top three noisy pixels from each quadrant. If the there are fewer than three noisy pixels in the level2.evt file, extra rows are filled as -1
| Pixel properties | Quadrant properties | ||||||
|---|---|---|---|---|---|---|---|
| Quadrant | DetID | PixID | Counts | Sigma | Mean | Median | Sigma |
| A | 14 | 188 | 451 | 10.95 | 117 | 109 | 31.2 |
| A | 0 | 29 | 425 | 10.11 | 117 | 109 | 31.2 |
| A | 14 | 204 | 393 | 9.09 | 117 | 109 | 31.2 |
| B | 2 | 9 | 374 | 10.54 | 114 | 108 | 25.2 |
| B | 2 | 8 | 293 | 7.33 | 114 | 108 | 25.2 |
| B | 3 | 17 | 285 | 7.02 | 114 | 108 | 25.2 |
| C | 3 | 158 | 310 | 6.16 | 118 | 110 | 32.5 |
| C | 9 | 242 | 304 | 5.97 | 118 | 110 | 32.5 |
| C | 2 | 191 | 299 | 5.82 | 118 | 110 | 32.5 |
| D | 3 | 31 | 327 | 7.21 | 110 | 101 | 31.4 |
| D | 3 | 14 | 323 | 7.08 | 110 | 101 | 31.4 |
| D | 3 | 30 | 293 | 6.12 | 110 | 101 | 31.4 |
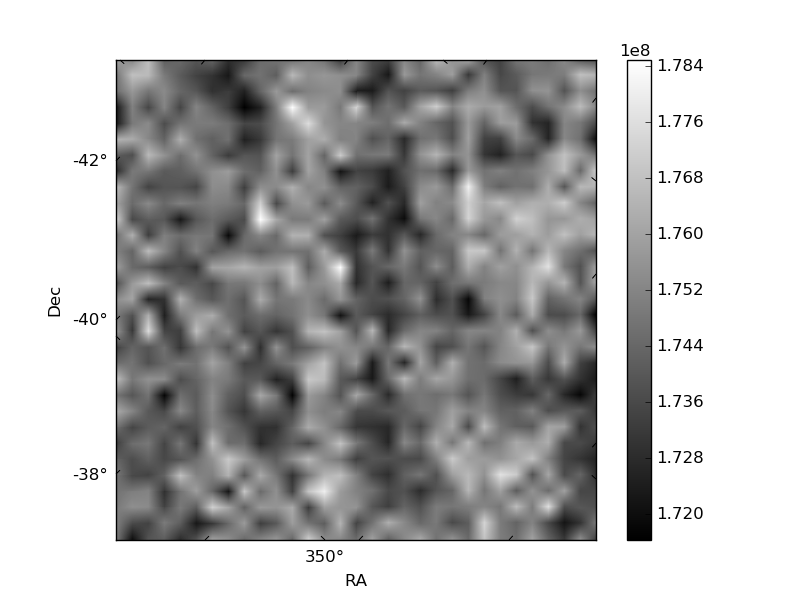
Histogram calculated using DETX and DETY for each event in the final _common_clean file
| Quadrant A | 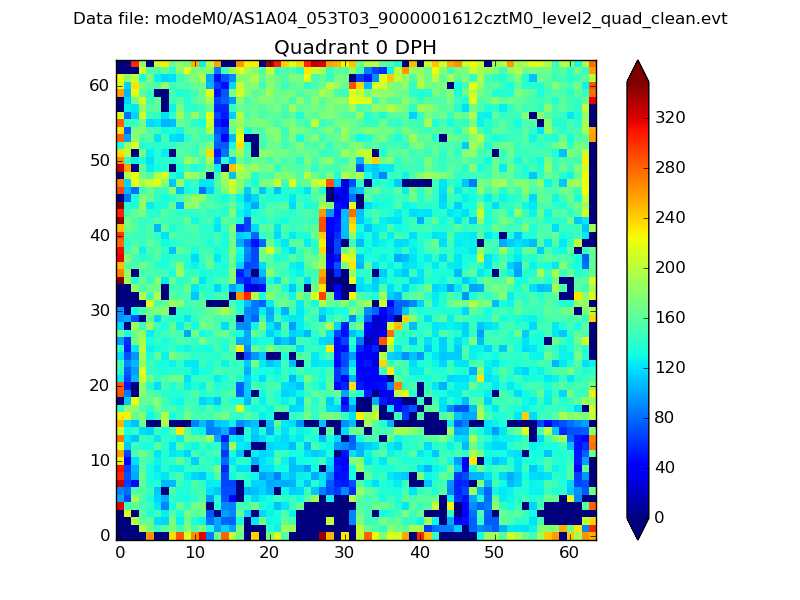 |
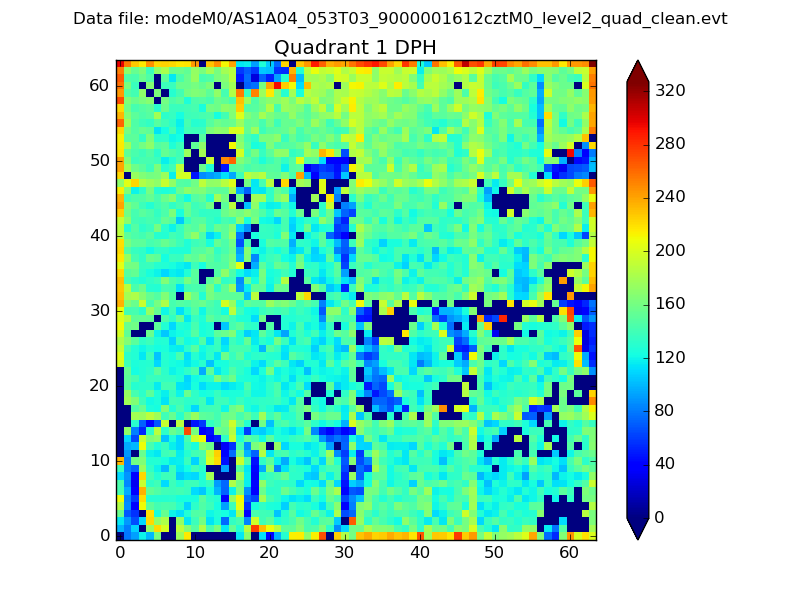 |
Quadrant B |
|---|---|---|---|
| Quadrant D | 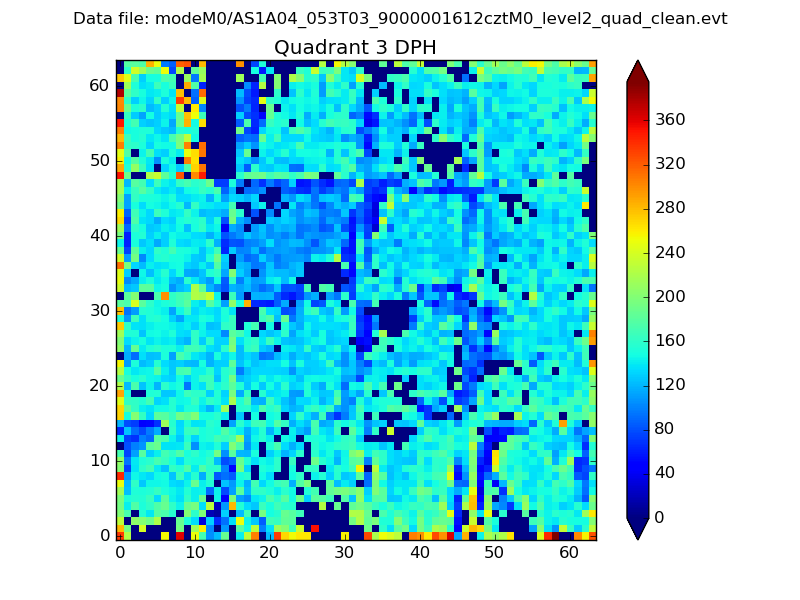 |
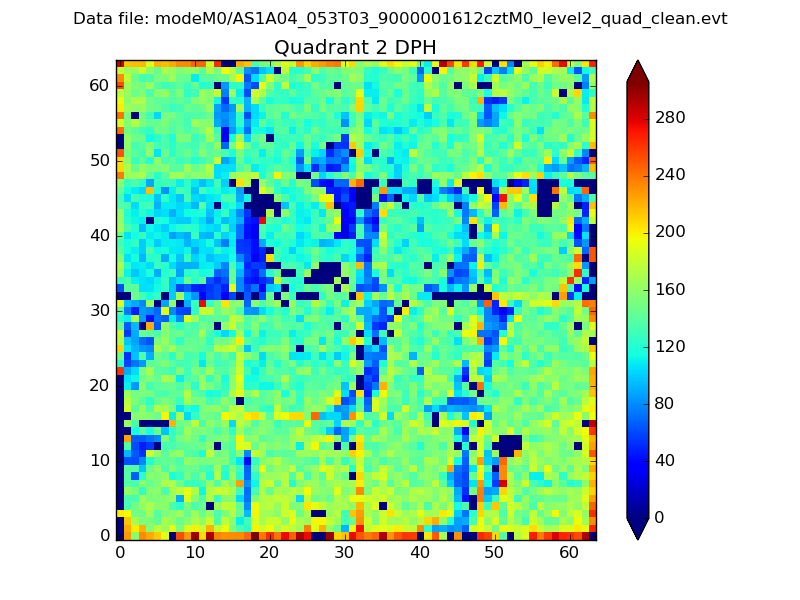 |
Quadrant C |
| Plot type | Count rate plots | Images |
|---|---|---|
| Comparison with Poisson distribution Blue bars denote a histogram of data divided into 1 sec bins. Red curve is a Poisson curve with rate = median count rate of data. |
 |
 |
| Quadrant-wise count rates Data is divided into 100 sec bins |
 |
|
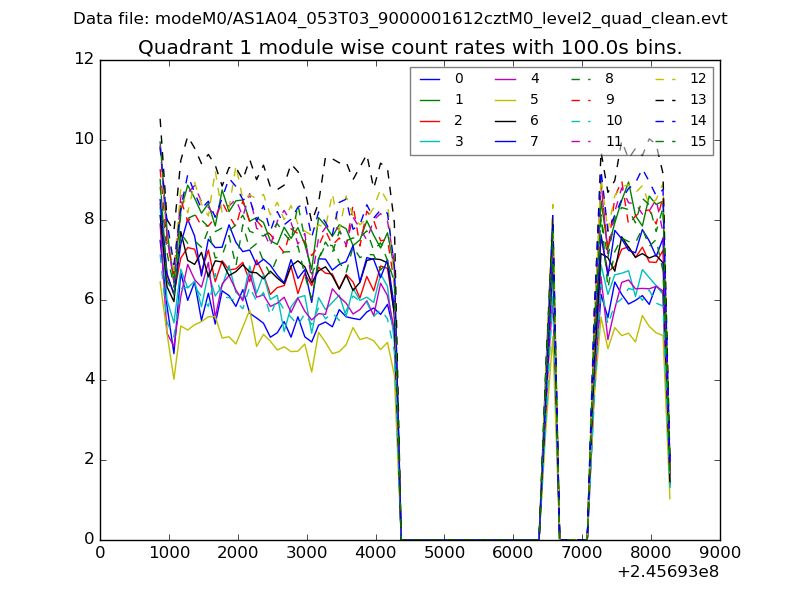
| Module-wise count rates for Quadrant A Data is divided into 100 sec bins |
 |
 |
| Module-wise count rates for Quadrant B Data is divided into 100 sec bins |
 |
 |
| Module-wise count rates for Quadrant C Data is divided into 100 sec bins |
 |
 |
| Module-wise count rates for Quadrant D Data is divided into 100 sec bins |
 |
 |
| Parameter | Plot |
|---|---|
| CZT HV Monitor |  |
| D_VDD |  |
| Temperature 1 |  |
| Veto HV Monitor |  |
| Veto LLD |  |
| Alpha Counter | 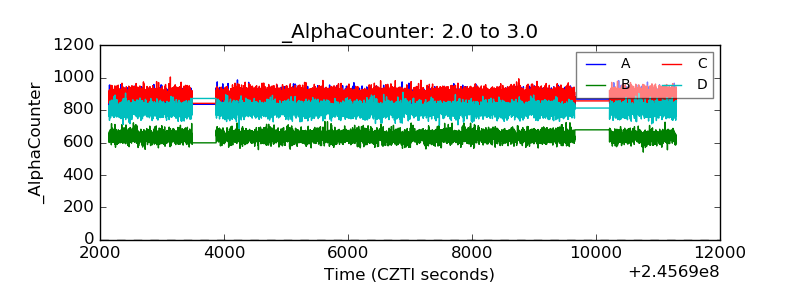 |
| _CPM_Rate |  |
| CZT Counter |  |
| +2.5 Volts monitor |  |
| +5 Volts monitor |  |
| _ROLL_ROT |  |
| _Roll_DEC |  |
| _Roll_RA | 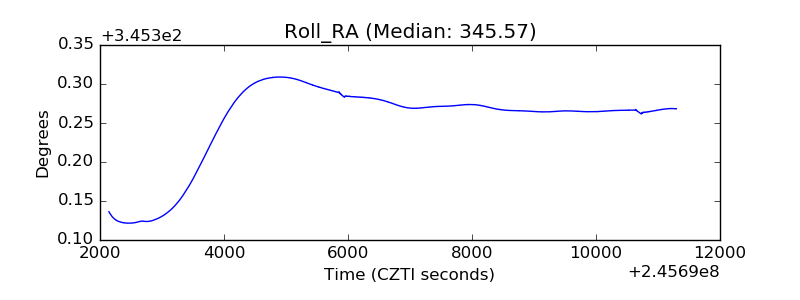 |
| Veto Counter |  |