| Param | Original file | Final file |
|---|---|---|
| Filename | modeM0/AS1A04_053T03_9000001612_11064cztM0_level2.evt | modeM0/AS1A04_053T03_9000001612_11064cztM0_level2_quad_clean.evt |
| Size (bytes) | 219,326,400 | 30,533,760 |
| Size | 209.2 MB | 29.1 MB |
| Events in quadrant A | 1,442,063 | 183,378 |
| Events in quadrant B | 1,759,626 | 178,468 |
| Events in quadrant C | 1,385,377 | 184,036 |
| Events in quadrant D | 1,858,812 | 173,682 |
| Mode SS | |||
|---|---|---|---|
| Quadrant | BADHDUFLAG | Total packets | Discarded packets |
| A | 0 | 58 | 0 |
| B | 0 | 58 | 0 |
| C | 0 | 58 | 0 |
| D | 0 | 58 | 0 |
| Mode M9 | |||
|---|---|---|---|
| Quadrant | BADHDUFLAG | Total packets | Discarded packets |
| A | 0 | 4 | 0 |
| B | 0 | 4 | 0 |
| C | 0 | 4 | 0 |
| D | 0 | 4 | 0 |
| Mode M0 | |||
|---|---|---|---|
| Quadrant | BADHDUFLAG | Total packets | Discarded packets |
| A | 0 | 6010 | 2 |
| B | 0 | 6950 | 1 |
| C | 0 | 5936 | 1 |
| D | 0 | 7292 | 1 |
| Quadrant | Total seconds | Saturated seconds | Saturation percentage |
|---|---|---|---|
| A | 2867 | 19 | 0.662714% |
| B | 2867 | 143 | 4.987792% |
| C | 2867 | 4 | 0.139519% |
| D | 2867 | 113 | 3.941402% |
Noise dominated data is calculated using 1-second bins in cleaned event files. If a bin has >2000 counts, and if more than 50% of those come from <1% of pixels, then it is considered to be noise-dominated and hence unusable.
| Quadrant | # 1 sec bins | Bins with >0 counts | Bins with >2000 counts | High rate bins dominated by noise | Noise dominated (total time) | Noise dominated (detector-on time) | Marked lightcurve |
|---|---|---|---|---|---|---|---|
| A | 3252 | 2868 | 0 | 0 | 0.00% | 0.00% |  |
| B | 3252 | 2868 | 71 | 71 | 2.18% | 2.48% | 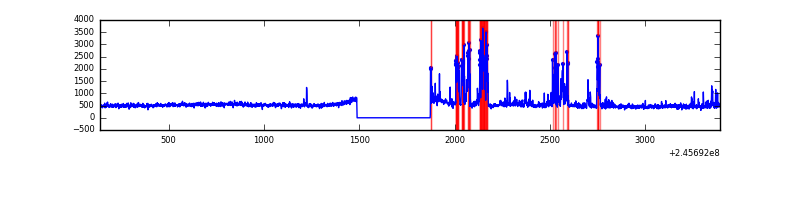 |
| C | 3252 | 2868 | 0 | 0 | 0.00% | 0.00% | 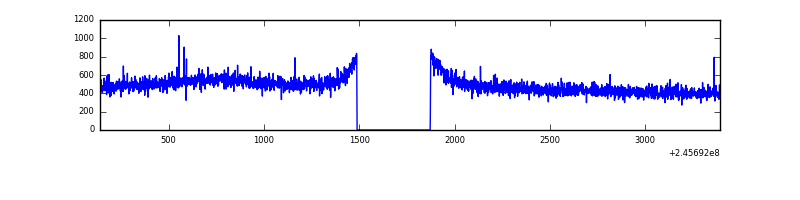 |
| D | 3252 | 2868 | 68 | 68 | 2.09% | 2.37% | 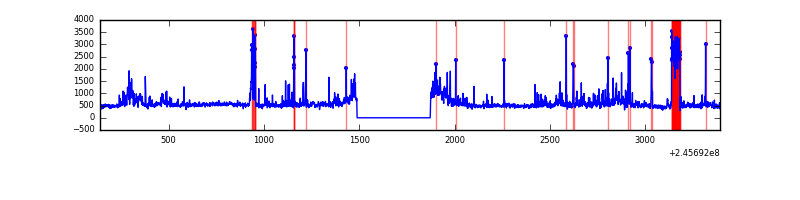 |
Top three noisy pixels from each quadrant. If the there are fewer than three noisy pixels in the level2.evt file, extra rows are filled as -1
| Pixel properties | Quadrant properties | ||||||
|---|---|---|---|---|---|---|---|
| Quadrant | DetID | PixID | Counts | Sigma | Mean | Median | Sigma |
| A | 15 | 174 | 26866 | 348.56 | 366 | 359 | 76.0 |
| A | 14 | 238 | 3615 | 42.82 | 366 | 359 | 76.0 |
| A | 0 | 226 | 3335 | 39.13 | 366 | 359 | 76.0 |
| B | 4 | 239 | 301308 | 4231.74 | 358 | 348 | 71.1 |
| B | 0 | 245 | 13143 | 179.91 | 358 | 348 | 71.1 |
| B | 15 | 204 | 12784 | 174.86 | 358 | 348 | 71.1 |
| C | 8 | 128 | 2690 | 27.83 | 353 | 355 | 83.9 |
| C | 13 | 61 | 2577 | 26.48 | 353 | 355 | 83.9 |
| C | 8 | 112 | 1628 | 15.17 | 353 | 355 | 83.9 |
| D | 14 | 34 | 122544 | 1421.54 | 351 | 341 | 86.0 |
| D | 9 | 101 | 106437 | 1234.17 | 351 | 341 | 86.0 |
| D | 1 | 52 | 94232 | 1092.19 | 351 | 341 | 86.0 |
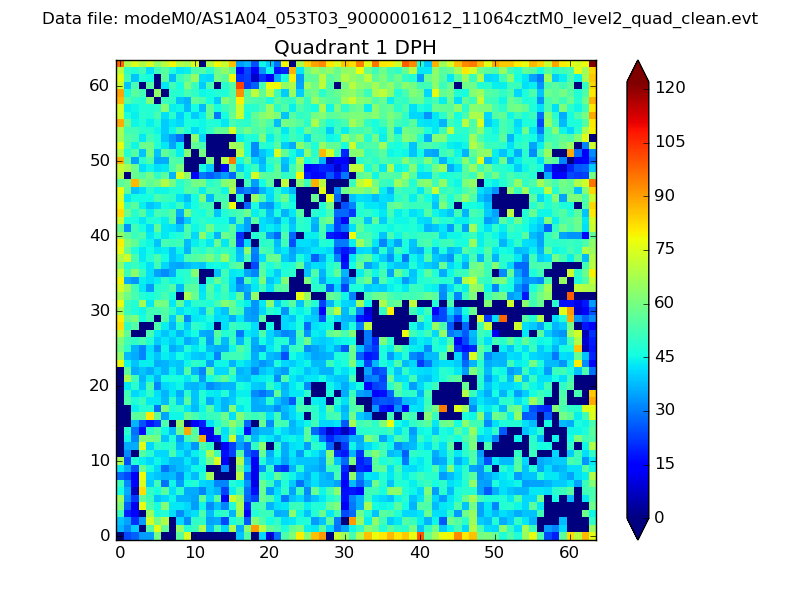
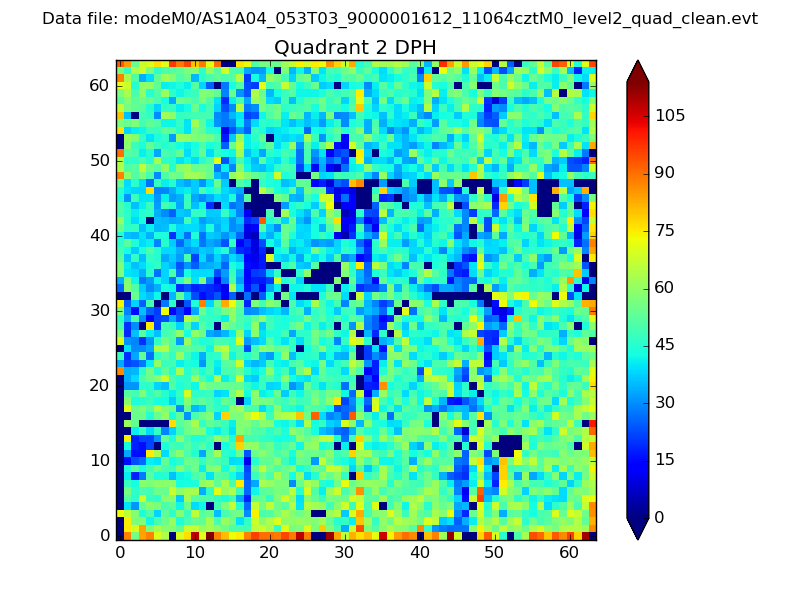
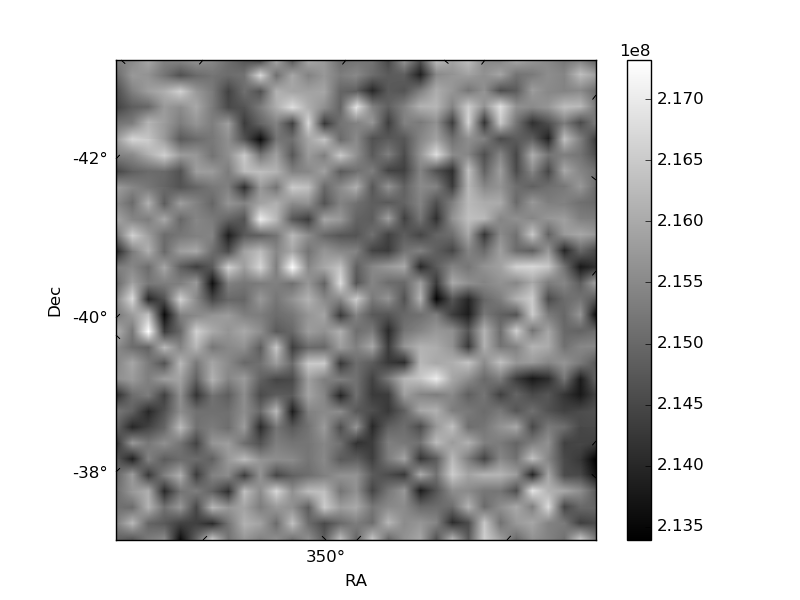
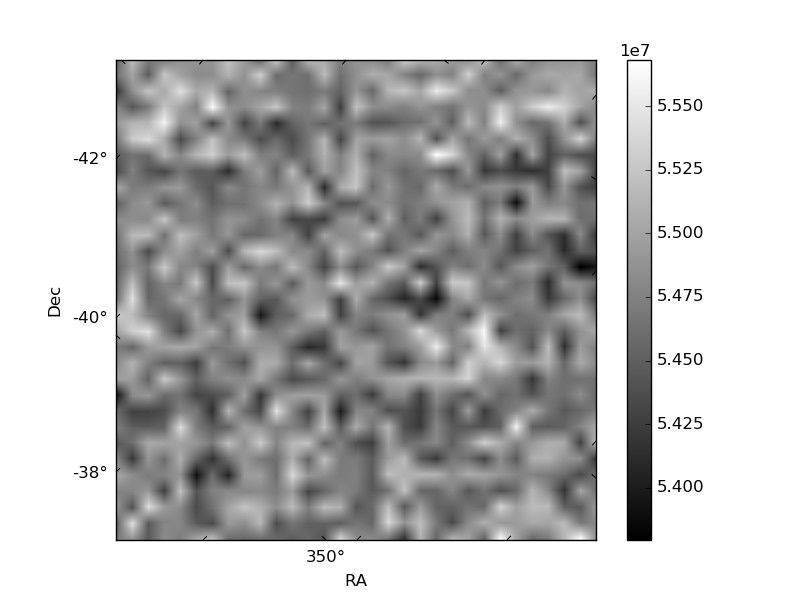
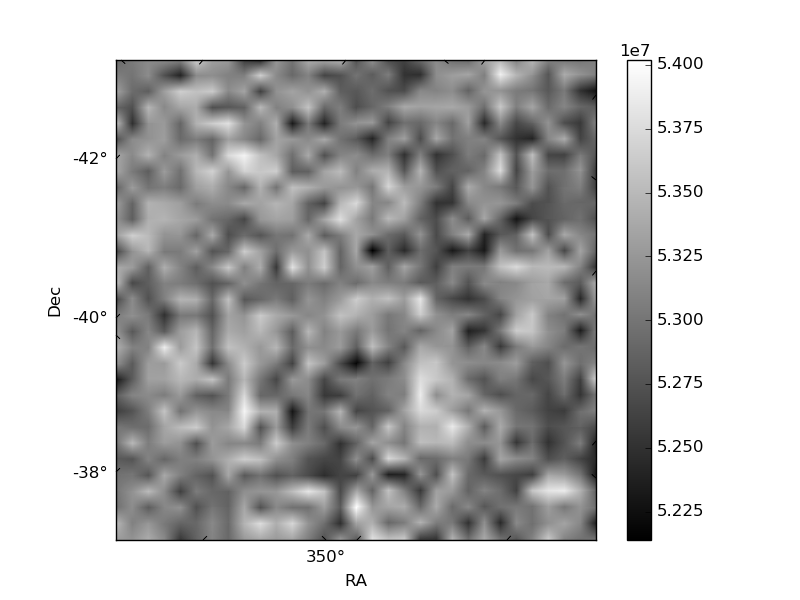
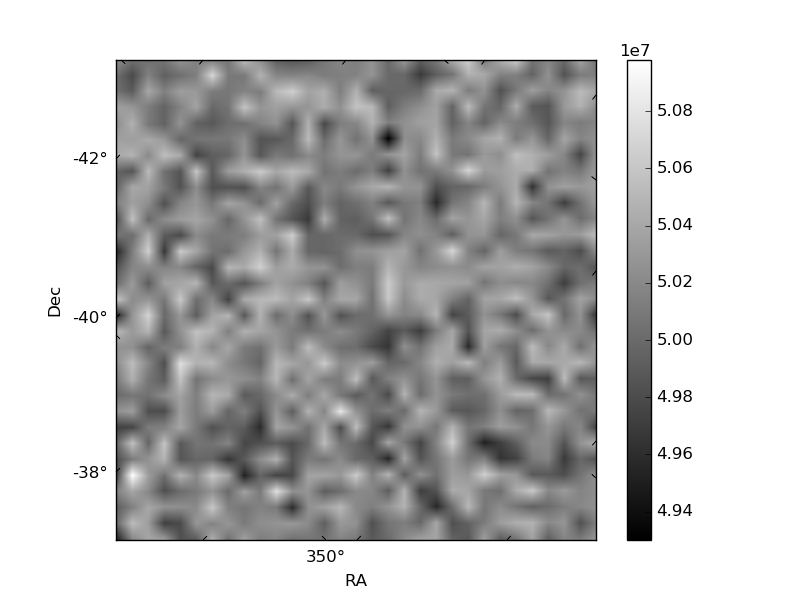
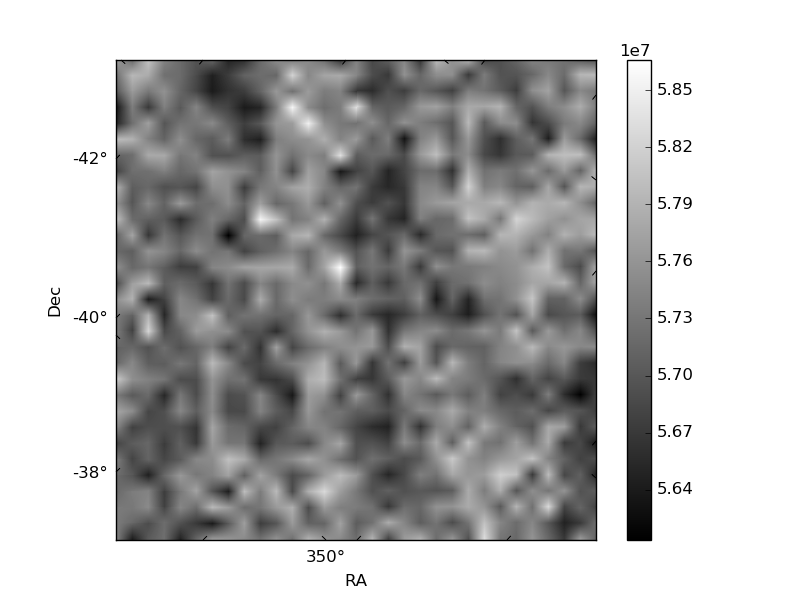
Histogram calculated using DETX and DETY for each event in the final _common_clean file
| Quadrant A | 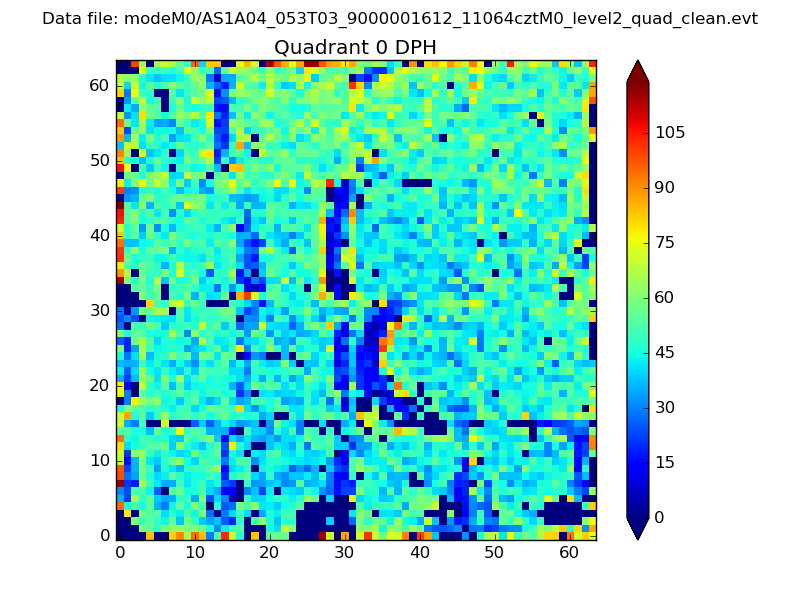 |
 |
Quadrant B |
|---|---|---|---|
| Quadrant D | 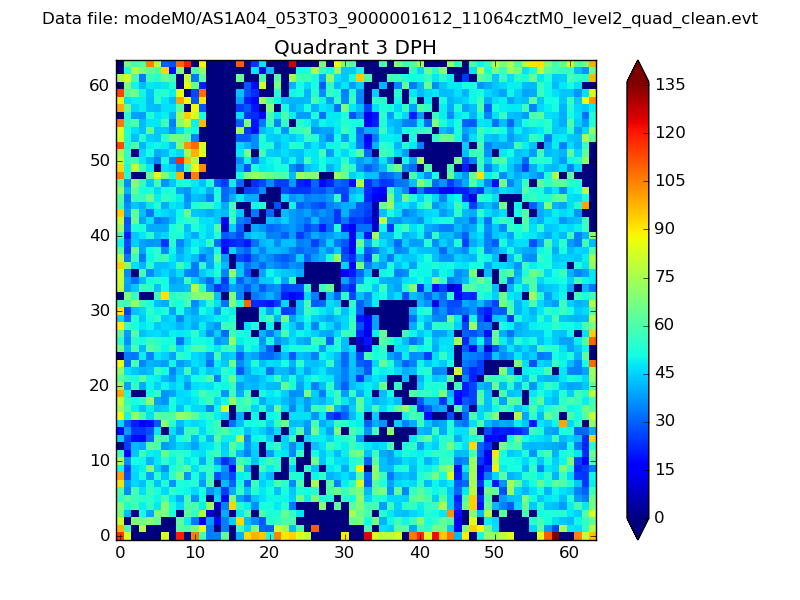 |
 |
Quadrant C |
| Plot type | Count rate plots | Images |
|---|---|---|
| Comparison with Poisson distribution Blue bars denote a histogram of data divided into 1 sec bins. Red curve is a Poisson curve with rate = median count rate of data. |
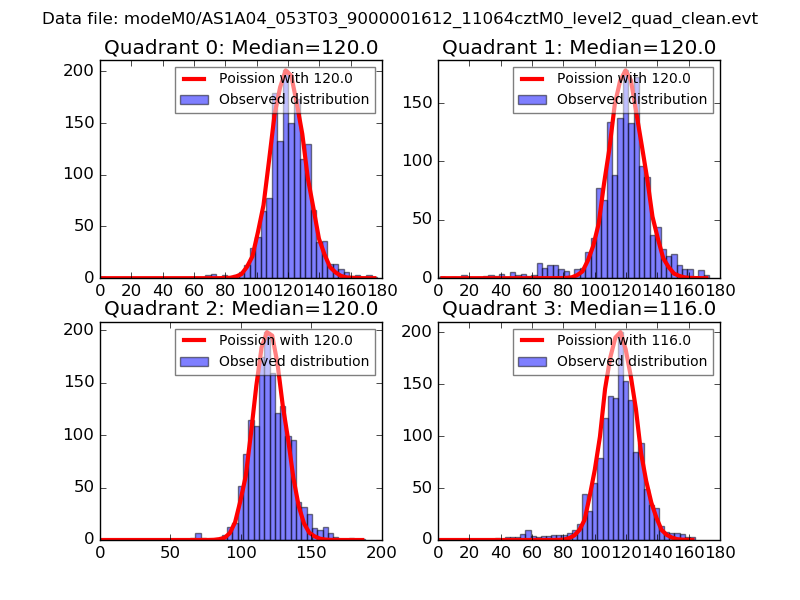 |
 |
| Quadrant-wise count rates Data is divided into 100 sec bins |
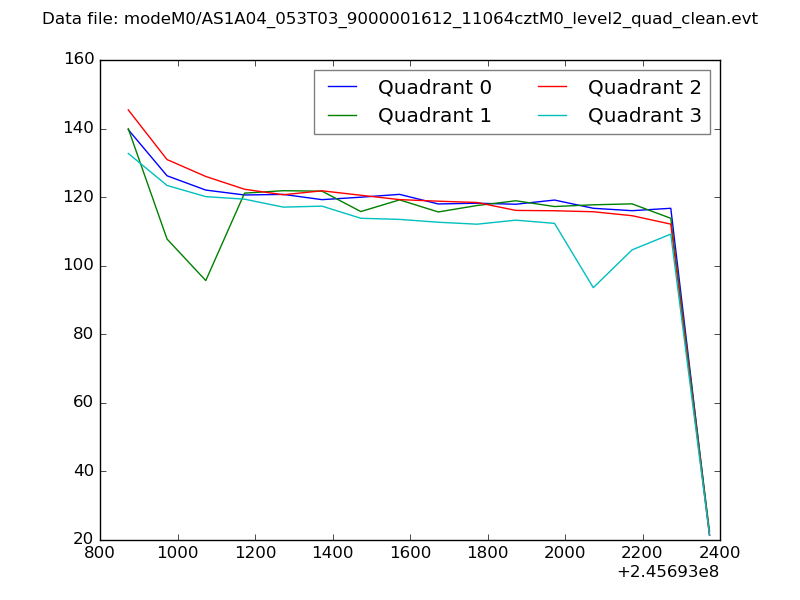 |
|
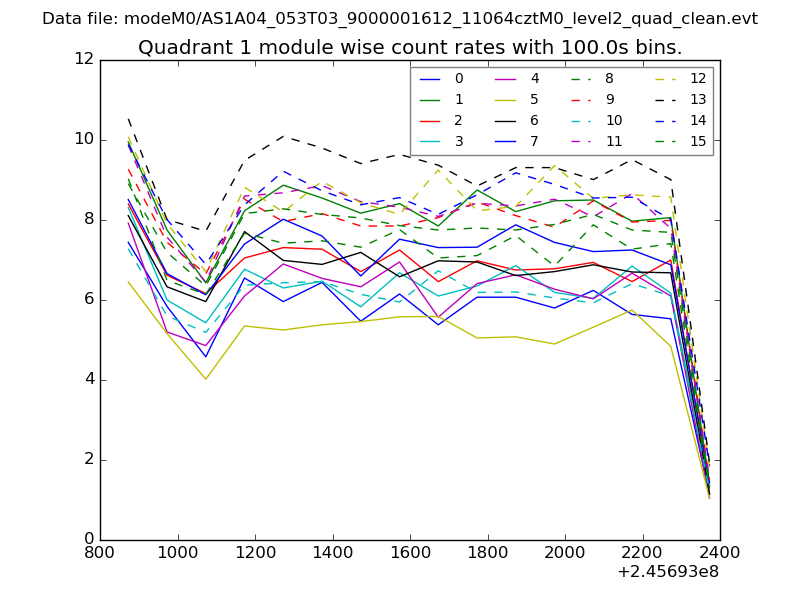
| Module-wise count rates for Quadrant A Data is divided into 100 sec bins |
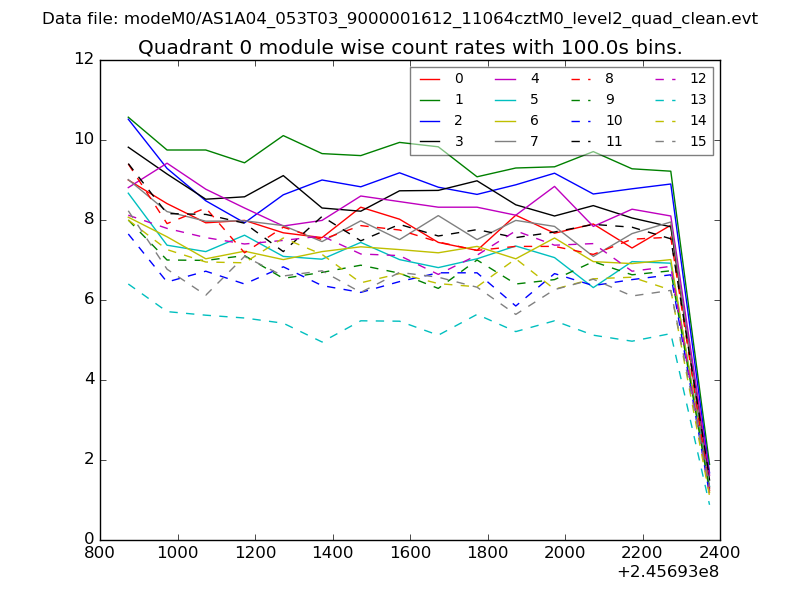 |
 |
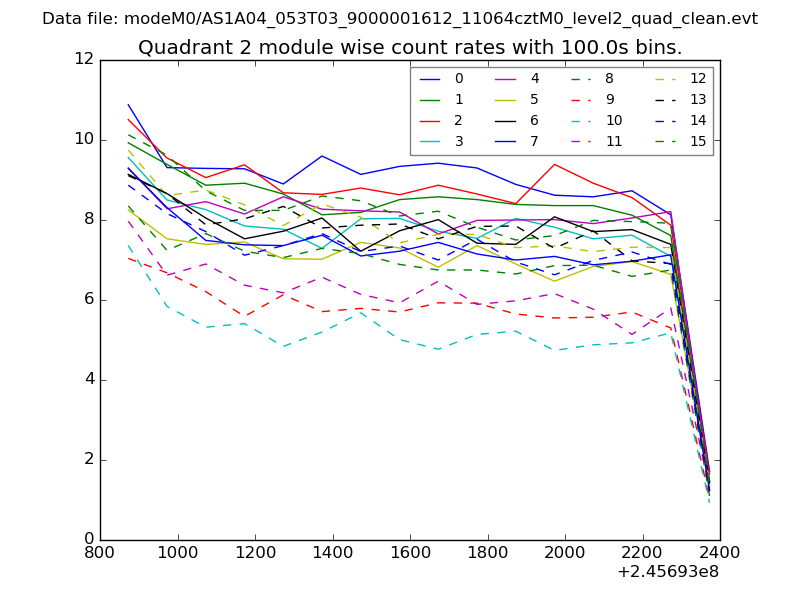
| Module-wise count rates for Quadrant B Data is divided into 100 sec bins |
 |
 |
| Module-wise count rates for Quadrant C Data is divided into 100 sec bins |
 |
 |
| Module-wise count rates for Quadrant D Data is divided into 100 sec bins |
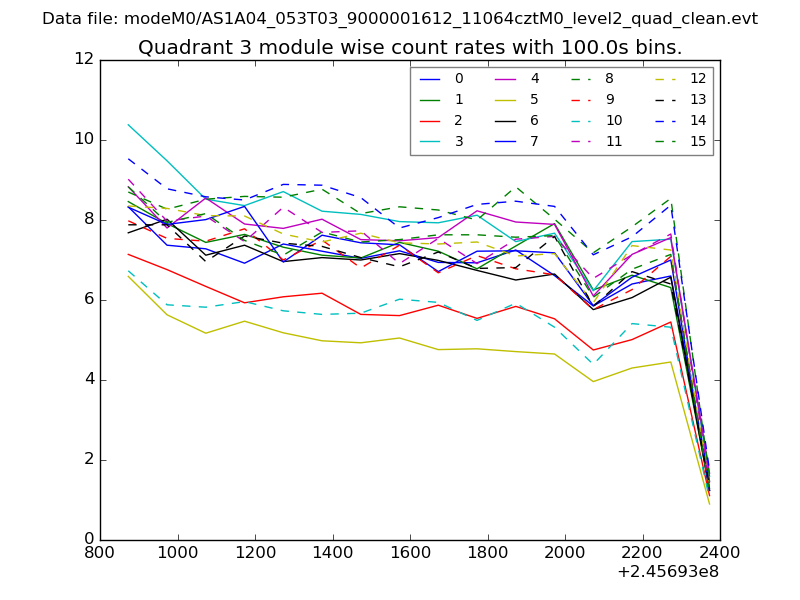 |
 |
| Parameter | Plot |
|---|---|
| CZT HV Monitor | 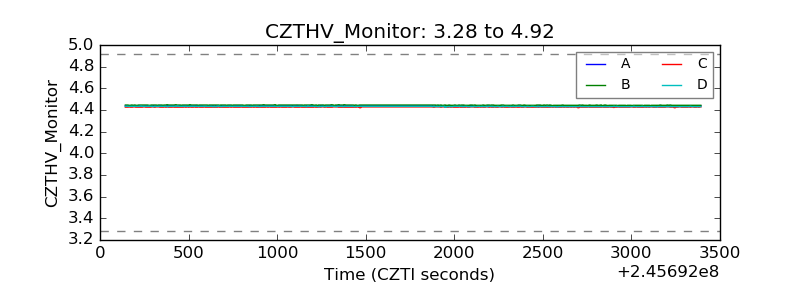 |
| D_VDD | 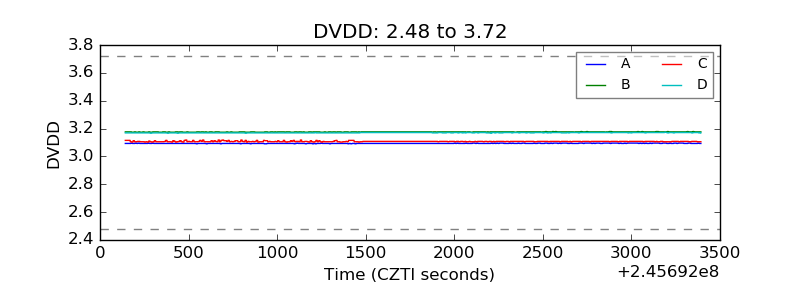 |
| Temperature 1 | 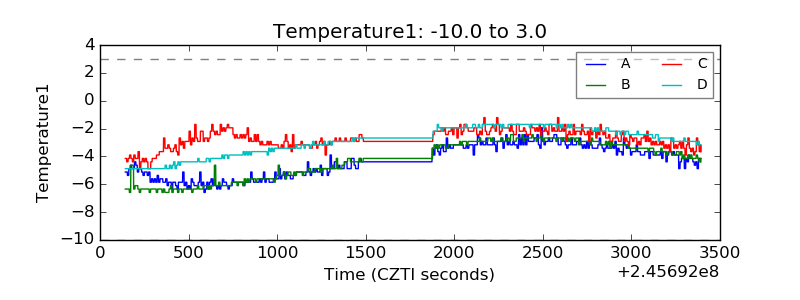 |
| Veto HV Monitor |  |
| Veto LLD | 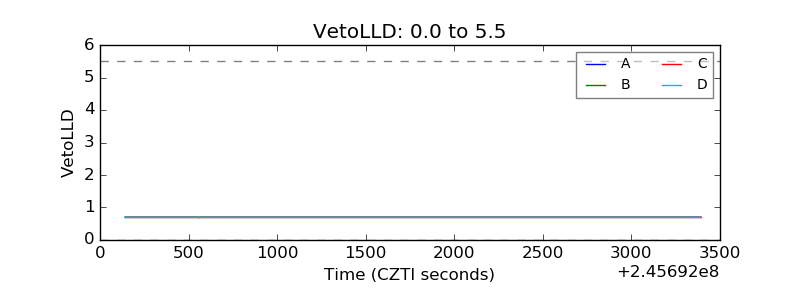 |
| Alpha Counter | 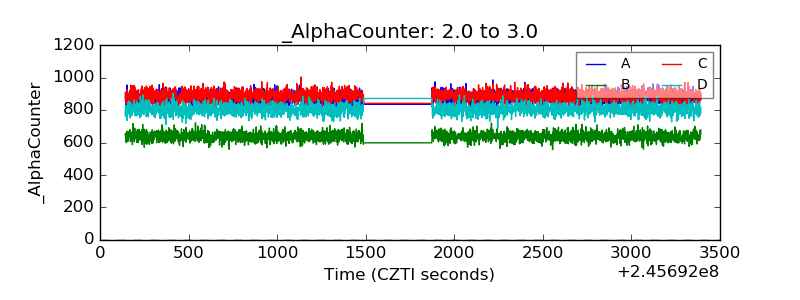 |
| _CPM_Rate | 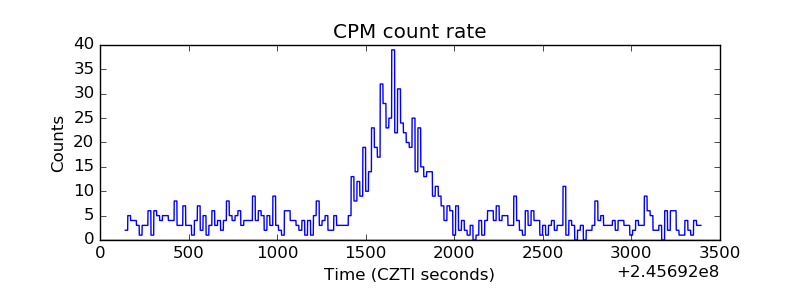 |
| CZT Counter | 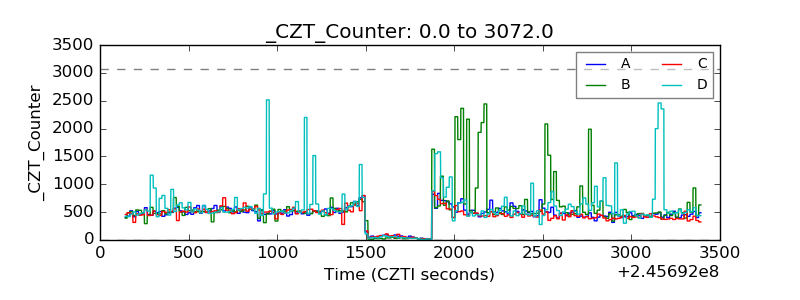 |
| +2.5 Volts monitor |  |
| +5 Volts monitor |  |
| _ROLL_ROT | 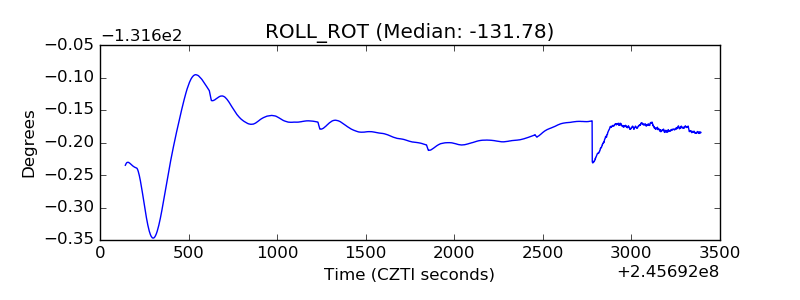 |
| _Roll_DEC | 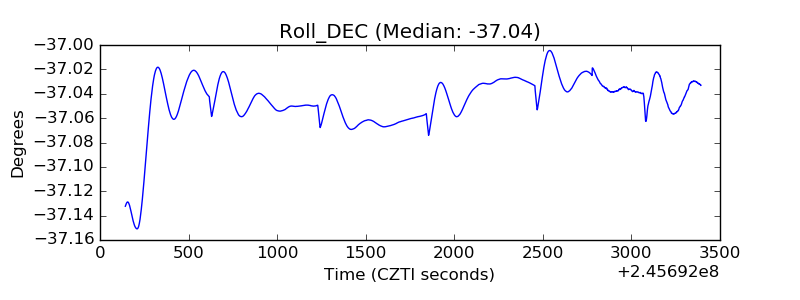 |
| _Roll_RA | 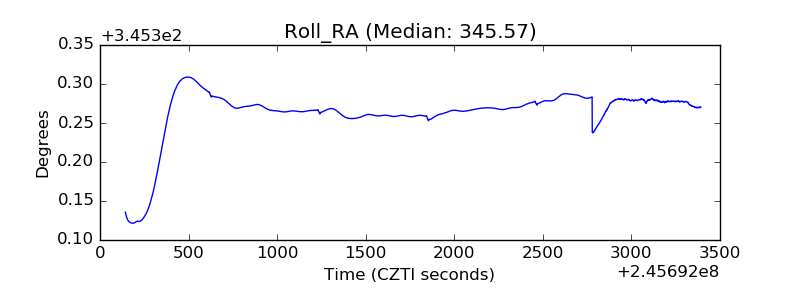 |
| Veto Counter | 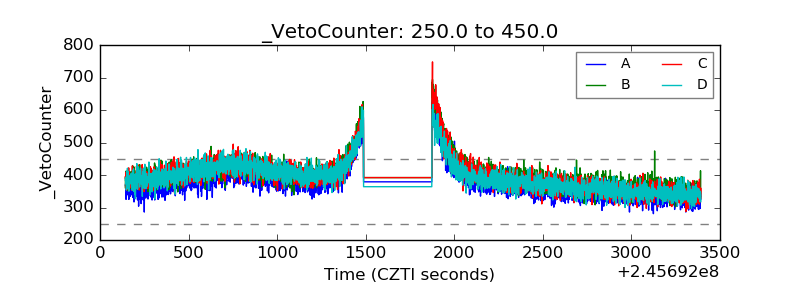 |