| Param | Original file | Final file |
|---|---|---|
| Filename | modeM0/AS1A04_053T03_9000001612_11066cztM0_level2.evt | modeM0/AS1A04_053T03_9000001612_11066cztM0_level2_quad_clean.evt |
| Size (bytes) | 482,765,760 | 87,203,520 |
| Size | 460.4 MB | 83.2 MB |
| Events in quadrant A | 3,287,805 | 550,304 |
| Events in quadrant B | 4,058,838 | 541,962 |
| Events in quadrant C | 3,032,975 | 546,620 |
| Events in quadrant D | 3,774,581 | 523,493 |
| Mode SS | |||
|---|---|---|---|
| Quadrant | BADHDUFLAG | Total packets | Discarded packets |
| A | 0 | 140 | 0 |
| B | 0 | 140 | 0 |
| C | 0 | 140 | 0 |
| D | 0 | 140 | 0 |
| Mode M9 | |||
|---|---|---|---|
| Quadrant | BADHDUFLAG | Total packets | Discarded packets |
| A | 0 | 6 | 0 |
| B | 0 | 6 | 0 |
| C | 0 | 6 | 0 |
| D | 0 | 6 | 0 |
| Mode M0 | |||
|---|---|---|---|
| Quadrant | BADHDUFLAG | Total packets | Discarded packets |
| A | 0 | 14561 | 2 |
| B | 0 | 16661 | 2 |
| C | 0 | 13992 | 2 |
| D | 0 | 15902 | 2 |
| Quadrant | Total seconds | Saturated seconds | Saturation percentage |
|---|---|---|---|
| A | 6862 | 53 | 0.772370% |
| B | 6862 | 292 | 4.255319% |
| C | 6862 | 22 | 0.320606% |
| D | 6863 | 129 | 1.879644% |
Noise dominated data is calculated using 1-second bins in cleaned event files. If a bin has >2000 counts, and if more than 50% of those come from <1% of pixels, then it is considered to be noise-dominated and hence unusable.
| Quadrant | # 1 sec bins | Bins with >0 counts | Bins with >2000 counts | High rate bins dominated by noise | Noise dominated (total time) | Noise dominated (detector-on time) | Marked lightcurve |
|---|---|---|---|---|---|---|---|
| A | 7422 | 6863 | 0 | 0 | 0.00% | 0.00% | 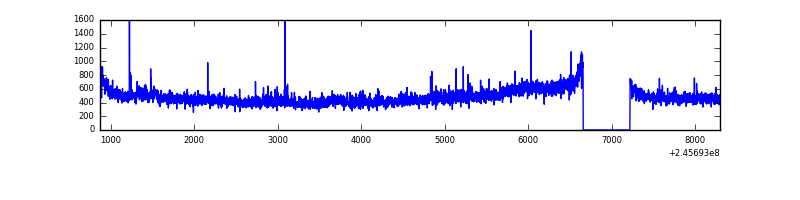 |
| B | 7422 | 6863 | 146 | 146 | 1.97% | 2.13% | 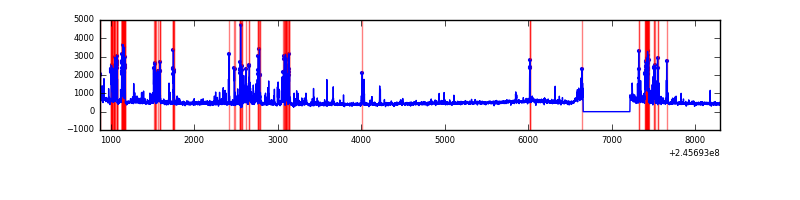 |
| C | 7422 | 6863 | 0 | 0 | 0.00% | 0.00% | 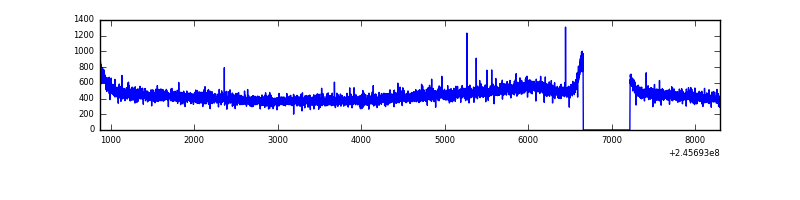 |
| D | 7423 | 6864 | 133 | 133 | 1.79% | 1.94% |  |
Top three noisy pixels from each quadrant. If the there are fewer than three noisy pixels in the level2.evt file, extra rows are filled as -1
| Pixel properties | Quadrant properties | ||||||
|---|---|---|---|---|---|---|---|
| Quadrant | DetID | PixID | Counts | Sigma | Mean | Median | Sigma |
| A | 15 | 174 | 145328 | 878.36 | 803 | 785 | 164.6 |
| A | 1 | 162 | 13683 | 78.38 | 803 | 785 | 164.6 |
| A | 14 | 254 | 9947 | 55.68 | 803 | 785 | 164.6 |
| B | 4 | 239 | 803825 | 5244.85 | 793 | 772 | 153.1 |
| B | 0 | 245 | 49879 | 320.72 | 793 | 772 | 153.1 |
| B | 0 | 214 | 28640 | 182.01 | 793 | 772 | 153.1 |
| C | 13 | 61 | 5605 | 26.5 | 776 | 780 | 182.0 |
| C | 8 | 128 | 3639 | 15.7 | 776 | 780 | 182.0 |
| C | 8 | 112 | 2073 | 7.1 | 776 | 780 | 182.0 |
| D | 9 | 101 | 277954 | 1494.91 | 770 | 749 | 185.4 |
| D | 14 | 34 | 131925 | 707.4 | 770 | 749 | 185.4 |
| D | 8 | 195 | 113062 | 605.68 | 770 | 749 | 185.4 |
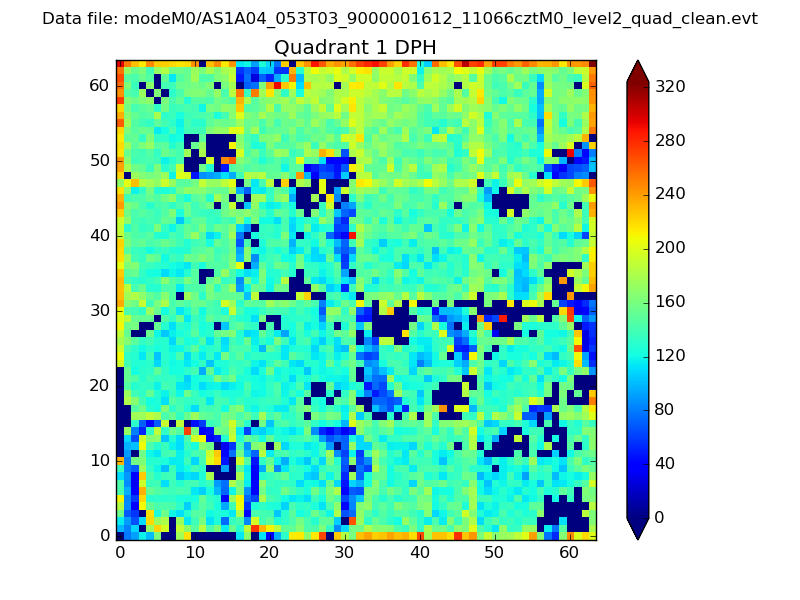
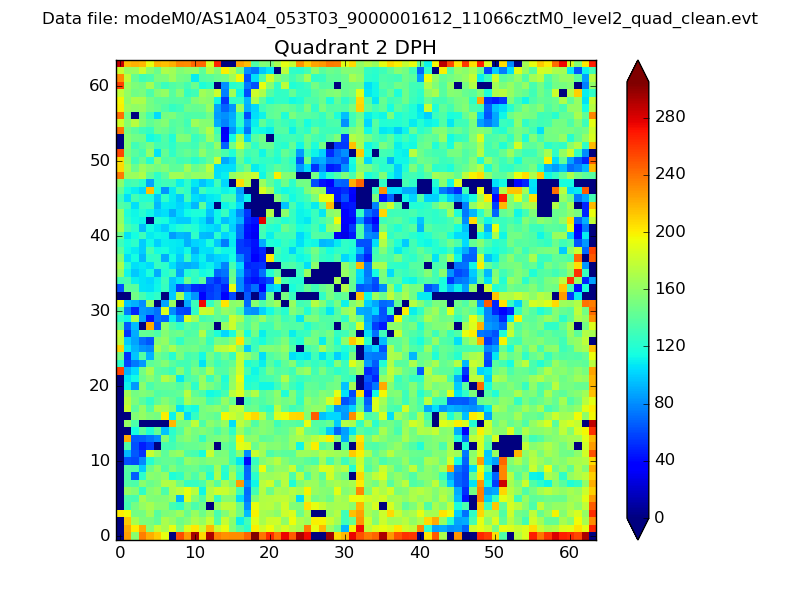
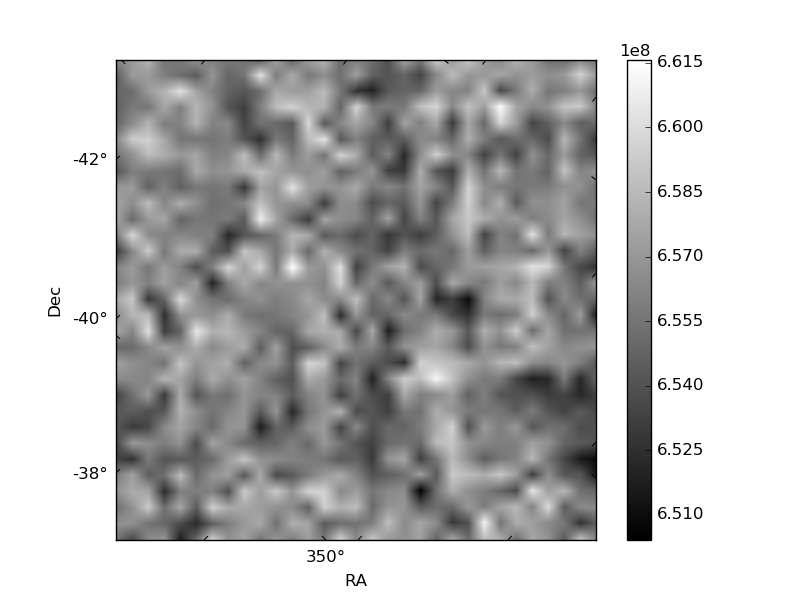
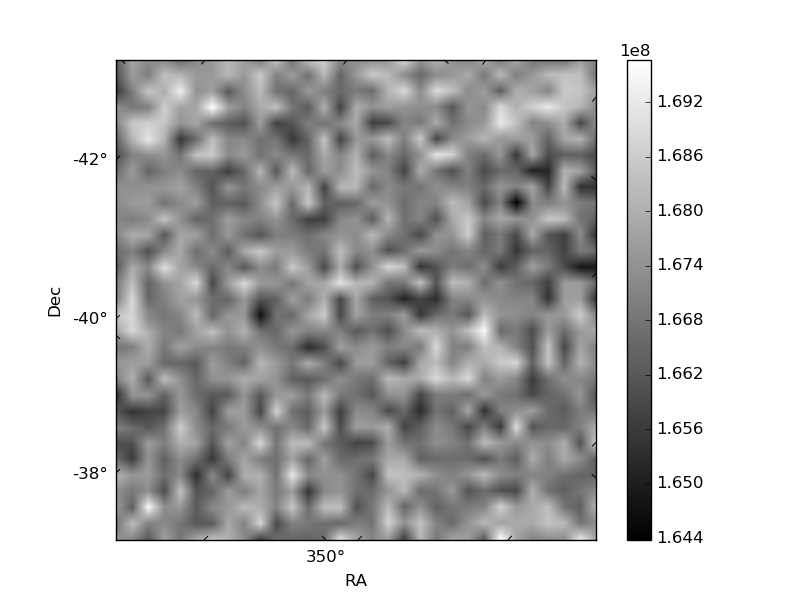
Histogram calculated using DETX and DETY for each event in the final _common_clean file
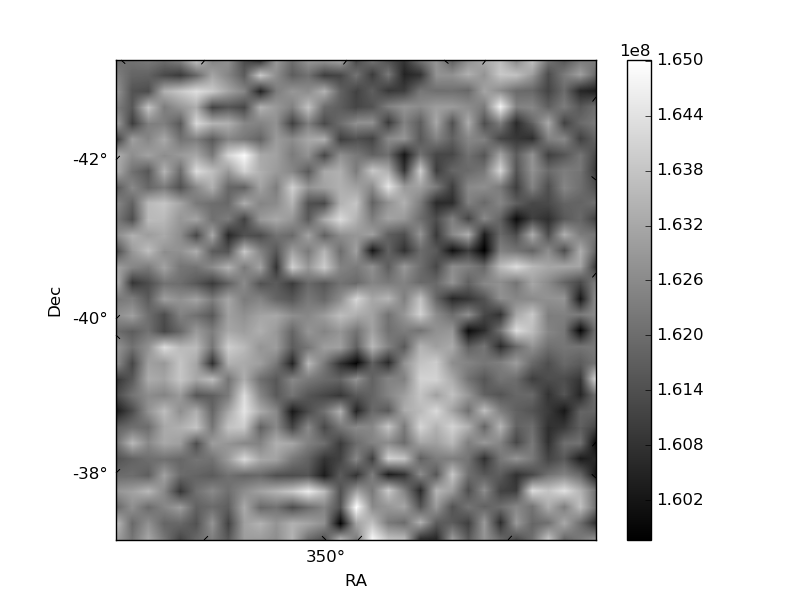
| Quadrant A | 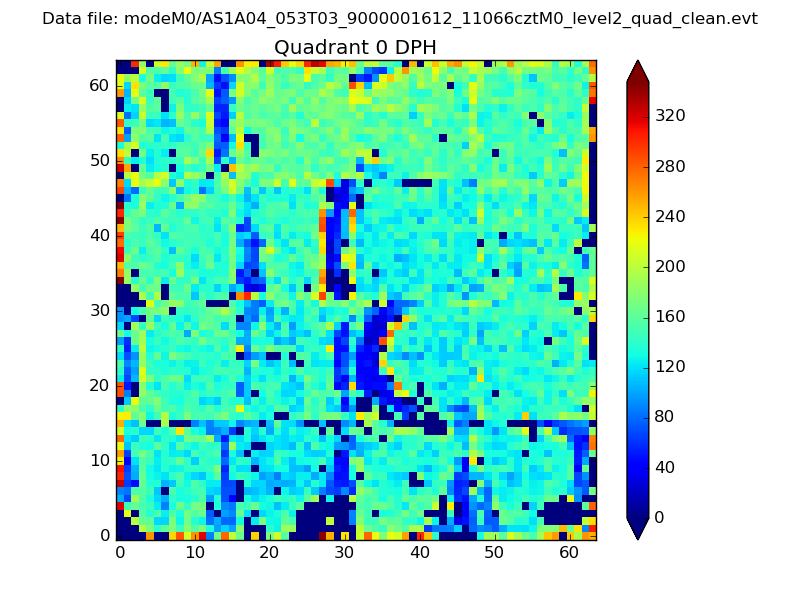 |
 |
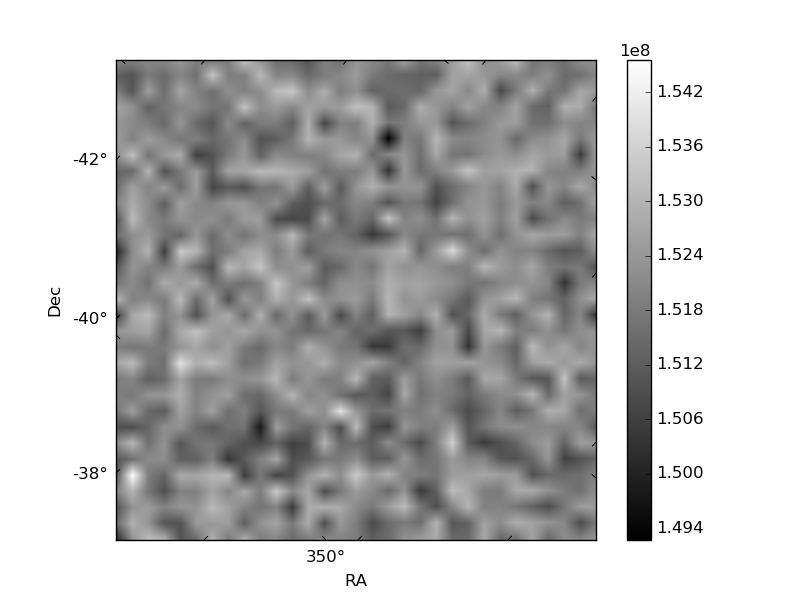
Quadrant B |
|---|---|---|---|
| Quadrant D | 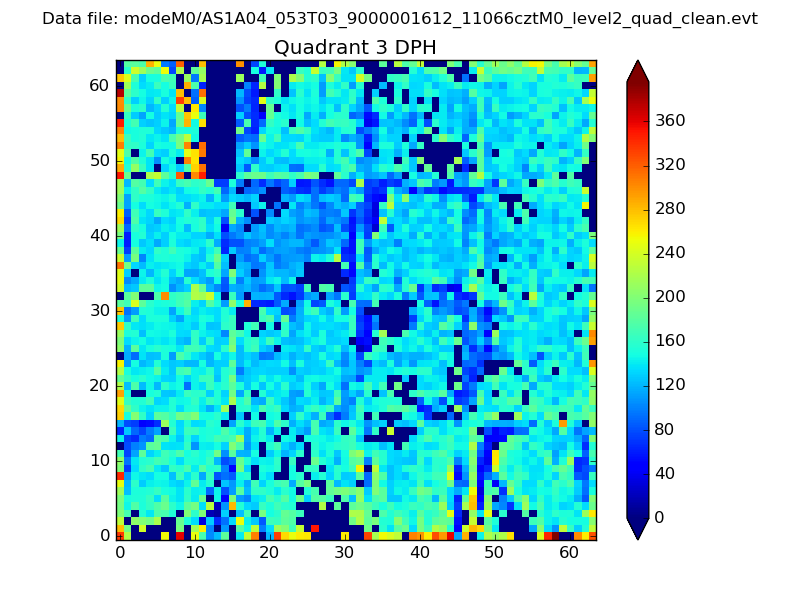 |
 |
Quadrant C |
| Plot type | Count rate plots | Images |
|---|---|---|
| Comparison with Poisson distribution Blue bars denote a histogram of data divided into 1 sec bins. Red curve is a Poisson curve with rate = median count rate of data. |
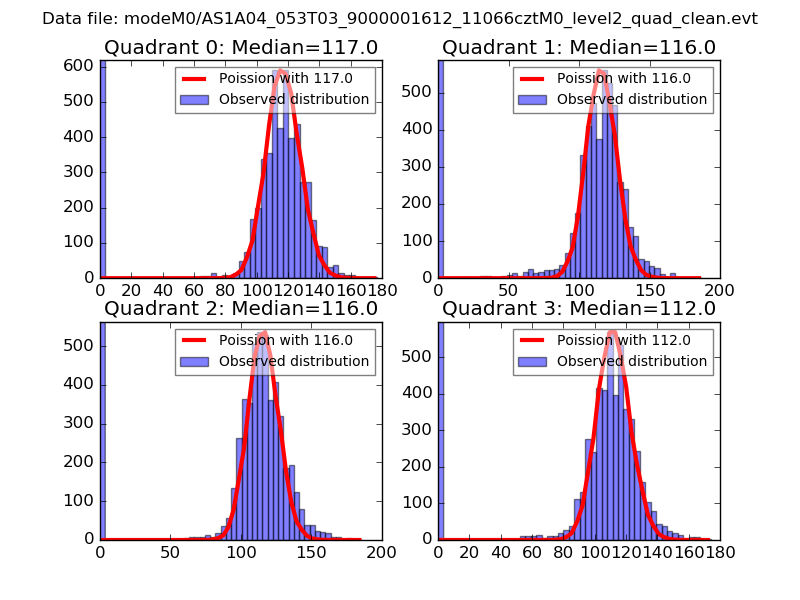 |
 |
| Quadrant-wise count rates Data is divided into 100 sec bins |
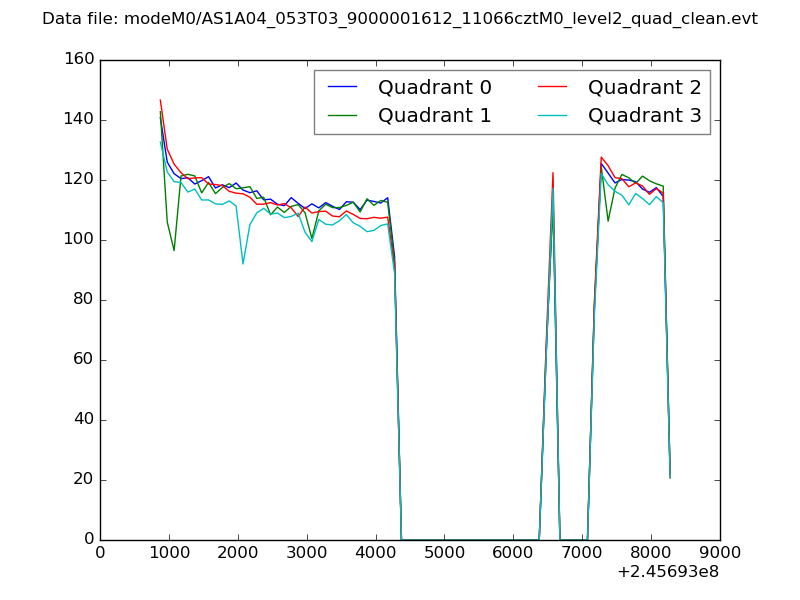 |
|
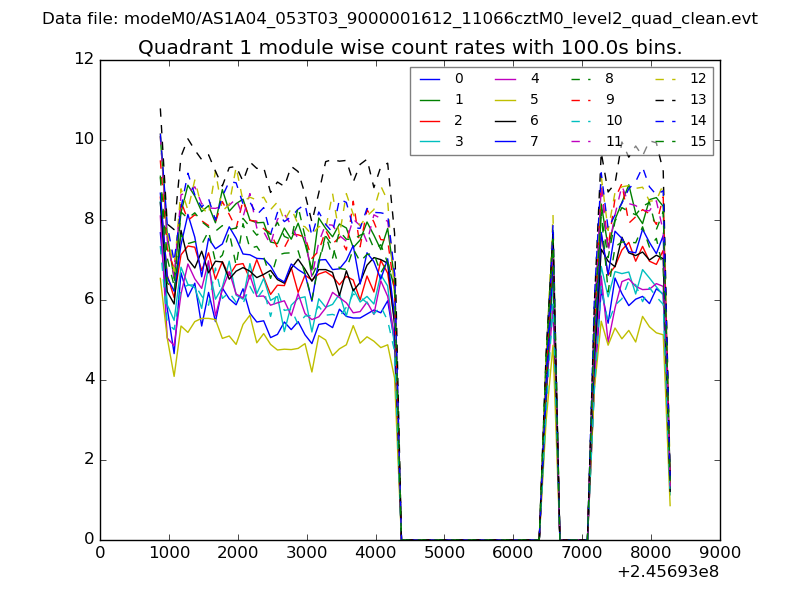
| Module-wise count rates for Quadrant A Data is divided into 100 sec bins |
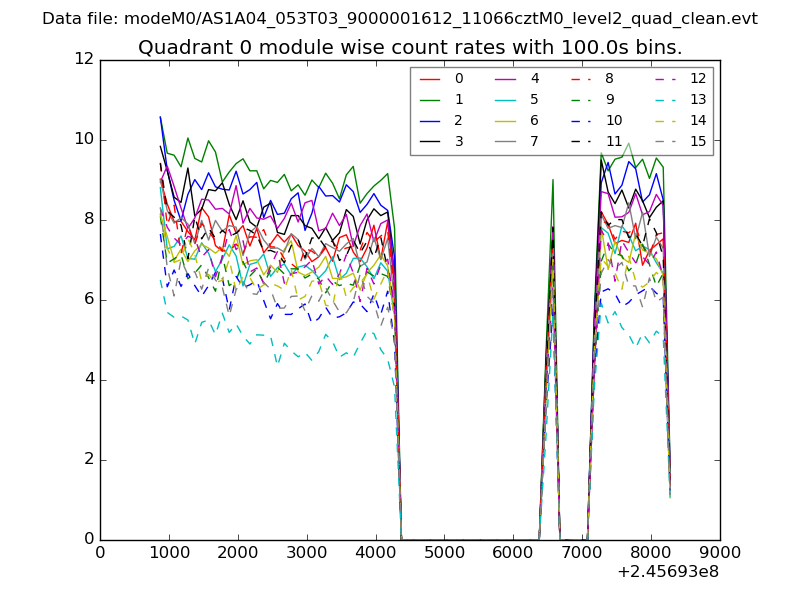 |
 |
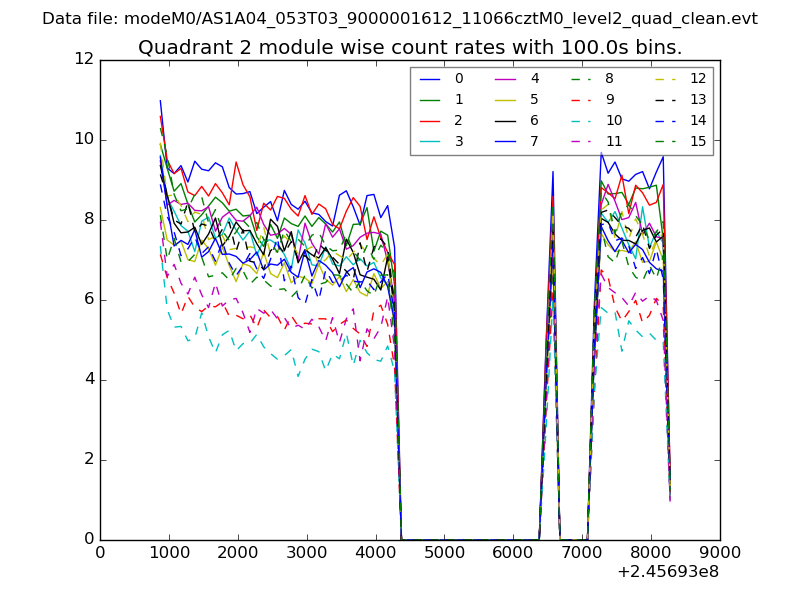
| Module-wise count rates for Quadrant B Data is divided into 100 sec bins |
 |
 |
| Module-wise count rates for Quadrant C Data is divided into 100 sec bins |
 |
 |
| Module-wise count rates for Quadrant D Data is divided into 100 sec bins |
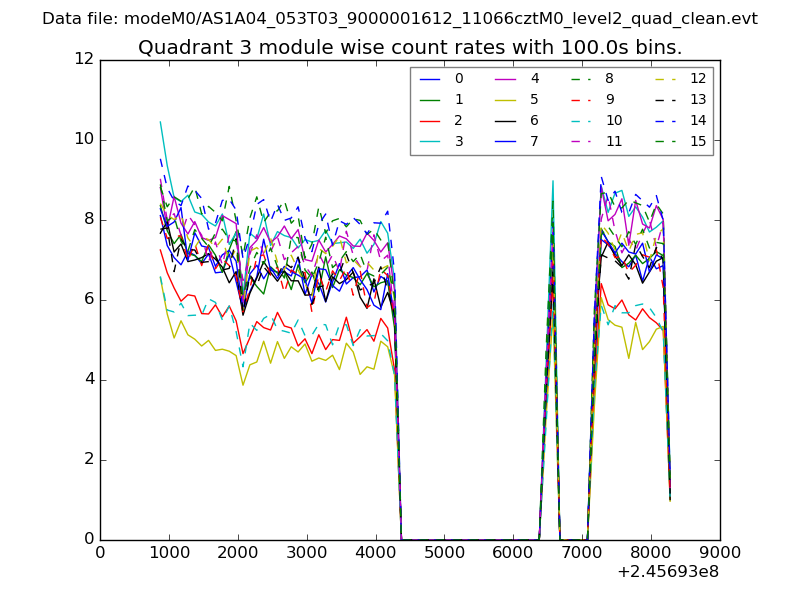 |
 |
| Parameter | Plot |
|---|---|
| CZT HV Monitor | 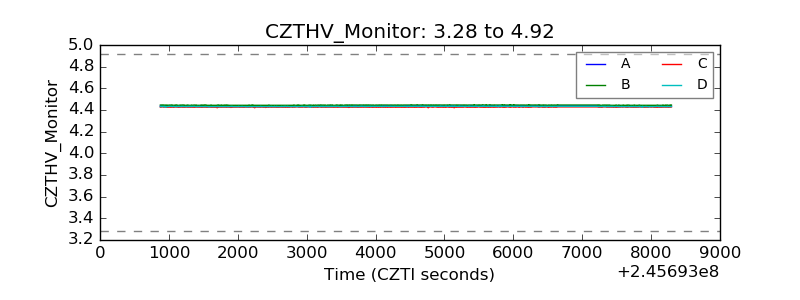 |
| D_VDD |  |
| Temperature 1 | 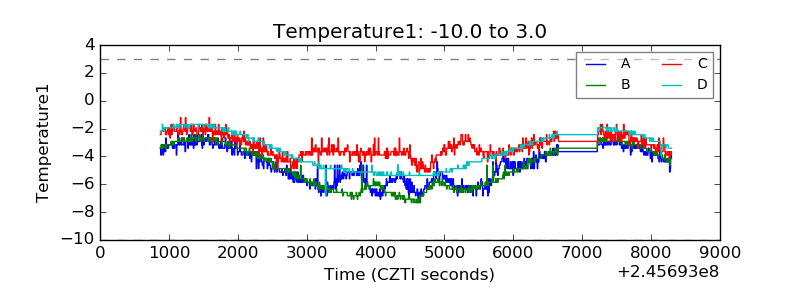 |
| Veto HV Monitor | 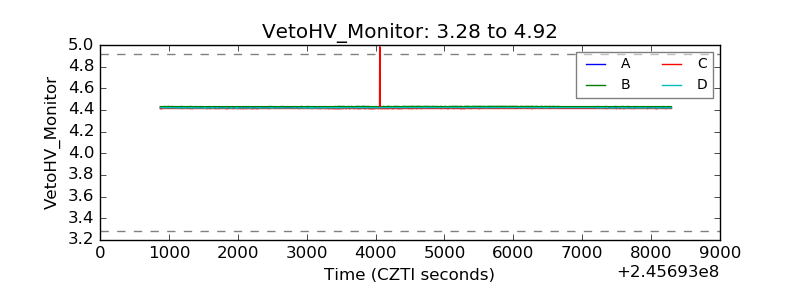 |
| Veto LLD | 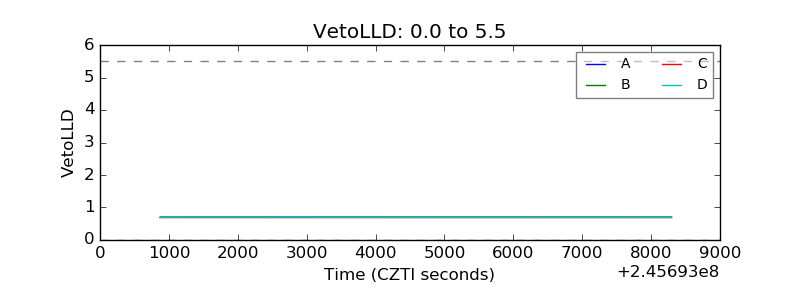 |
| Alpha Counter | 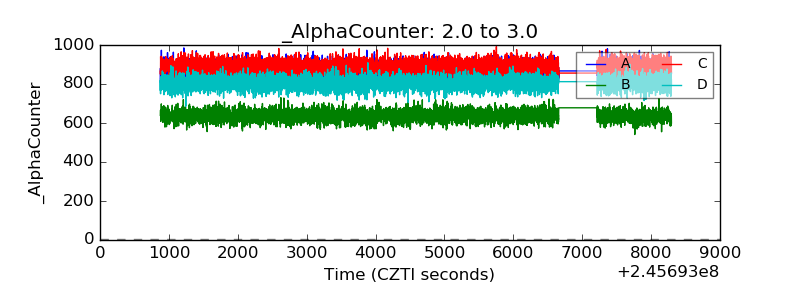 |
| _CPM_Rate | 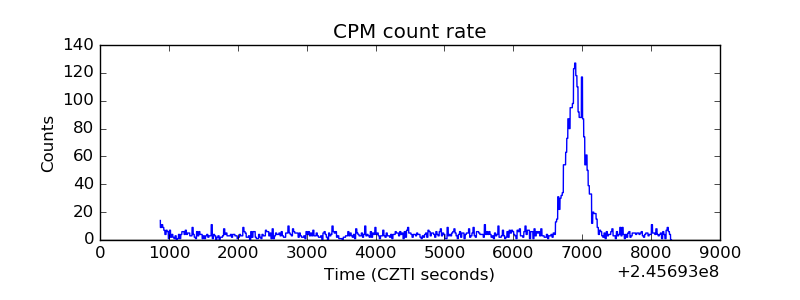 |
| CZT Counter | 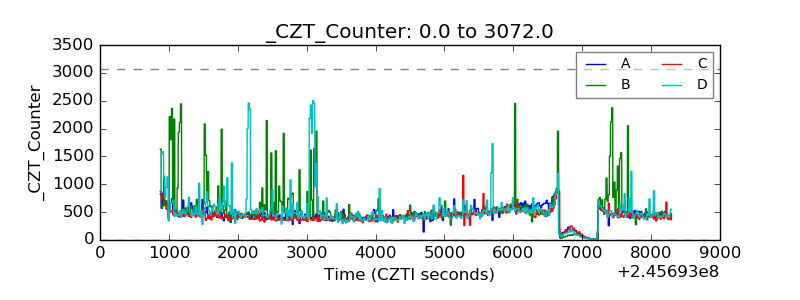 |
| +2.5 Volts monitor |  |
| +5 Volts monitor |  |
| _ROLL_ROT | 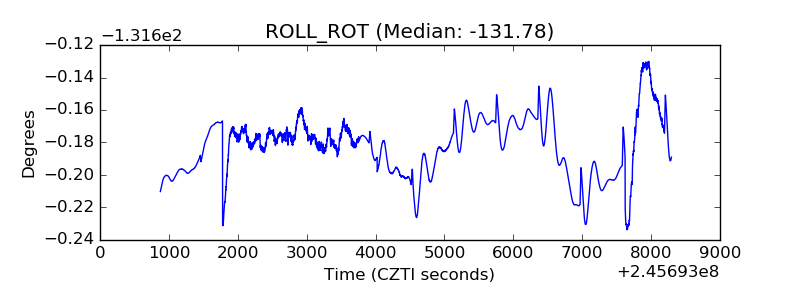 |
| _Roll_DEC | 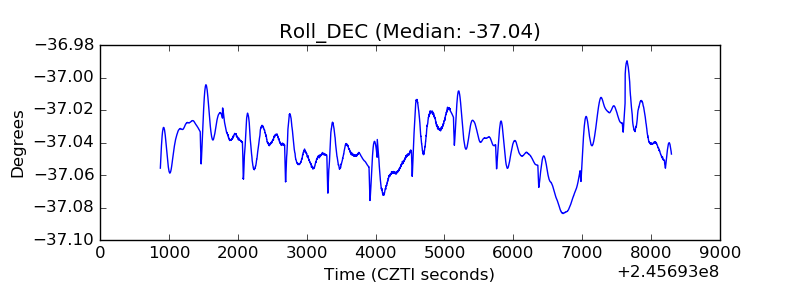 |
| _Roll_RA | 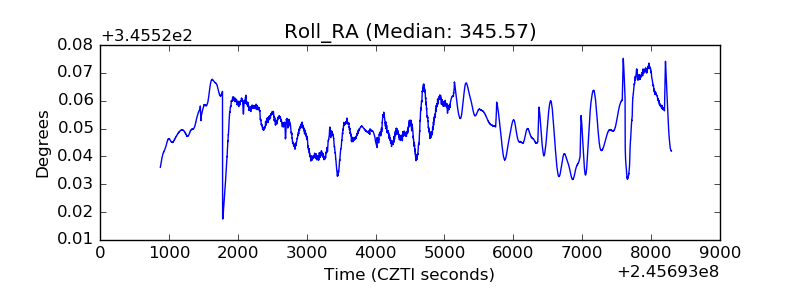 |
| Veto Counter | 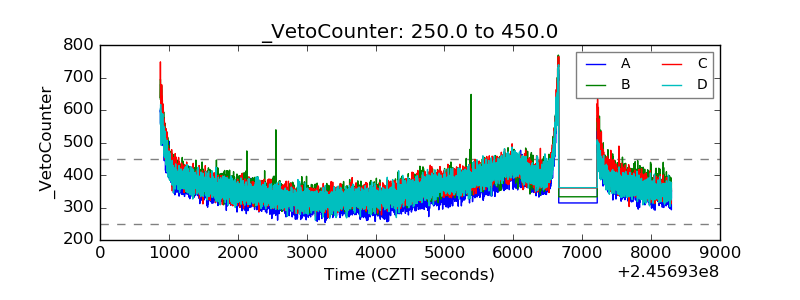 |