| Param | Original file | Final file |
|---|---|---|
| Filename | modeM0/AS1A04_053T04_9000001614cztM0_level2.fits | modeM0/AS1A04_053T04_9000001614cztM0_level2_quad_clean.evt |
| Size (bytes) | 60,984,000 | 49,219,200 |
| Size | 58.2 MB | 46.9 MB |
| Events in quadrant A | 359,816 | 265,833 |
| Events in quadrant B | 344,796 | 260,496 |
| Events in quadrant C | 356,120 | 251,543 |
| Events in quadrant D | 308,420 | 233,589 |
| Mode SS | |||
|---|---|---|---|
| Quadrant | BADHDUFLAG | Total packets | Discarded packets |
| A | 0 | 138 | 0 |
| B | 0 | 138 | 0 |
| C | 0 | 138 | 0 |
| D | 0 | 138 | 0 |
| Mode M9 | |||
|---|---|---|---|
| Quadrant | BADHDUFLAG | Total packets | Discarded packets |
| A | 0 | 8 | 0 |
| B | 0 | 8 | 0 |
| C | 0 | 8 | 0 |
| D | 0 | 8 | 0 |
| Mode M0 | |||
|---|---|---|---|
| Quadrant | BADHDUFLAG | Total packets | Discarded packets |
| A | 0 | 15296 | 0 |
| B | 0 | 16440 | 0 |
| C | 0 | 13871 | 0 |
| D | 0 | 15211 | 0 |
| Quadrant | Total seconds | Saturated seconds | Saturation percentage |
|---|---|---|---|
| A | 6864 | 29 | 0.422494% |
| B | 6865 | 191 | 2.782229% |
| C | 6863 | 7 | 0.101996% |
| D | 6865 | 49 | 0.713765% |
Noise dominated data is calculated using 1-second bins in cleaned event files. If a bin has >2000 counts, and if more than 50% of those come from <1% of pixels, then it is considered to be noise-dominated and hence unusable.
| Quadrant | # 1 sec bins | Bins with >0 counts | Bins with >2000 counts | High rate bins dominated by noise | Noise dominated (total time) | Noise dominated (detector-on time) | Marked lightcurve |
|---|---|---|---|---|---|---|---|
| A | 7606 | 6866 | 0 | 0 | 0.00% | 0.00% | 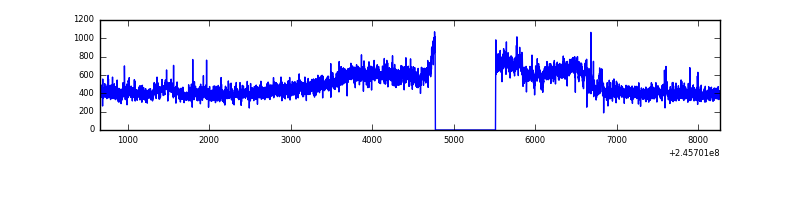 |
| B | 7606 | 6865 | 0 | 0 | 0.00% | 0.00% |  |
| C | 7606 | 6866 | 0 | 0 | 0.00% | 0.00% | 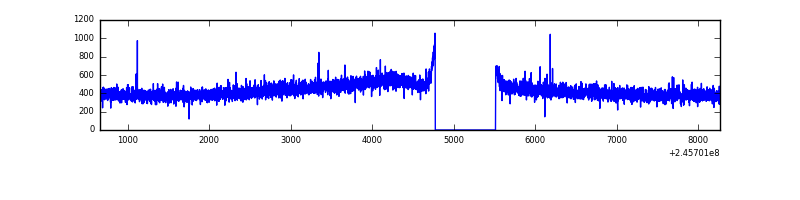 |
| D | 7606 | 6864 | 0 | 0 | 0.00% | 0.00% |  |
Top three noisy pixels from each quadrant. If the there are fewer than three noisy pixels in the level2.evt file, extra rows are filled as -1
| Pixel properties | Quadrant properties | ||||||
|---|---|---|---|---|---|---|---|
| Quadrant | DetID | PixID | Counts | Sigma | Mean | Median | Sigma |
| A | 0 | 29 | 355 | 10.27 | 93 | 87 | 26.1 |
| A | 14 | 188 | 349 | 10.04 | 93 | 87 | 26.1 |
| A | 14 | 204 | 306 | 8.39 | 93 | 87 | 26.1 |
| B | 2 | 9 | 295 | 10.22 | 90 | 86 | 20.5 |
| B | 3 | 17 | 256 | 8.31 | 90 | 86 | 20.5 |
| B | 14 | 254 | 236 | 7.33 | 90 | 86 | 20.5 |
| C | 12 | 250 | 247 | 6.05 | 94 | 87 | 26.4 |
| C | 12 | 249 | 245 | 5.98 | 94 | 87 | 26.4 |
| C | 3 | 235 | 240 | 5.79 | 94 | 87 | 26.4 |
| D | 1 | 31 | 242 | 6.41 | 87 | 80 | 25.3 |
| D | 10 | 189 | 235 | 6.13 | 87 | 80 | 25.3 |
| D | 4 | 160 | 233 | 6.05 | 87 | 80 | 25.3 |
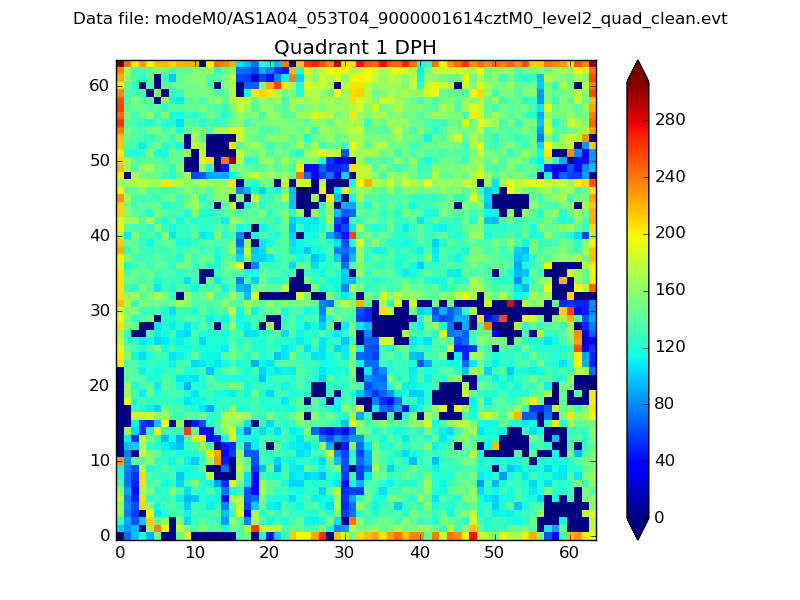
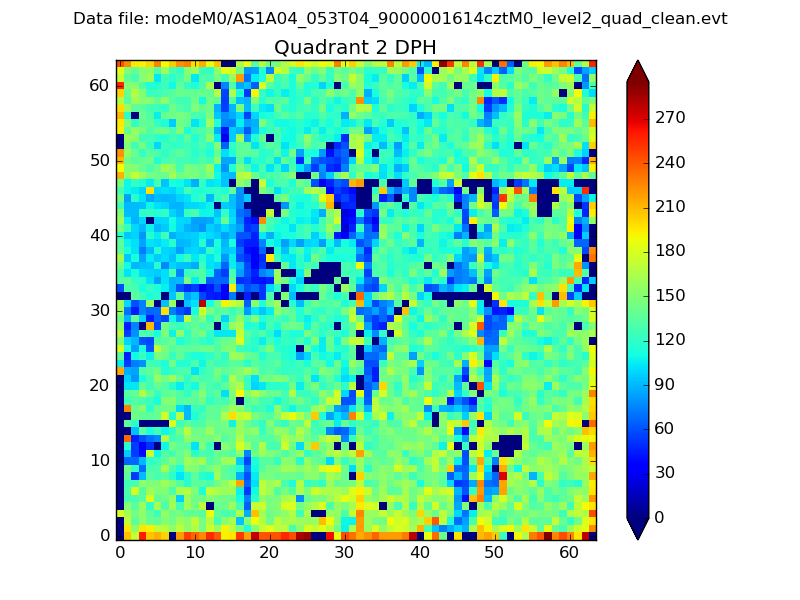
Histogram calculated using DETX and DETY for each event in the final _common_clean file
| Quadrant A |  |
 |
Quadrant B |
|---|---|---|---|
| Quadrant D |  |
 |
Quadrant C |
| Plot type | Count rate plots | Images |
|---|---|---|
| Comparison with Poisson distribution Blue bars denote a histogram of data divided into 1 sec bins. Red curve is a Poisson curve with rate = median count rate of data. |
 |
 |
| Quadrant-wise count rates Data is divided into 100 sec bins |
 |
|
| Module-wise count rates for Quadrant A Data is divided into 100 sec bins |
 |
 |
| Module-wise count rates for Quadrant B Data is divided into 100 sec bins |
 |
 |
| Module-wise count rates for Quadrant C Data is divided into 100 sec bins |
 |
 |
| Module-wise count rates for Quadrant D Data is divided into 100 sec bins |
 |
 |
| Parameter | Plot |
|---|---|
| CZT HV Monitor |  |
| D_VDD | 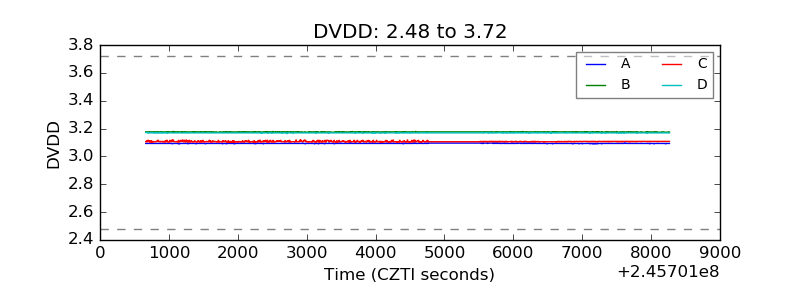 |
| Temperature 1 |  |
| Veto HV Monitor |  |
| Veto LLD |  |
| Alpha Counter | 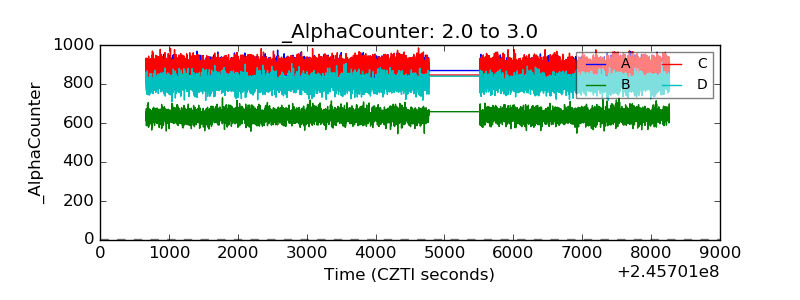 |
| _CPM_Rate |  |
| CZT Counter |  |
| +2.5 Volts monitor | 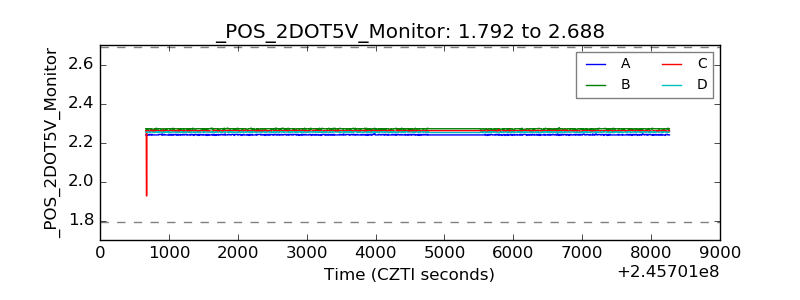 |
| +5 Volts monitor | 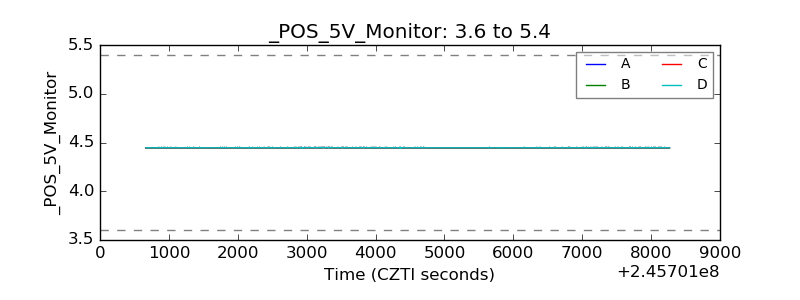 |
| _ROLL_ROT |  |
| _Roll_DEC |  |
| _Roll_RA | 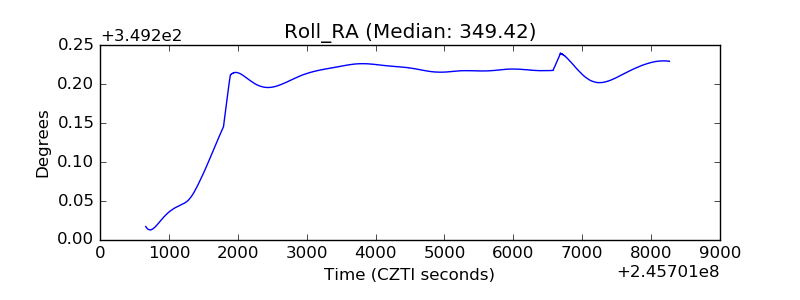 |
| Veto Counter | 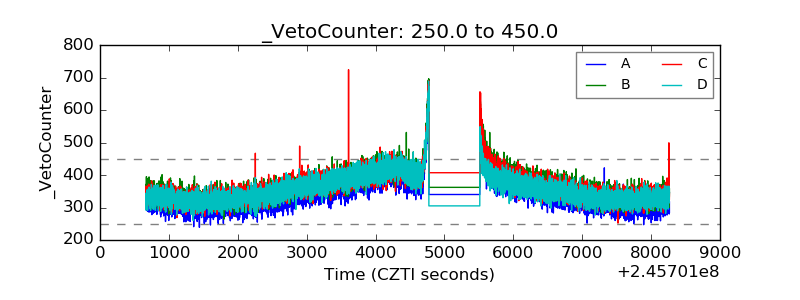 |