| Param | Original file | Final file |
|---|---|---|
| Filename | modeM0/AS1A04_053T04_9000001614_11066cztM0_level2.evt | modeM0/AS1A04_053T04_9000001614_11066cztM0_level2_quad_clean.evt |
| Size (bytes) | 398,649,600 | 67,017,600 |
| Size | 380.2 MB | 63.9 MB |
| Events in quadrant A | 2,927,876 | 414,878 |
| Events in quadrant B | 3,403,904 | 411,054 |
| Events in quadrant C | 2,504,149 | 408,231 |
| Events in quadrant D | 2,846,637 | 393,732 |
| Mode SS | |||
|---|---|---|---|
| Quadrant | BADHDUFLAG | Total packets | Discarded packets |
| A | 0 | 116 | 0 |
| B | 0 | 116 | 0 |
| C | 0 | 116 | 0 |
| D | 0 | 116 | 0 |
| Mode M9 | |||
|---|---|---|---|
| Quadrant | BADHDUFLAG | Total packets | Discarded packets |
| A | 0 | 8 | 0 |
| B | 0 | 8 | 0 |
| C | 0 | 8 | 0 |
| D | 0 | 8 | 0 |
| Mode M0 | |||
|---|---|---|---|
| Quadrant | BADHDUFLAG | Total packets | Discarded packets |
| A | 0 | 13055 | 7 |
| B | 0 | 14070 | 3 |
| C | 0 | 11635 | 7 |
| D | 0 | 12566 | 3 |
| Quadrant | Total seconds | Saturated seconds | Saturation percentage |
|---|---|---|---|
| A | 5742 | 29 | 0.505051% |
| B | 5743 | 187 | 3.256138% |
| C | 5741 | 6 | 0.104511% |
| D | 5743 | 46 | 0.800975% |
Noise dominated data is calculated using 1-second bins in cleaned event files. If a bin has >2000 counts, and if more than 50% of those come from <1% of pixels, then it is considered to be noise-dominated and hence unusable.
| Quadrant | # 1 sec bins | Bins with >0 counts | Bins with >2000 counts | High rate bins dominated by noise | Noise dominated (total time) | Noise dominated (detector-on time) | Marked lightcurve |
|---|---|---|---|---|---|---|---|
| A | 6484 | 5745 | 0 | 0 | 0.00% | 0.00% | 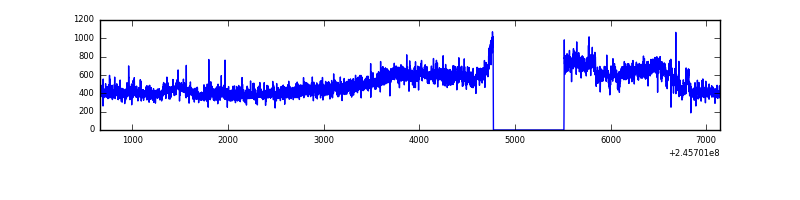 |
| B | 6484 | 5744 | 77 | 77 | 1.19% | 1.34% | 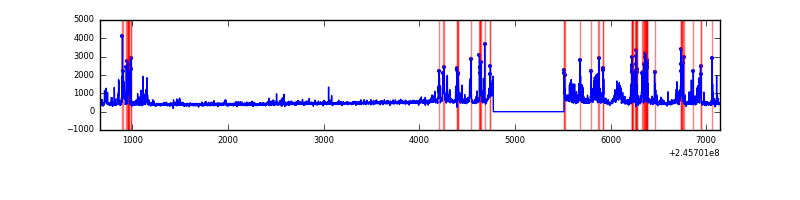 |
| C | 6484 | 5745 | 0 | 0 | 0.00% | 0.00% | 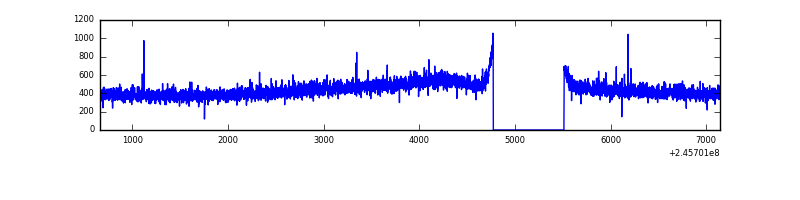 |
| D | 6484 | 5745 | 30 | 30 | 0.46% | 0.52% | 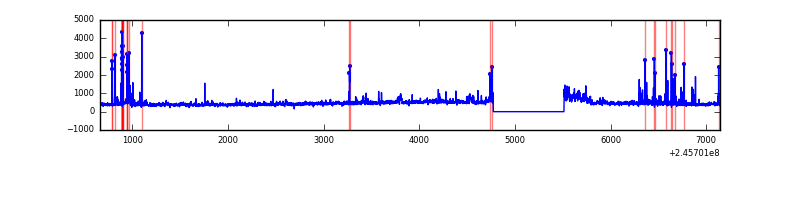 |
Top three noisy pixels from each quadrant. If the there are fewer than three noisy pixels in the level2.evt file, extra rows are filled as -1
| Pixel properties | Quadrant properties | ||||||
|---|---|---|---|---|---|---|---|
| Quadrant | DetID | PixID | Counts | Sigma | Mean | Median | Sigma |
| A | 15 | 174 | 389873 | 2868.21 | 657 | 643 | 135.7 |
| A | 11 | 29 | 9595 | 65.97 | 657 | 643 | 135.7 |
| A | 0 | 226 | 5926 | 38.93 | 657 | 643 | 135.7 |
| B | 4 | 239 | 759844 | 5989.88 | 655 | 637 | 126.7 |
| B | 0 | 214 | 33398 | 258.47 | 655 | 637 | 126.7 |
| B | 15 | 204 | 24127 | 185.33 | 655 | 637 | 126.7 |
| C | 8 | 128 | 8152 | 50.3 | 638 | 641 | 149.3 |
| C | 13 | 61 | 4762 | 27.6 | 638 | 641 | 149.3 |
| C | 8 | 112 | 4552 | 26.19 | 638 | 641 | 149.3 |
| D | 11 | 129 | 188147 | 1240.07 | 631 | 614 | 151.2 |
| D | 10 | 253 | 100668 | 661.61 | 631 | 614 | 151.2 |
| D | 1 | 52 | 38833 | 252.72 | 631 | 614 | 151.2 |
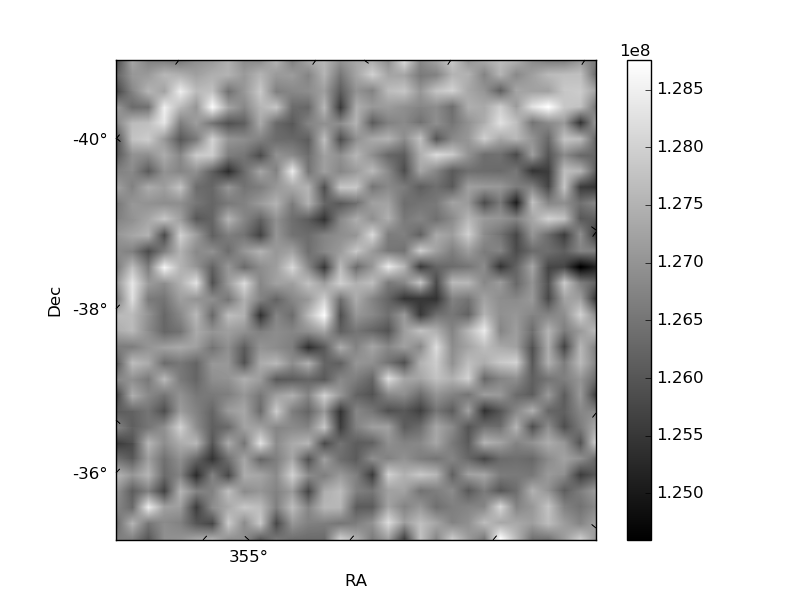
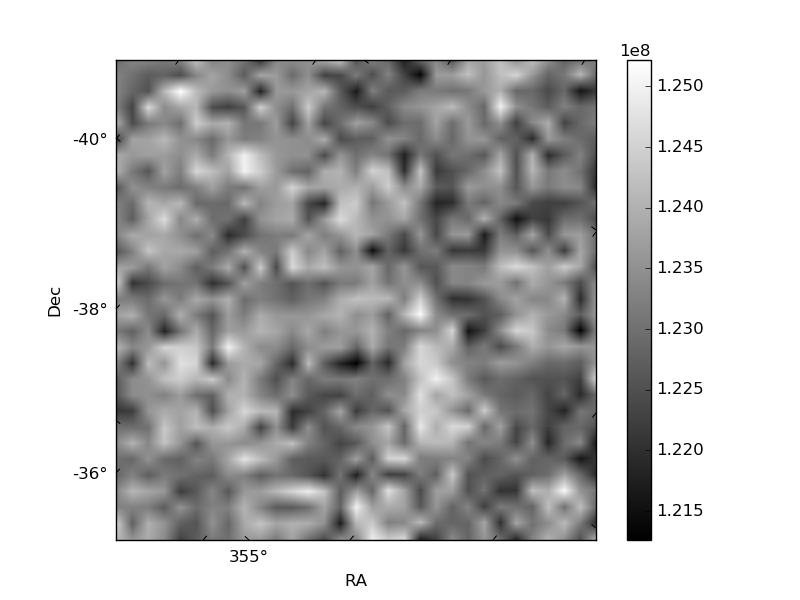
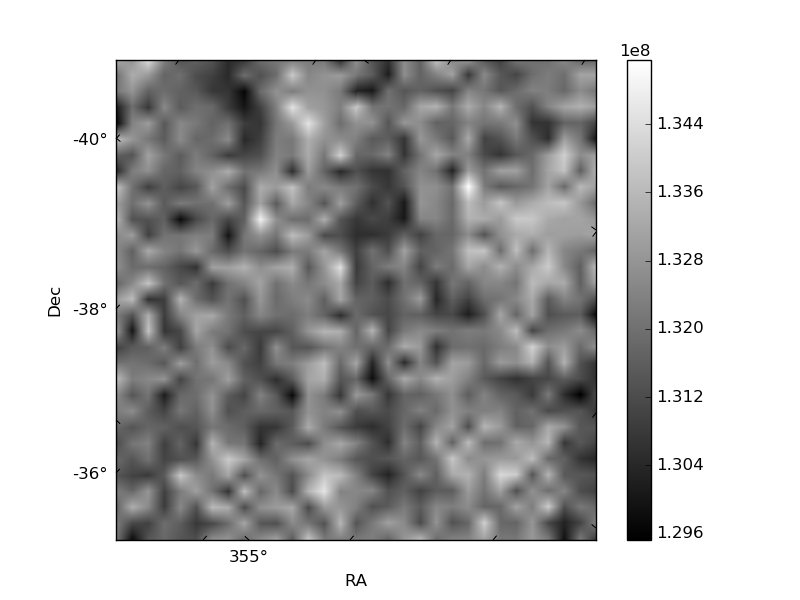
Histogram calculated using DETX and DETY for each event in the final _common_clean file
| Quadrant A | 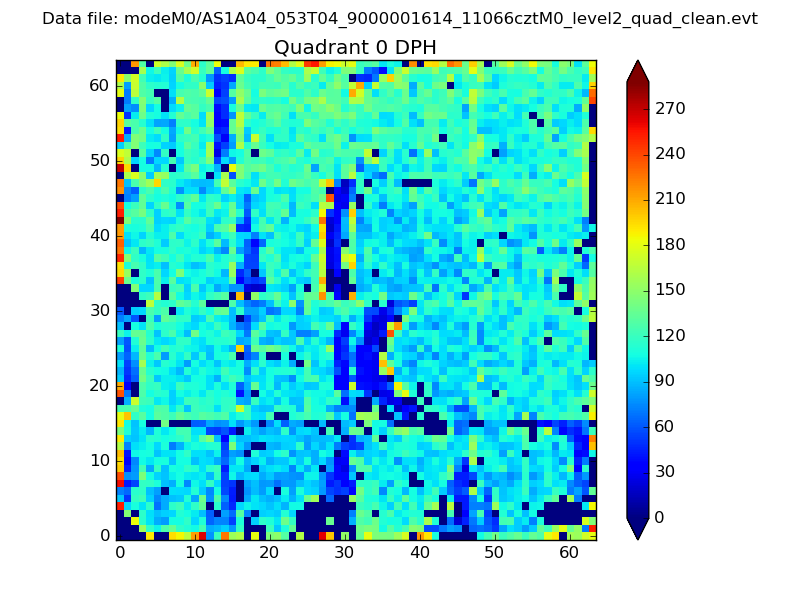 |
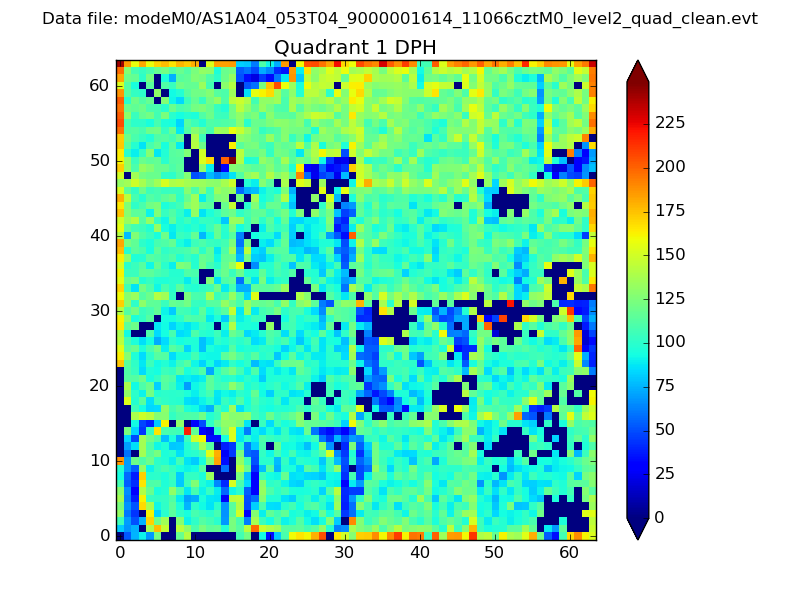 |
Quadrant B |
|---|---|---|---|
| Quadrant D | 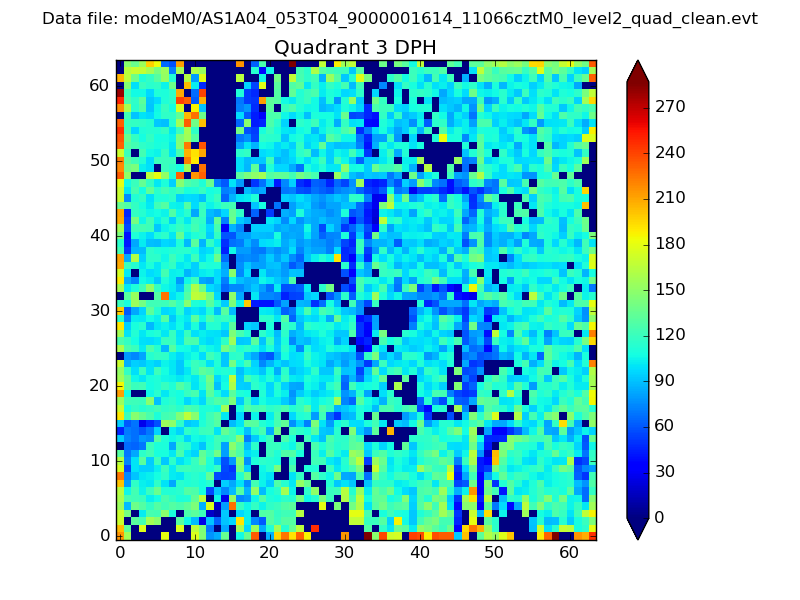 |
 |
Quadrant C |
| Plot type | Count rate plots | Images |
|---|---|---|
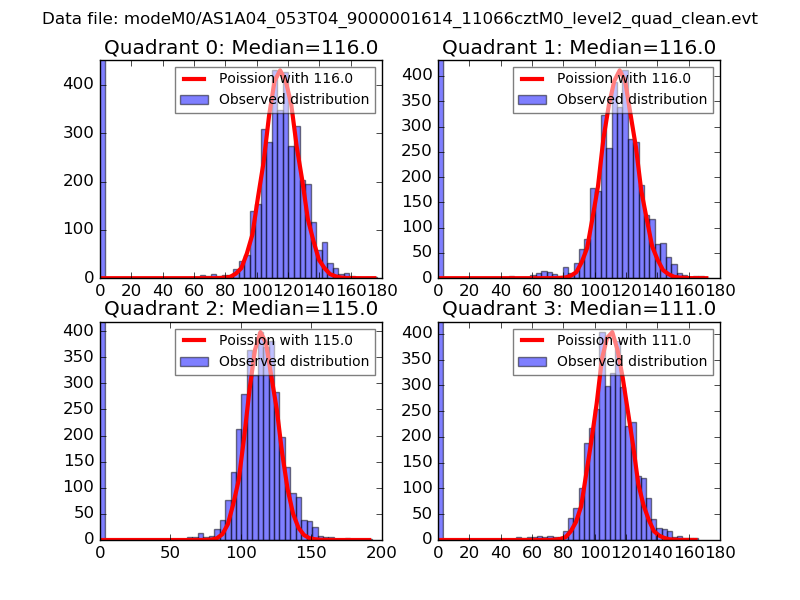
| Comparison with Poisson distribution Blue bars denote a histogram of data divided into 1 sec bins. Red curve is a Poisson curve with rate = median count rate of data. |
 |
 |
| Quadrant-wise count rates Data is divided into 100 sec bins |
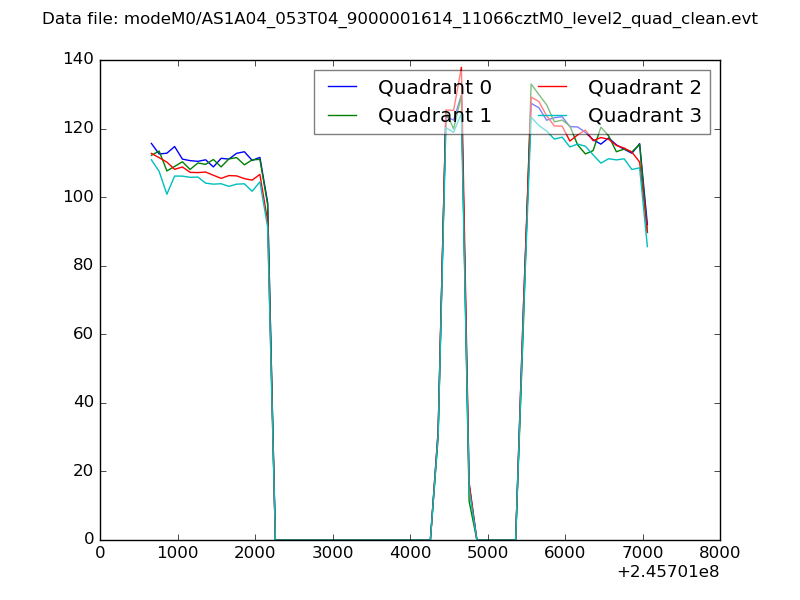 |
|
| Module-wise count rates for Quadrant A Data is divided into 100 sec bins |
 |
 |
| Module-wise count rates for Quadrant B Data is divided into 100 sec bins |
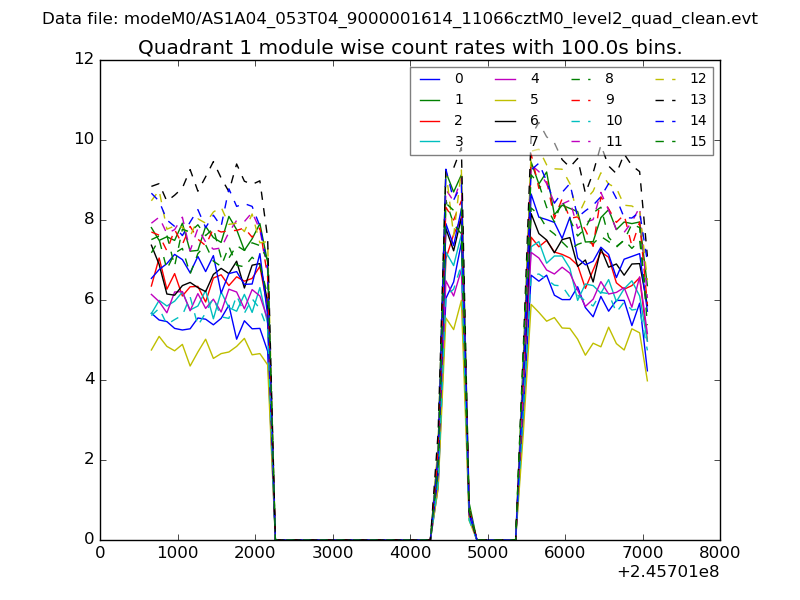 |
 |
| Module-wise count rates for Quadrant C Data is divided into 100 sec bins |
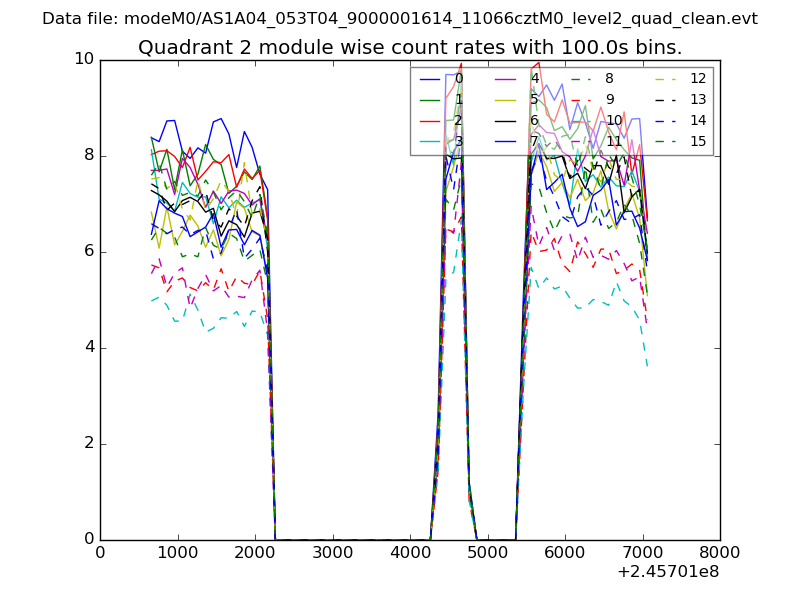 |
 |
| Module-wise count rates for Quadrant D Data is divided into 100 sec bins |
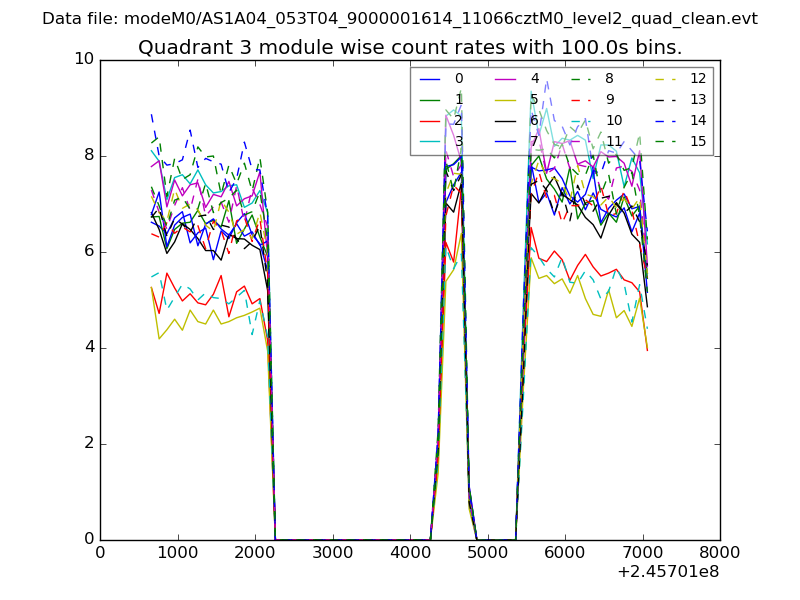 |
 |
| Parameter | Plot |
|---|---|
| CZT HV Monitor | 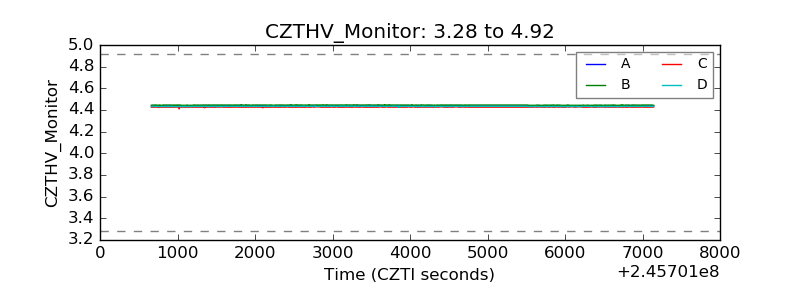 |
| D_VDD | 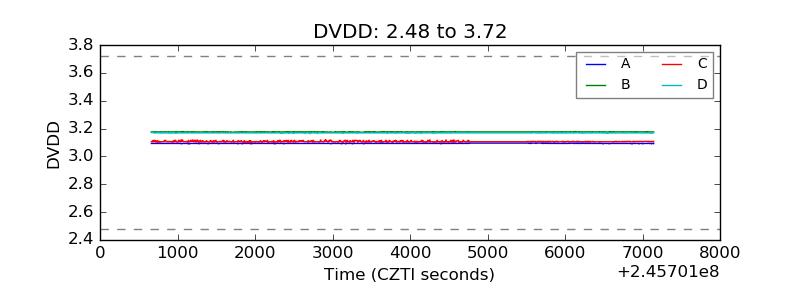 |
| Temperature 1 | 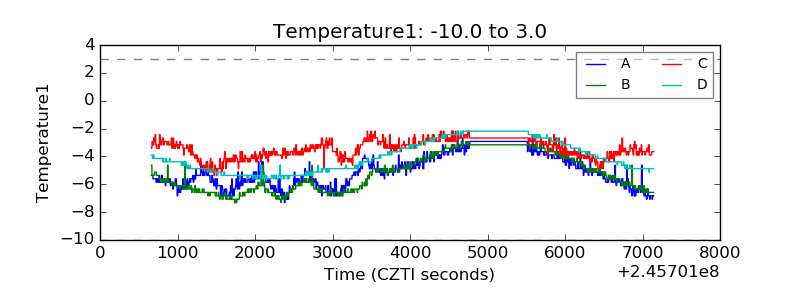 |
| Veto HV Monitor |  |
| Veto LLD | 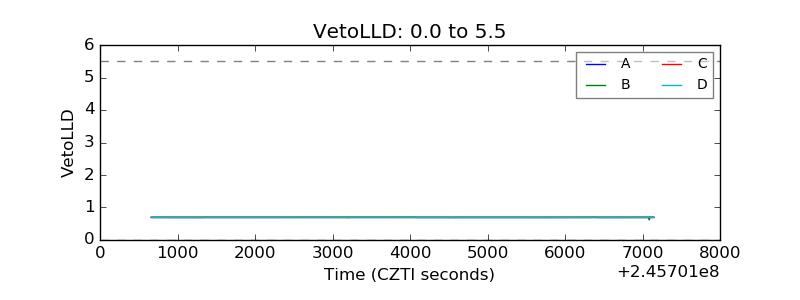 |
| Alpha Counter | 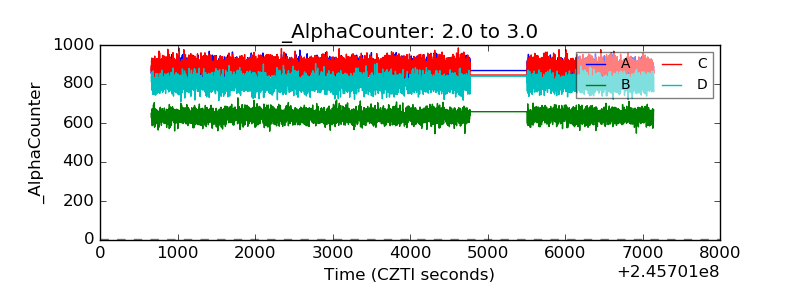 |
| _CPM_Rate | 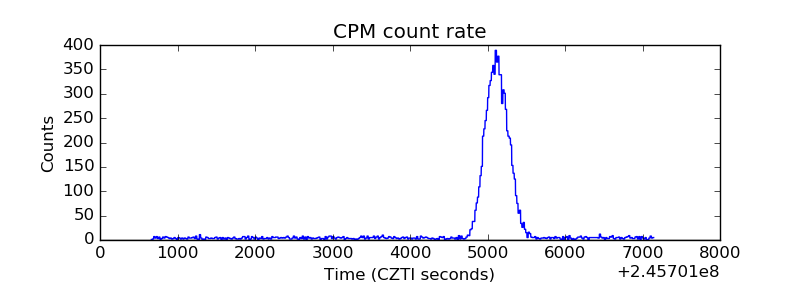 |
| CZT Counter |  |
| +2.5 Volts monitor |  |
| +5 Volts monitor |  |
| _ROLL_ROT | 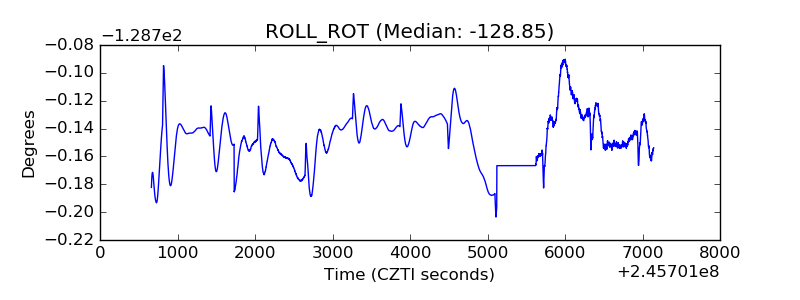 |
| _Roll_DEC | 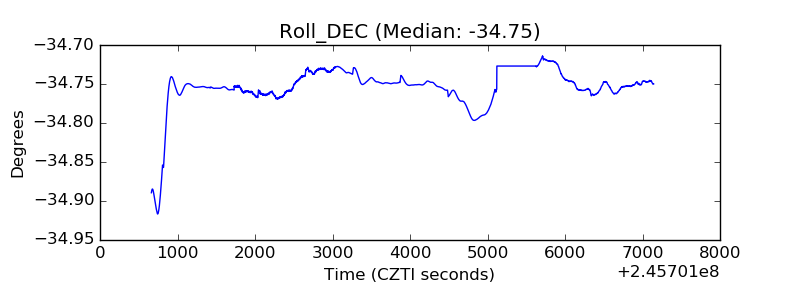 |
| _Roll_RA |  |
| Veto Counter | 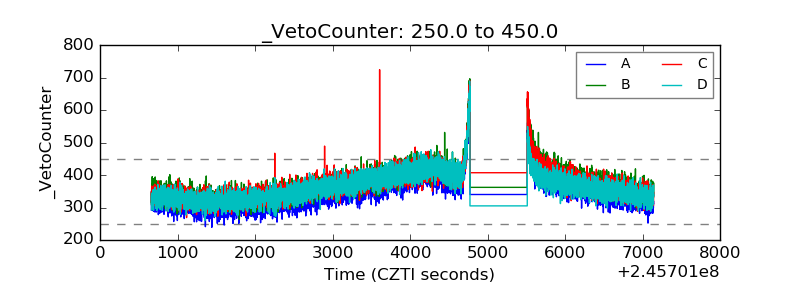 |