| Param | Original file | Final file |
|---|---|---|
| Filename | modeM0/AS1A04_053T04_9000001614_11067cztM0_level2.evt | modeM0/AS1A04_053T04_9000001614_11067cztM0_level2_quad_clean.evt |
| Size (bytes) | 194,935,680 | 45,501,120 |
| Size | 185.9 MB | 43.4 MB |
| Events in quadrant A | 1,415,595 | 301,052 |
| Events in quadrant B | 1,719,213 | 299,908 |
| Events in quadrant C | 1,112,816 | 295,708 |
| Events in quadrant D | 1,466,906 | 284,232 |
| Mode SS | |||
|---|---|---|---|
| Quadrant | BADHDUFLAG | Total packets | Discarded packets |
| A | 0 | 54 | 0 |
| B | 0 | 54 | 0 |
| C | 0 | 54 | 0 |
| D | 0 | 54 | 0 |
| Mode M9 | |||
|---|---|---|---|
| Quadrant | BADHDUFLAG | Total packets | Discarded packets |
| A | 0 | 3 | 0 |
| B | 0 | 3 | 0 |
| C | 0 | 3 | 0 |
| D | 0 | 4 | 0 |
| Mode M0 | |||
|---|---|---|---|
| Quadrant | BADHDUFLAG | Total packets | Discarded packets |
| A | 0 | 6432 | 1 |
| B | 0 | 7066 | 1 |
| C | 0 | 5538 | 1 |
| D | 0 | 6406 | 1 |
| Quadrant | Total seconds | Saturated seconds | Saturation percentage |
|---|---|---|---|
| A | 2753 | 5 | 0.181620% |
| B | 2753 | 95 | 3.450781% |
| C | 2753 | 3 | 0.108972% |
| D | 2753 | 12 | 0.435888% |
Noise dominated data is calculated using 1-second bins in cleaned event files. If a bin has >2000 counts, and if more than 50% of those come from <1% of pixels, then it is considered to be noise-dominated and hence unusable.
| Quadrant | # 1 sec bins | Bins with >0 counts | Bins with >2000 counts | High rate bins dominated by noise | Noise dominated (total time) | Noise dominated (detector-on time) | Marked lightcurve |
|---|---|---|---|---|---|---|---|
| A | 2753 | 2753 | 0 | 0 | 0.00% | 0.00% | 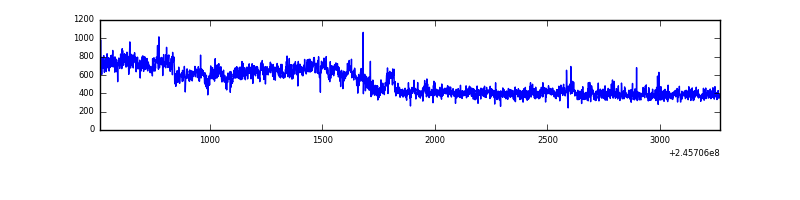 |
| B | 2753 | 2753 | 52 | 52 | 1.89% | 1.89% | 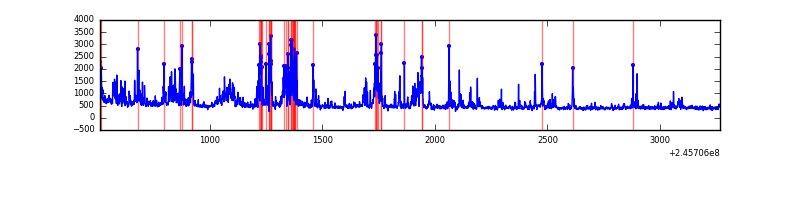 |
| C | 2753 | 2753 | 0 | 0 | 0.00% | 0.00% | 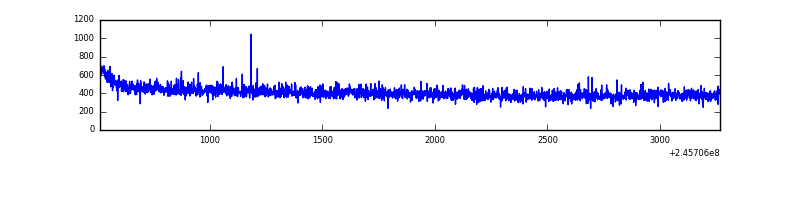 |
| D | 2753 | 2753 | 16 | 16 | 0.58% | 0.58% | 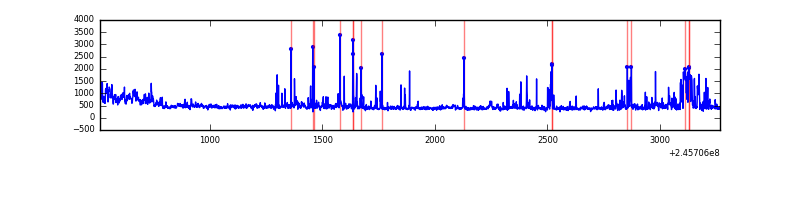 |
Top three noisy pixels from each quadrant. If the there are fewer than three noisy pixels in the level2.evt file, extra rows are filled as -1
| Pixel properties | Quadrant properties | ||||||
|---|---|---|---|---|---|---|---|
| Quadrant | DetID | PixID | Counts | Sigma | Mean | Median | Sigma |
| A | 15 | 174 | 270305 | 4322.01 | 296 | 290 | 62.5 |
| A | 11 | 29 | 4543 | 68.08 | 296 | 290 | 62.5 |
| A | 0 | 226 | 2642 | 37.65 | 296 | 290 | 62.5 |
| B | 4 | 239 | 496979 | 8443.05 | 296 | 289 | 58.8 |
| B | 3 | 189 | 26235 | 441.05 | 296 | 289 | 58.8 |
| B | 15 | 204 | 18306 | 306.26 | 296 | 289 | 58.8 |
| C | 13 | 61 | 2131 | 27.35 | 285 | 287 | 67.4 |
| C | 8 | 222 | 799 | 7.59 | 285 | 287 | 67.4 |
| C | 7 | 159 | 702 | 6.16 | 285 | 287 | 67.4 |
| D | 11 | 129 | 133614 | 1944.95 | 281 | 274 | 68.6 |
| D | 1 | 52 | 122832 | 1787.68 | 281 | 274 | 68.6 |
| D | 13 | 249 | 48705 | 706.43 | 281 | 274 | 68.6 |
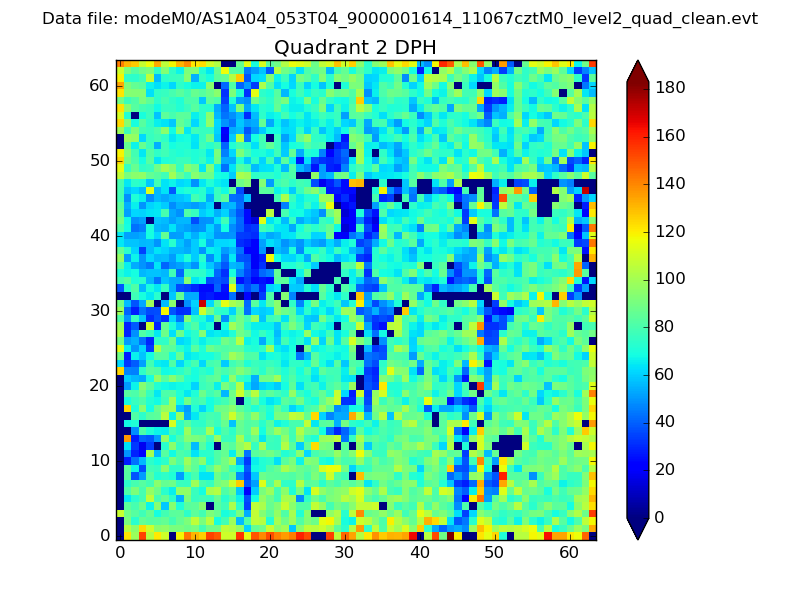
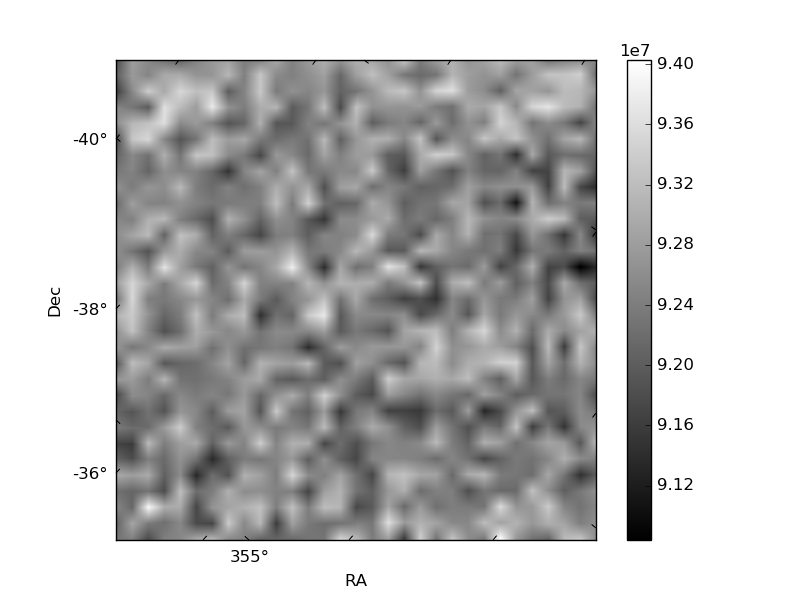
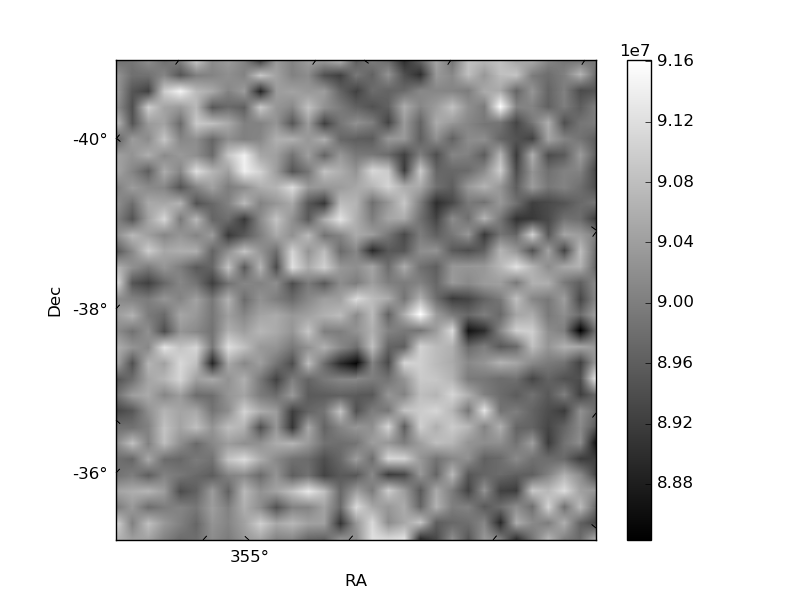
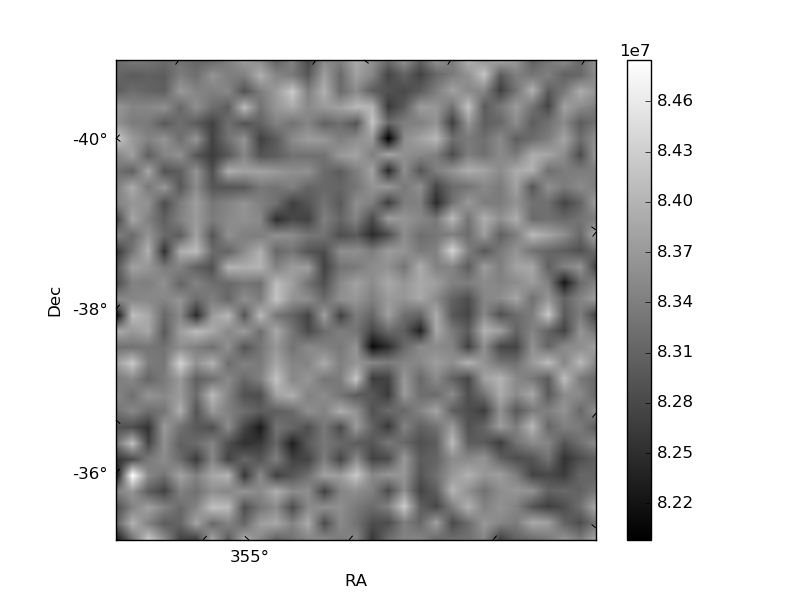
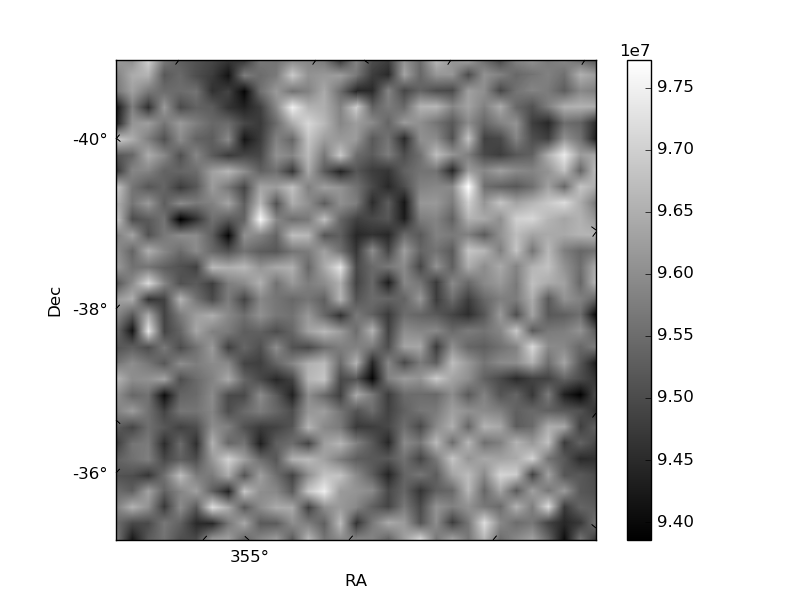
Histogram calculated using DETX and DETY for each event in the final _common_clean file
| Quadrant A | 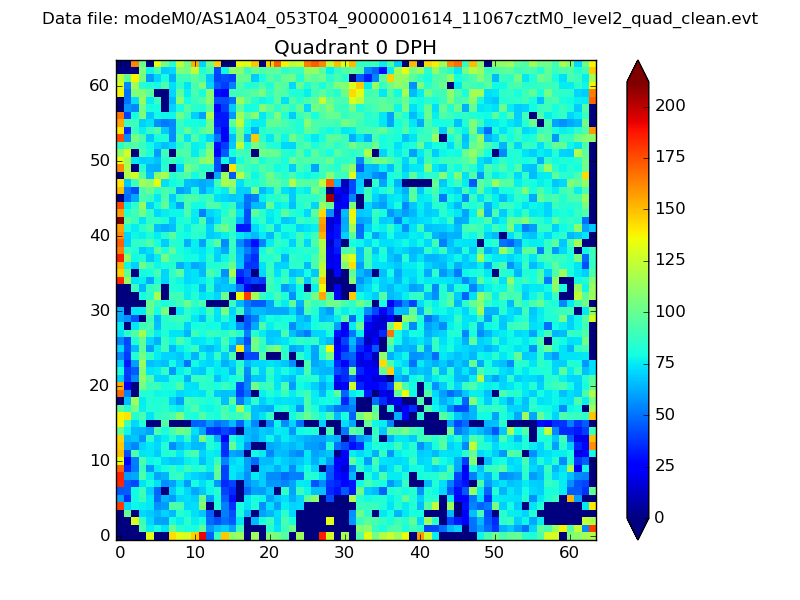 |
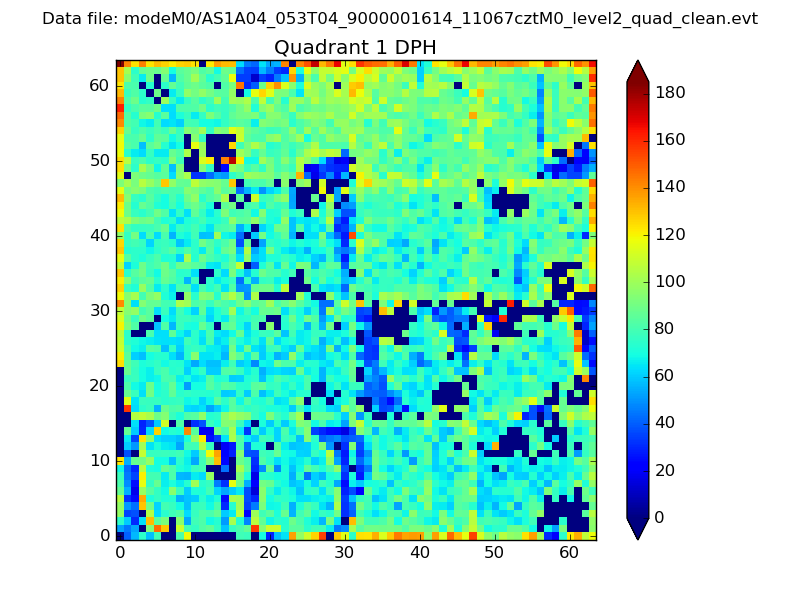 |
Quadrant B |
|---|---|---|---|
| Quadrant D | 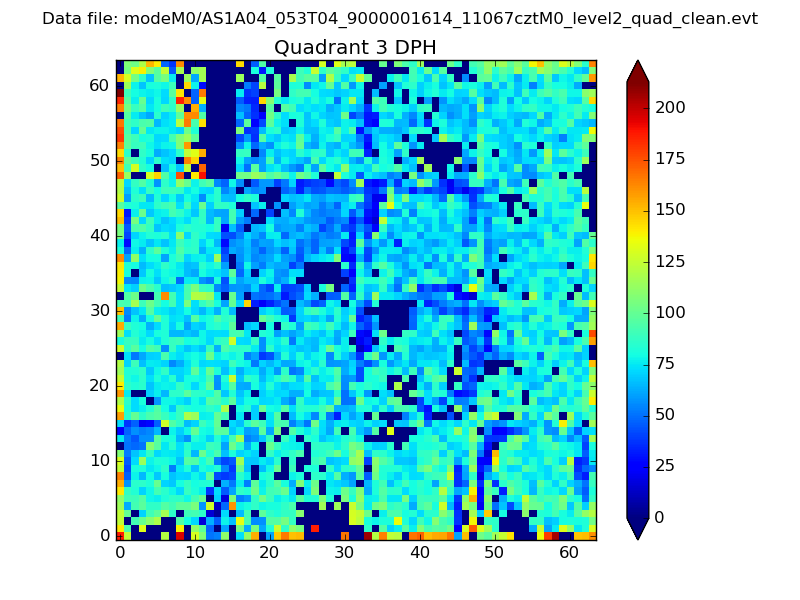 |
 |
Quadrant C |
| Plot type | Count rate plots | Images |
|---|---|---|
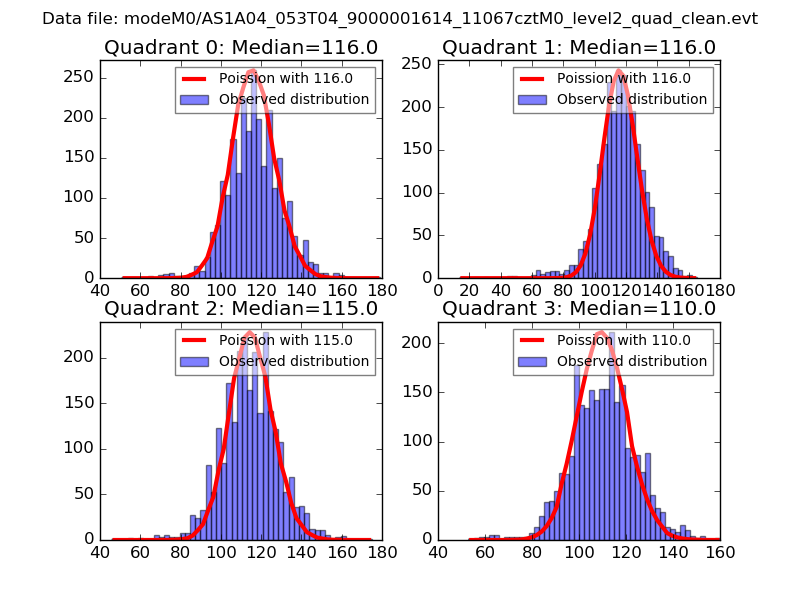
| Comparison with Poisson distribution Blue bars denote a histogram of data divided into 1 sec bins. Red curve is a Poisson curve with rate = median count rate of data. |
 |
 |
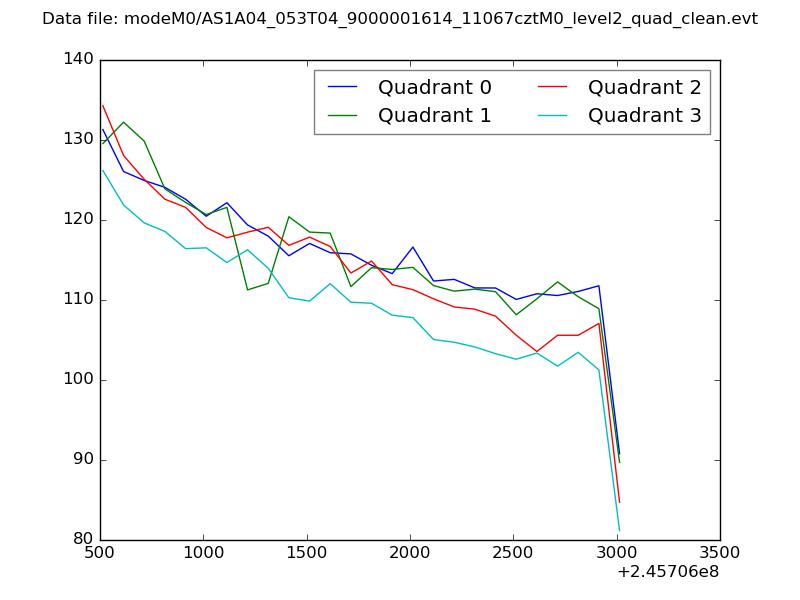
| Quadrant-wise count rates Data is divided into 100 sec bins |
 |
|
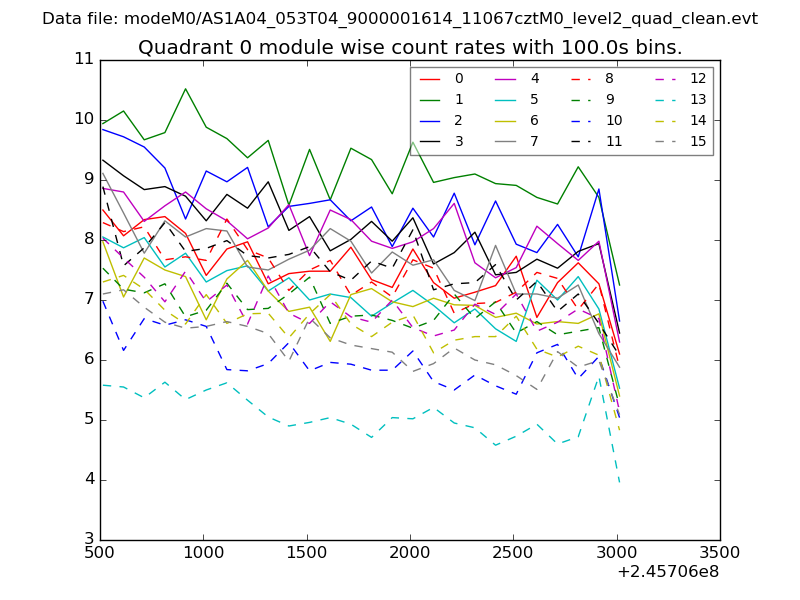
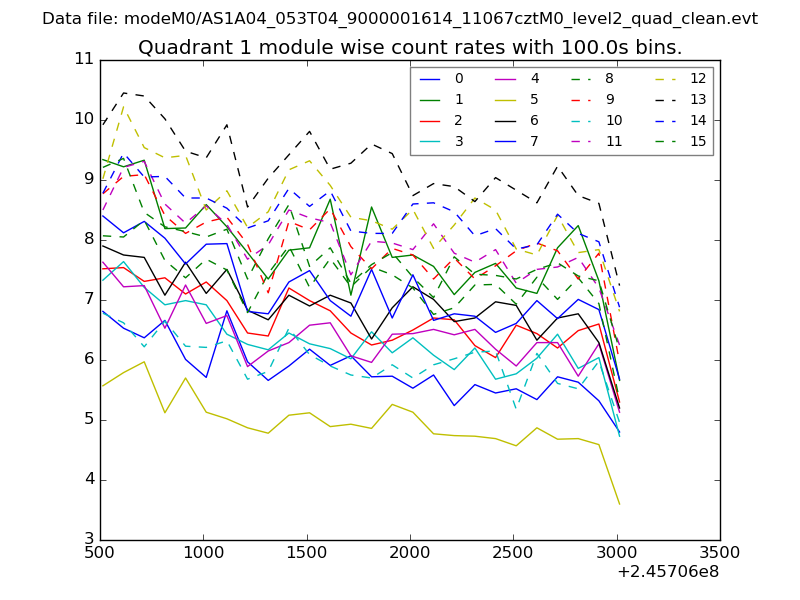
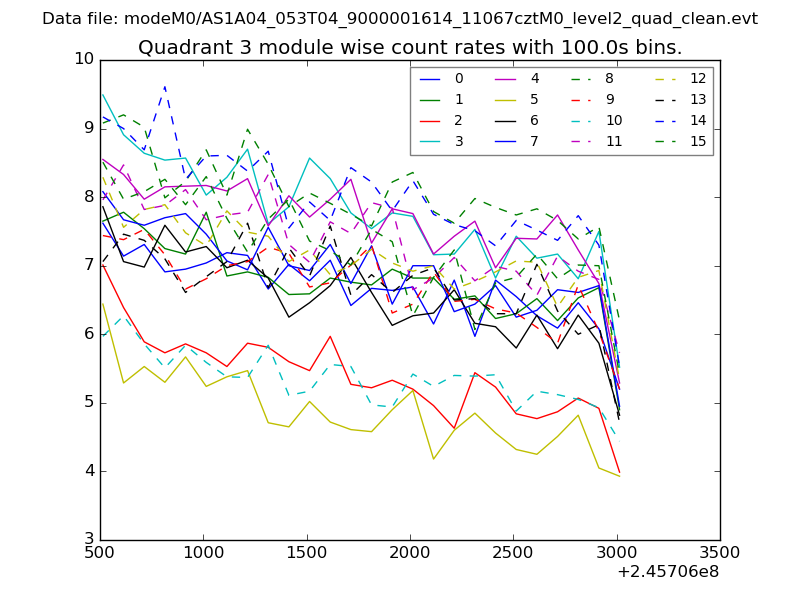
| Module-wise count rates for Quadrant A Data is divided into 100 sec bins |
 |
 |
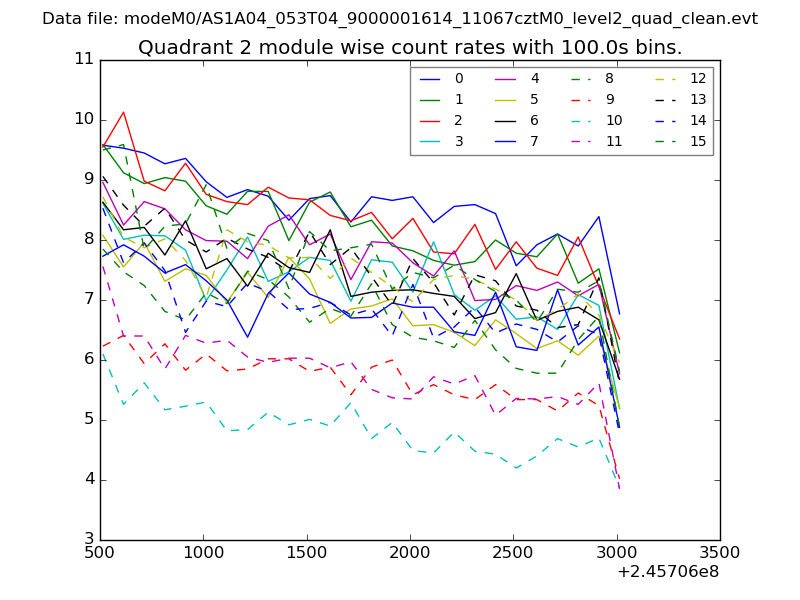
| Module-wise count rates for Quadrant B Data is divided into 100 sec bins |
 |
 |
| Module-wise count rates for Quadrant C Data is divided into 100 sec bins |
 |
 |
| Module-wise count rates for Quadrant D Data is divided into 100 sec bins |
 |
 |
| Parameter | Plot |
|---|---|
| CZT HV Monitor |  |
| D_VDD | 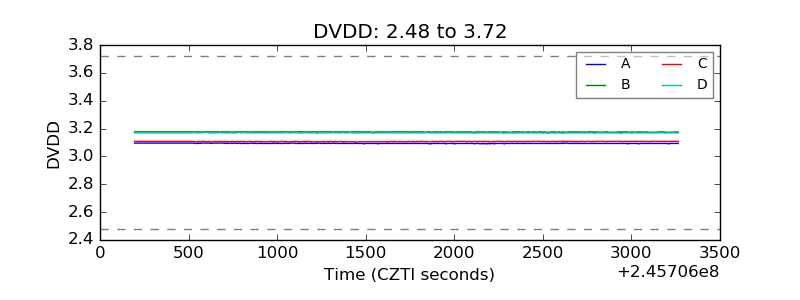 |
| Temperature 1 | 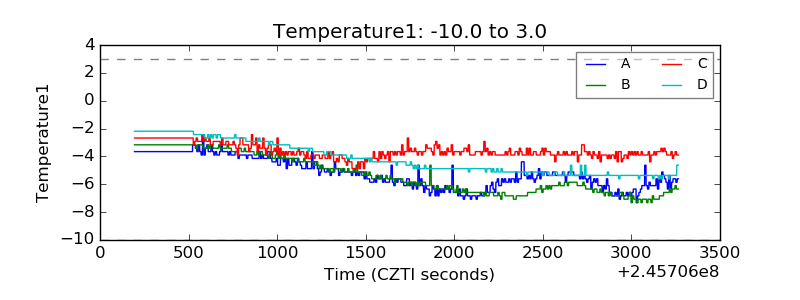 |
| Veto HV Monitor | 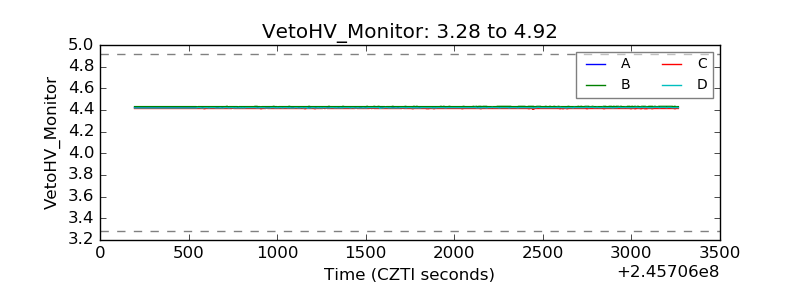 |
| Veto LLD | 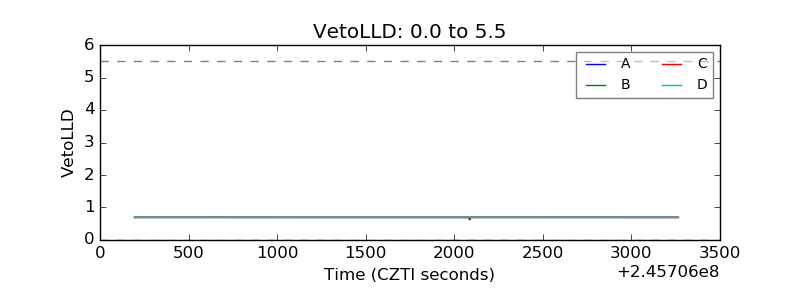 |
| Alpha Counter | 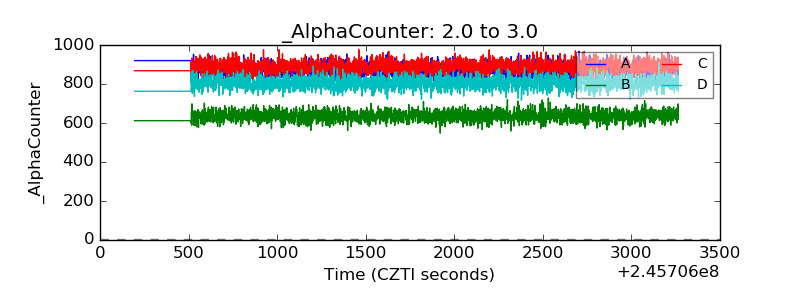 |
| _CPM_Rate | 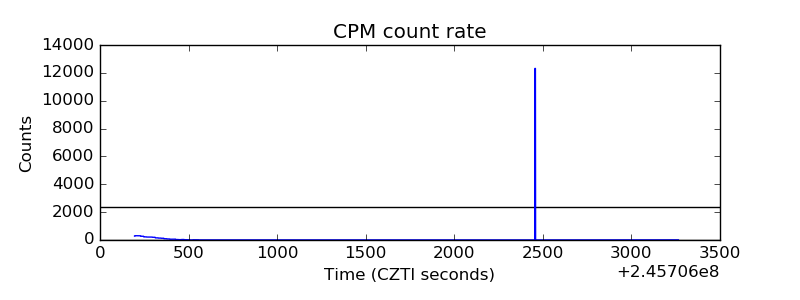 |
| CZT Counter | 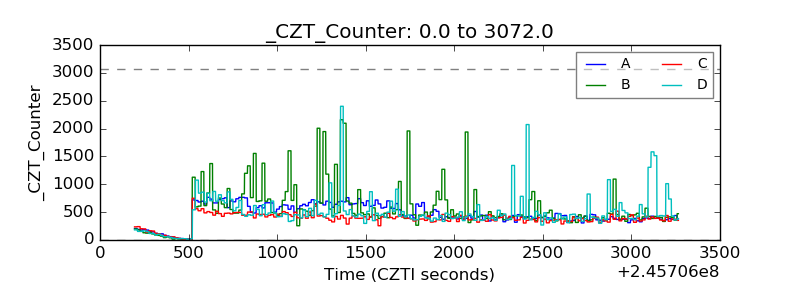 |
| +2.5 Volts monitor |  |
| +5 Volts monitor |  |
| _ROLL_ROT | 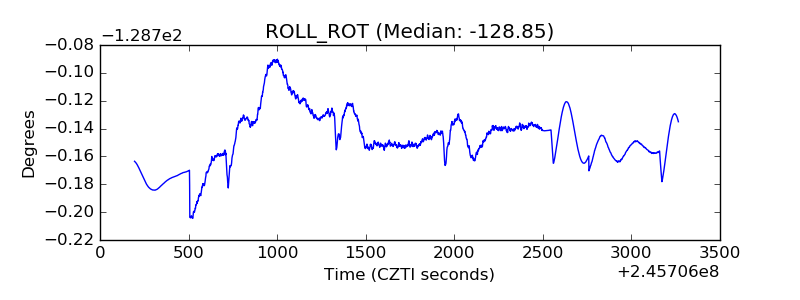 |
| _Roll_DEC |  |
| _Roll_RA | 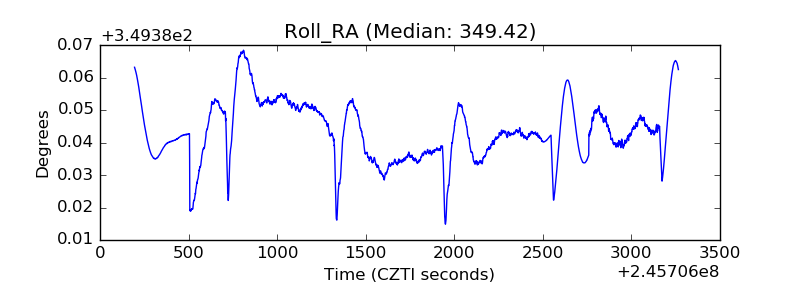 |
| Veto Counter | 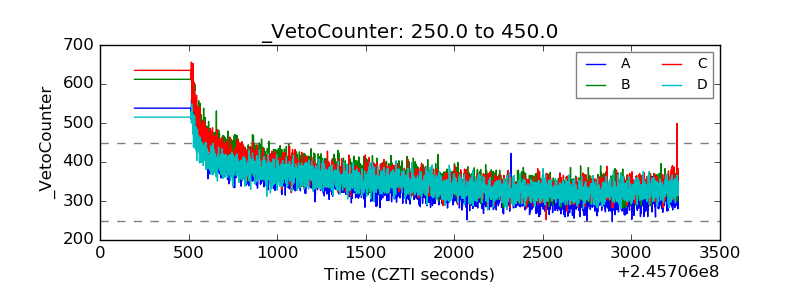 |