| Param | Original file | Final file |
|---|---|---|
| Filename | modeM0/AS1G08_075T01_9000001616cztM0_level2.fits | modeM0/AS1G08_075T01_9000001616cztM0_level2_quad_clean.evt |
| Size (bytes) | 373,659,840 | 341,199,360 |
| Size | 356.3 MB | 325.4 MB |
| Events in quadrant A | 2,305,946 | 2,027,854 |
| Events in quadrant B | 2,198,600 | 1,977,843 |
| Events in quadrant C | 2,263,828 | 1,946,681 |
| Events in quadrant D | 1,913,042 | 1,746,517 |
| Mode SS | |||
|---|---|---|---|
| Quadrant | BADHDUFLAG | Total packets | Discarded packets |
| A | 0 | 784 | 0 |
| B | 0 | 784 | 0 |
| C | 0 | 784 | 0 |
| D | 0 | 784 | 0 |
| Mode M9 | |||
|---|---|---|---|
| Quadrant | BADHDUFLAG | Total packets | Discarded packets |
| A | 0 | 89 | 0 |
| B | 0 | 89 | 0 |
| C | 0 | 89 | 0 |
| D | 0 | 89 | 0 |
| Mode M0 | |||
|---|---|---|---|
| Quadrant | BADHDUFLAG | Total packets | Discarded packets |
| A | 0 | 90235 | 0 |
| B | 0 | 101597 | 0 |
| C | 0 | 79033 | 0 |
| D | 0 | 101943 | 0 |
| Quadrant | Total seconds | Saturated seconds | Saturation percentage |
|---|---|---|---|
| A | 38350 | 614 | 1.601043% |
| B | 38350 | 2106 | 5.491525% |
| C | 38350 | 325 | 0.847458% |
| D | 38350 | 1684 | 4.391134% |
Noise dominated data is calculated using 1-second bins in cleaned event files. If a bin has >2000 counts, and if more than 50% of those come from <1% of pixels, then it is considered to be noise-dominated and hence unusable.
| Quadrant | # 1 sec bins | Bins with >0 counts | Bins with >2000 counts | High rate bins dominated by noise | Noise dominated (total time) | Noise dominated (detector-on time) | Marked lightcurve |
|---|---|---|---|---|---|---|---|
| A | 47260 | 38346 | 0 | 0 | 0.00% | 0.00% | 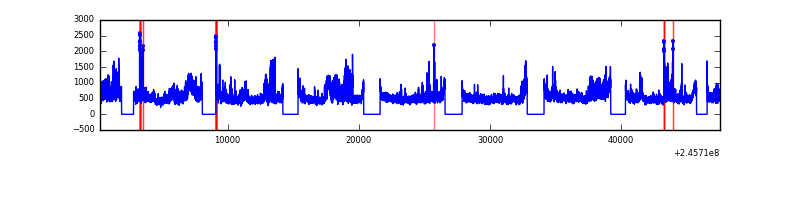 |
| B | 47260 | 38347 | 0 | 0 | 0.00% | 0.00% | 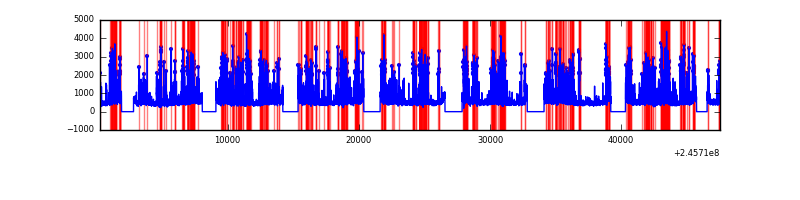 |
| C | 47260 | 38350 | 0 | 0 | 0.00% | 0.00% | 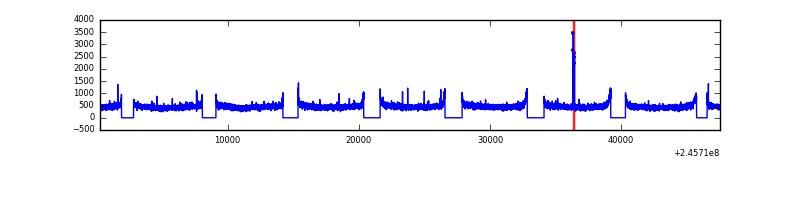 |
| D | 47260 | 38317 | 0 | 0 | 0.00% | 0.00% | 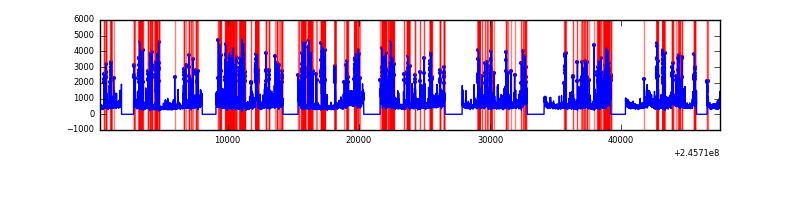 |
Top three noisy pixels from each quadrant. If the there are fewer than three noisy pixels in the level2.evt file, extra rows are filled as -1
| Pixel properties | Quadrant properties | ||||||
|---|---|---|---|---|---|---|---|
| Quadrant | DetID | PixID | Counts | Sigma | Mean | Median | Sigma |
| A | 0 | 29 | 2216 | 11.01 | 599 | 564 | 150.0 |
| A | 7 | 110 | 1846 | 8.55 | 599 | 564 | 150.0 |
| A | 9 | 19 | 1697 | 7.55 | 599 | 564 | 150.0 |
| B | 2 | 9 | 1906 | 11.59 | 580 | 554 | 116.7 |
| B | 5 | 128 | 1474 | 7.89 | 580 | 554 | 116.7 |
| B | 2 | 8 | 1464 | 7.8 | 580 | 554 | 116.7 |
| C | 1 | 80 | 1730 | 7.57 | 597 | 558 | 154.9 |
| C | 1 | 81 | 1675 | 7.21 | 597 | 558 | 154.9 |
| C | 12 | 241 | 1521 | 6.22 | 597 | 558 | 154.9 |
| D | 6 | 231 | 1395 | 6.12 | 545 | 495 | 147.2 |
| D | 3 | 31 | 1359 | 5.87 | 545 | 495 | 147.2 |
| D | 6 | 67 | 1349 | 5.8 | 545 | 495 | 147.2 |
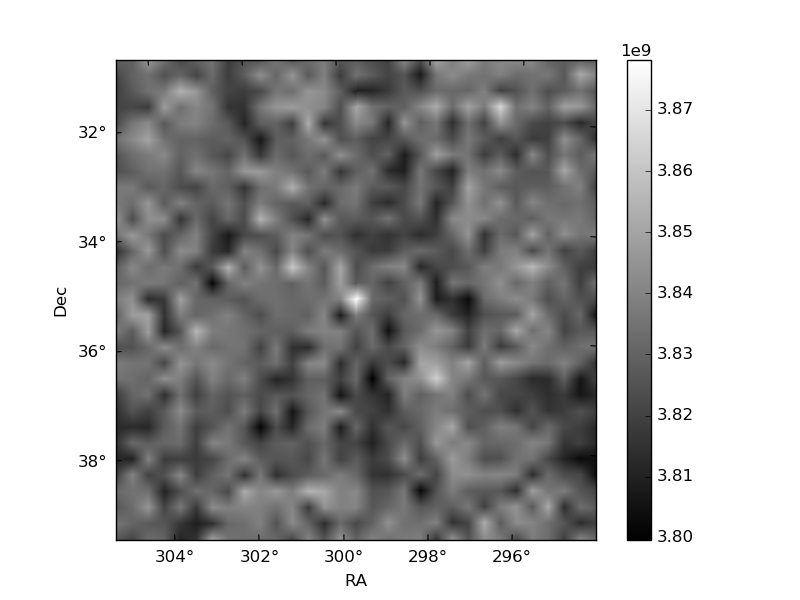
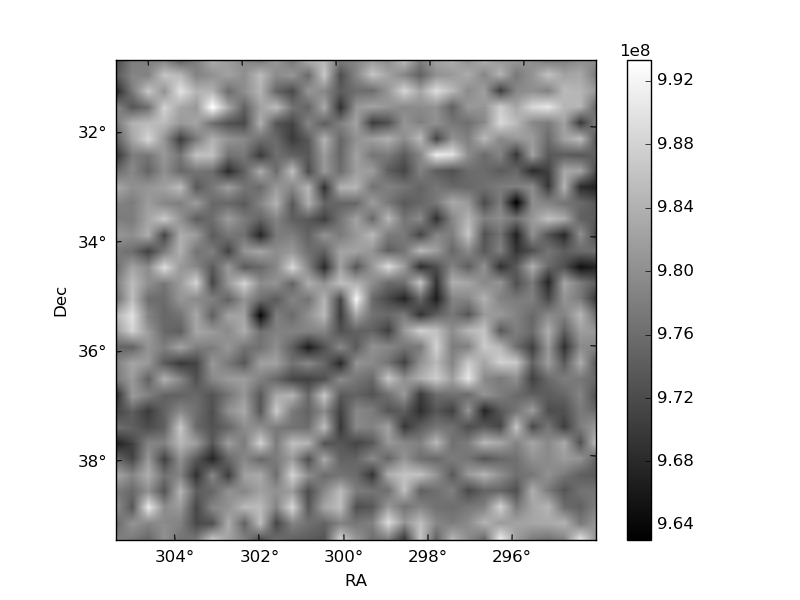
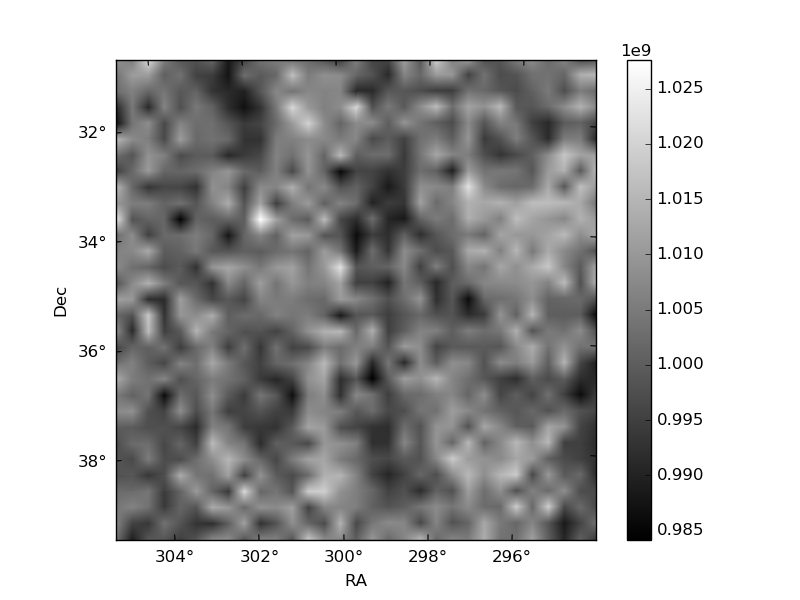
Histogram calculated using DETX and DETY for each event in the final _common_clean file
| Quadrant A | 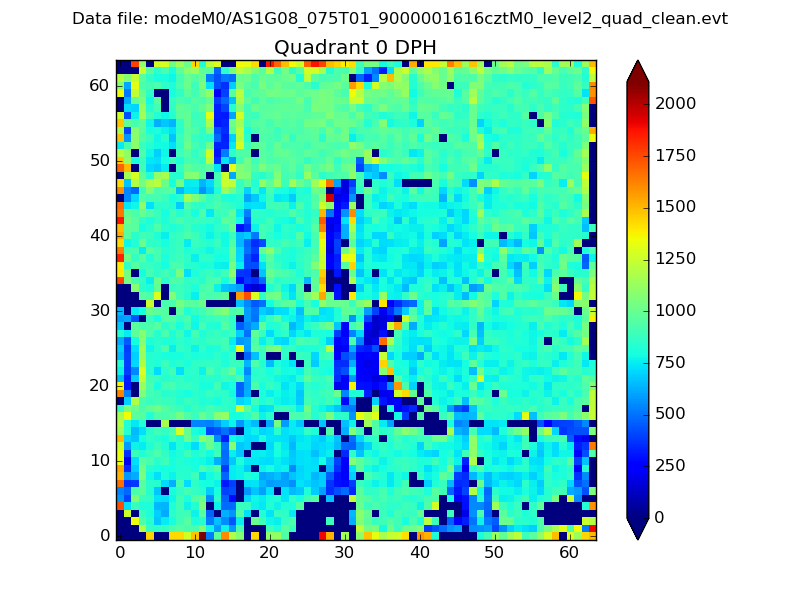 |
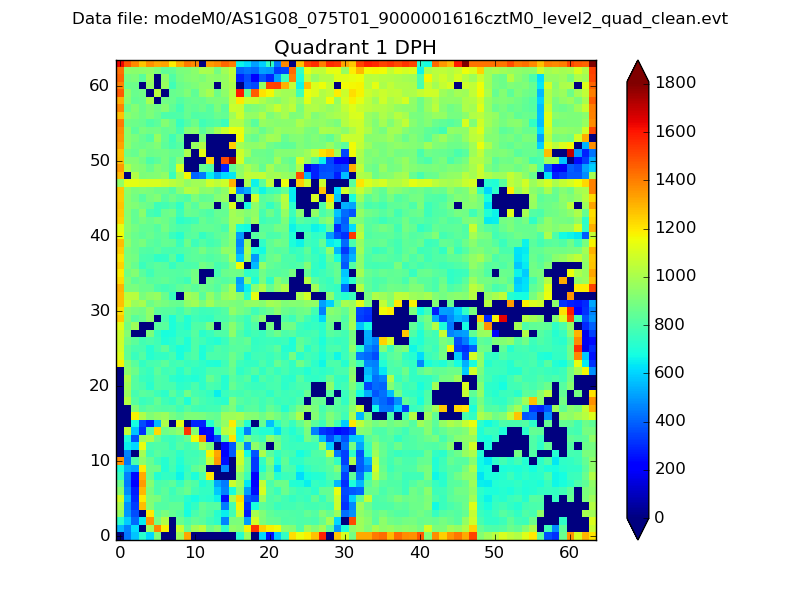 |
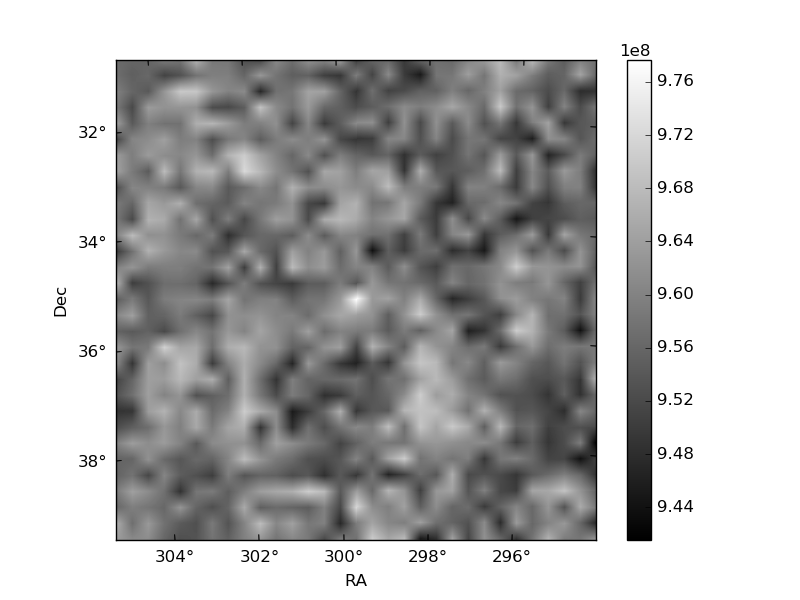
Quadrant B |
|---|---|---|---|
| Quadrant D | 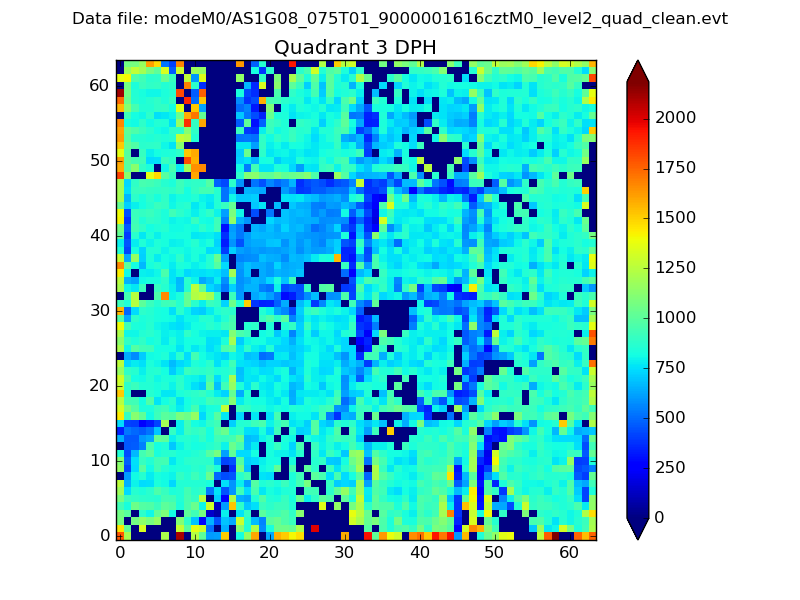 |
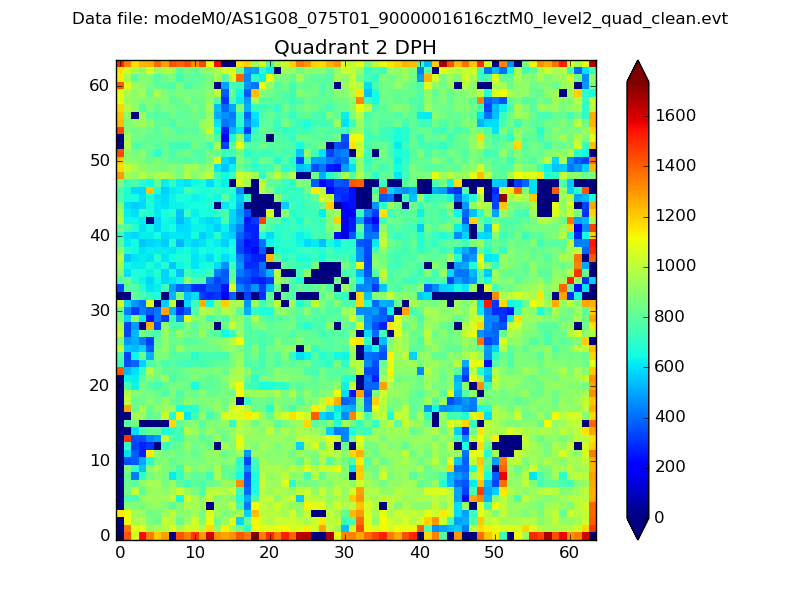 |
Quadrant C |
| Plot type | Count rate plots | Images |
|---|---|---|
| Comparison with Poisson distribution Blue bars denote a histogram of data divided into 1 sec bins. Red curve is a Poisson curve with rate = median count rate of data. |
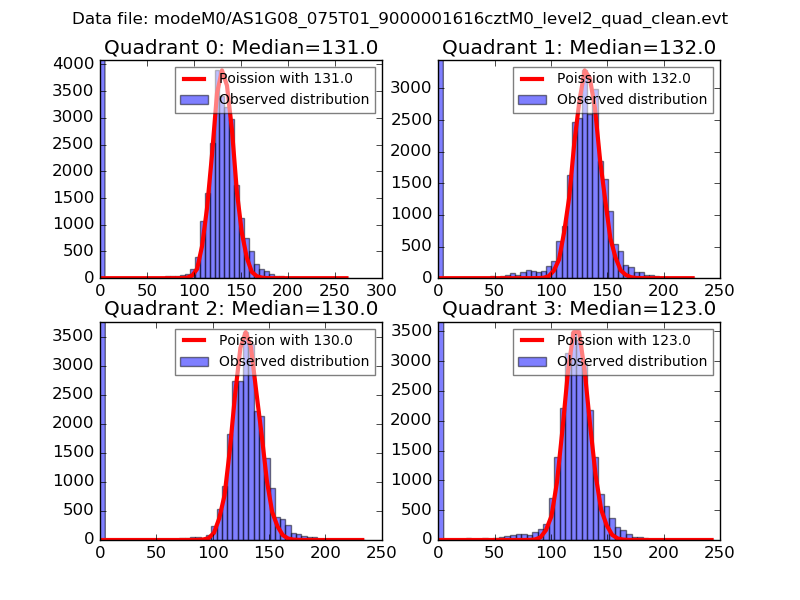 |
 |
| Quadrant-wise count rates Data is divided into 100 sec bins |
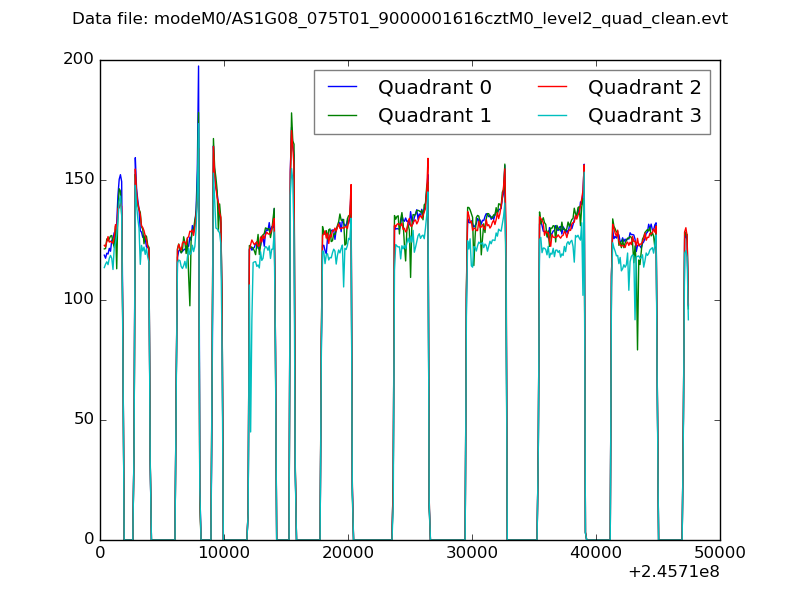 |
|
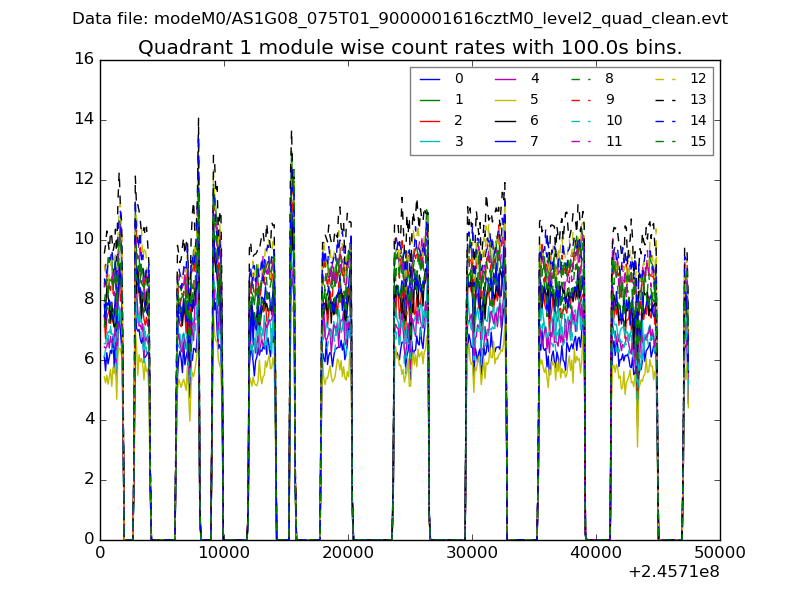
| Module-wise count rates for Quadrant A Data is divided into 100 sec bins |
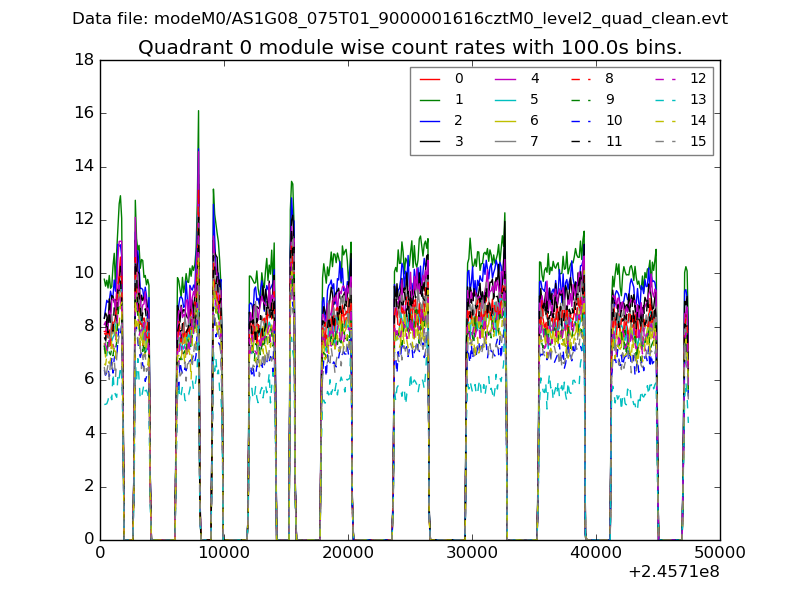 |
 |
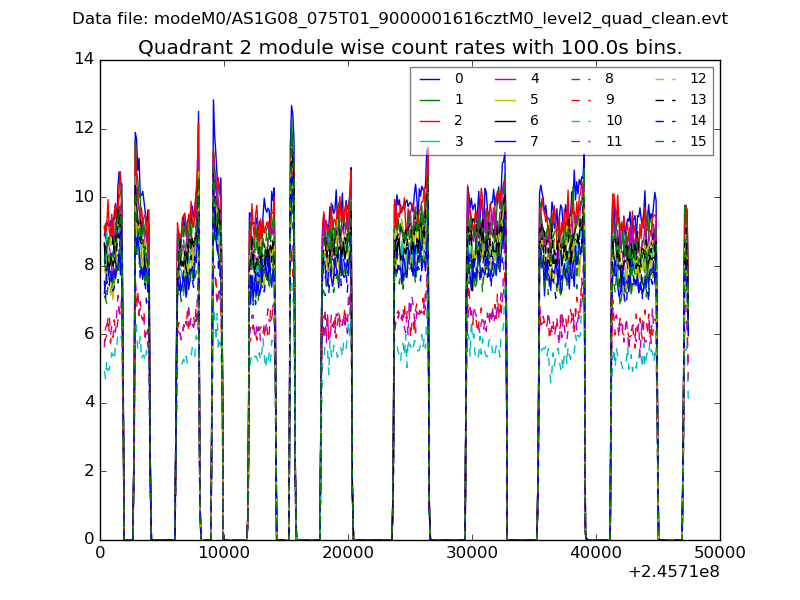
| Module-wise count rates for Quadrant B Data is divided into 100 sec bins |
 |
 |
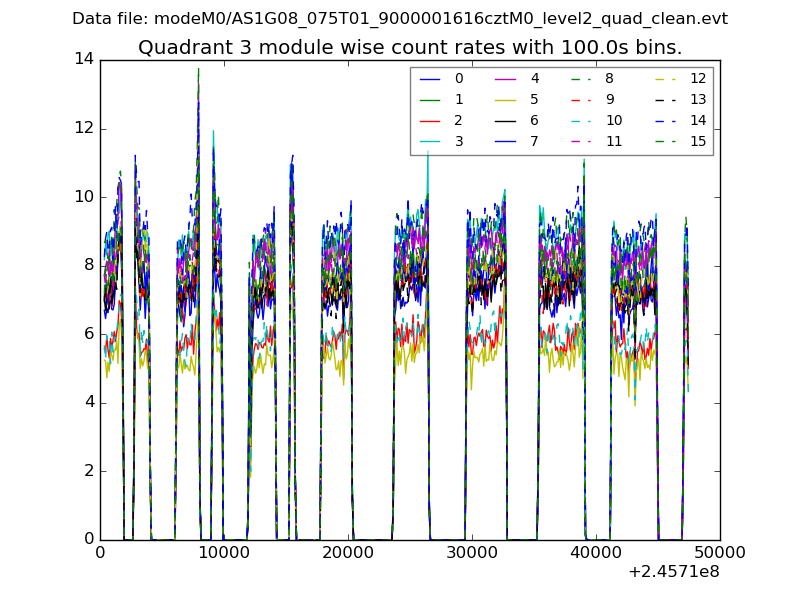
| Module-wise count rates for Quadrant C Data is divided into 100 sec bins |
 |
 |
| Module-wise count rates for Quadrant D Data is divided into 100 sec bins |
 |
 |
| Parameter | Plot |
|---|---|
| CZT HV Monitor | 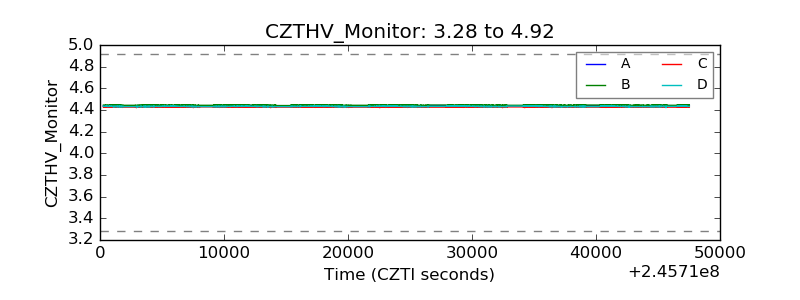 |
| D_VDD | 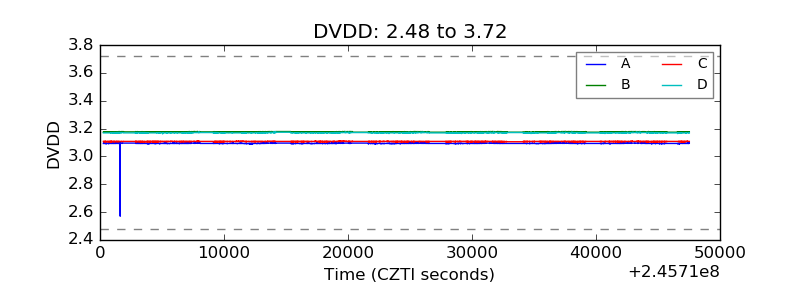 |
| Temperature 1 | 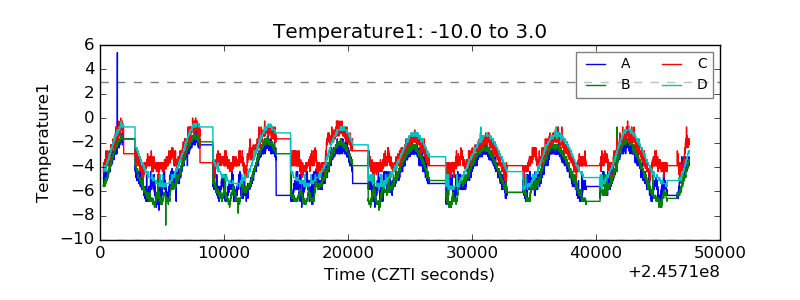 |
| Veto HV Monitor | 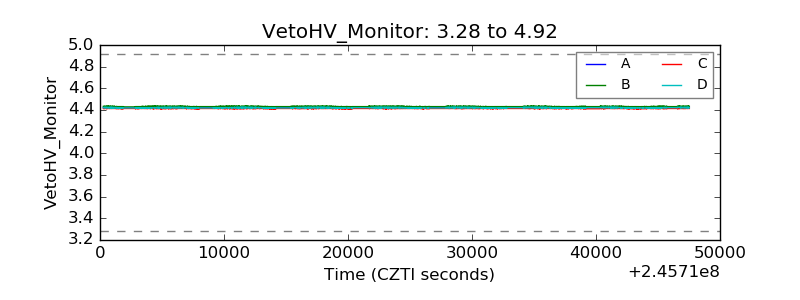 |
| Veto LLD | 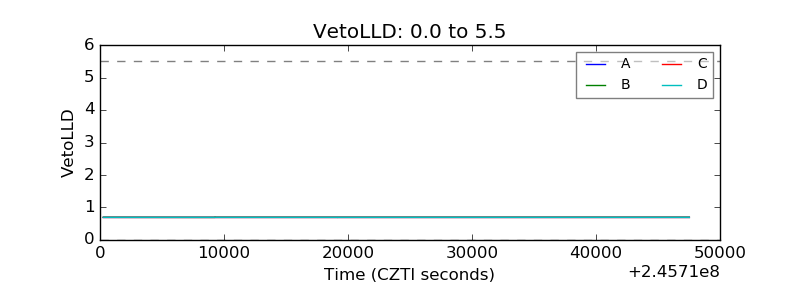 |
| Alpha Counter |  |
| _CPM_Rate | 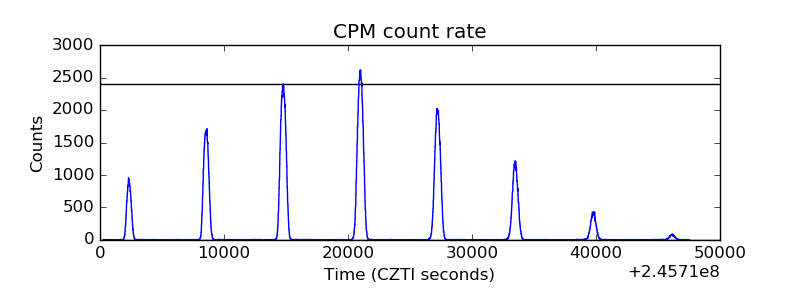 |
| CZT Counter |  |
| +2.5 Volts monitor | 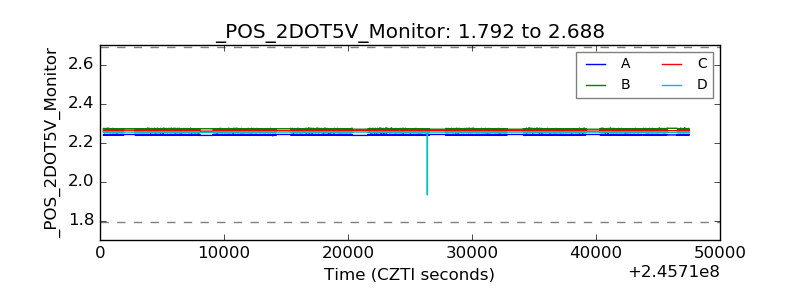 |
| +5 Volts monitor | 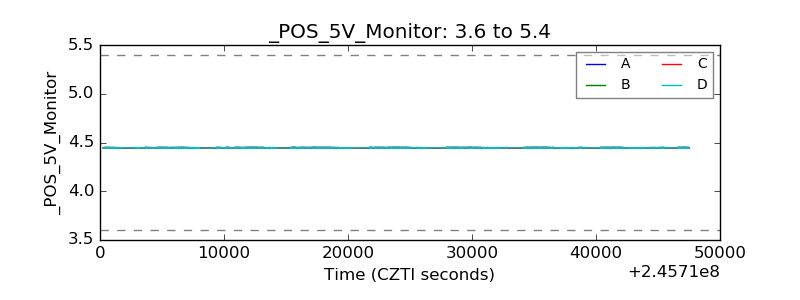 |
| _ROLL_ROT | 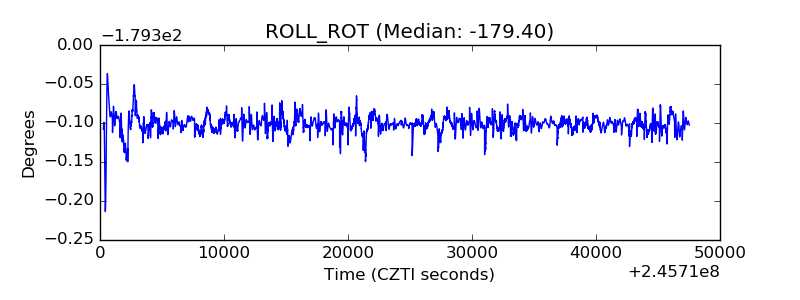 |
| _Roll_DEC | 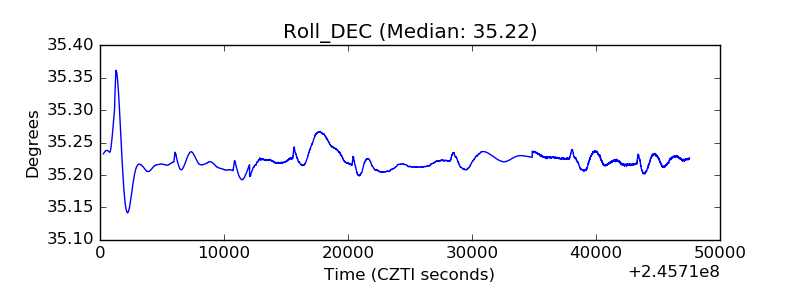 |
| _Roll_RA | 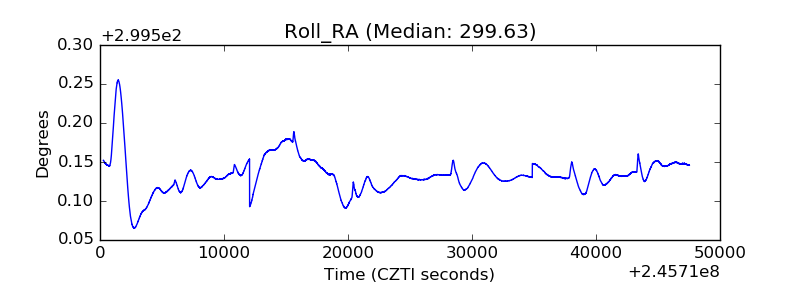 |
| Veto Counter | 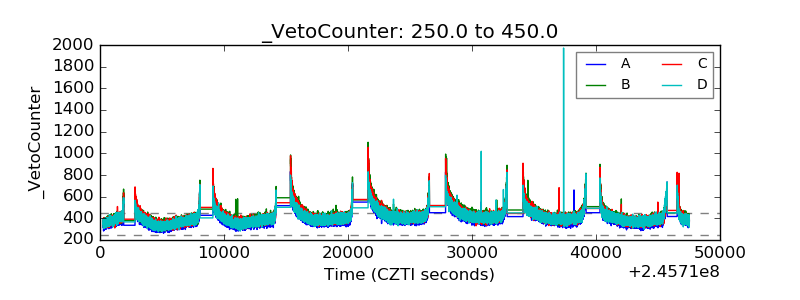 |