| Param | Original file | Final file |
|---|---|---|
| Filename | modeM0/AS1G08_075T01_9000001616_11067cztM0_level2.evt | modeM0/AS1G08_075T01_9000001616_11067cztM0_level2_quad_clean.evt |
| Size (bytes) | 242,092,800 | 55,140,480 |
| Size | 230.9 MB | 52.6 MB |
| Events in quadrant A | 1,994,857 | 369,984 |
| Events in quadrant B | 1,939,975 | 367,597 |
| Events in quadrant C | 1,397,936 | 369,067 |
| Events in quadrant D | 1,796,360 | 351,957 |
| Mode SS | |||
|---|---|---|---|
| Quadrant | BADHDUFLAG | Total packets | Discarded packets |
| A | 0 | 62 | 0 |
| B | 0 | 62 | 0 |
| C | 0 | 62 | 0 |
| D | 0 | 62 | 0 |
| Mode M9 | |||
|---|---|---|---|
| Quadrant | BADHDUFLAG | Total packets | Discarded packets |
| A | 0 | 9 | 0 |
| B | 0 | 9 | 0 |
| C | 0 | 9 | 0 |
| D | 0 | 9 | 0 |
| Mode M0 | |||
|---|---|---|---|
| Quadrant | BADHDUFLAG | Total packets | Discarded packets |
| A | 0 | 7803 | 2 |
| B | 0 | 7653 | 1 |
| C | 0 | 6014 | 1 |
| D | 0 | 7233 | 1 |
| Quadrant | Total seconds | Saturated seconds | Saturation percentage |
|---|---|---|---|
| A | 2957 | 34 | 1.149814% |
| B | 2957 | 111 | 3.753805% |
| C | 2957 | 3 | 0.101454% |
| D | 2957 | 76 | 2.570172% |
Noise dominated data is calculated using 1-second bins in cleaned event files. If a bin has >2000 counts, and if more than 50% of those come from <1% of pixels, then it is considered to be noise-dominated and hence unusable.
| Quadrant | # 1 sec bins | Bins with >0 counts | Bins with >2000 counts | High rate bins dominated by noise | Noise dominated (total time) | Noise dominated (detector-on time) | Marked lightcurve |
|---|---|---|---|---|---|---|---|
| A | 3877 | 2958 | 11 | 11 | 0.28% | 0.37% | 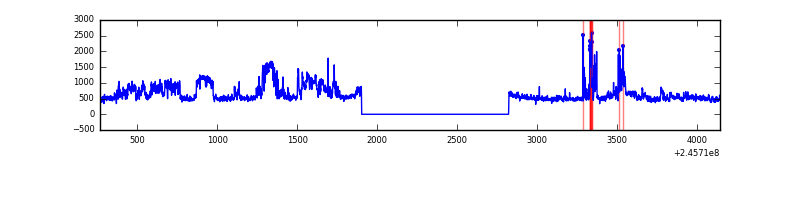 |
| B | 3877 | 2958 | 50 | 50 | 1.29% | 1.69% | 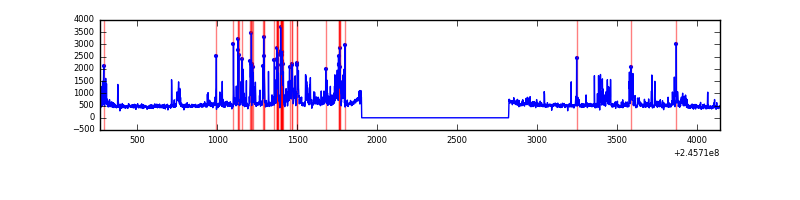 |
| C | 3877 | 2958 | 0 | 0 | 0.00% | 0.00% | 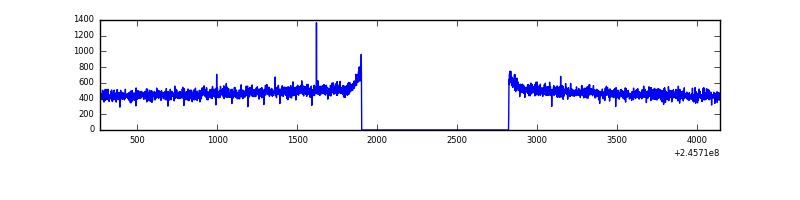 |
| D | 3877 | 2958 | 60 | 60 | 1.55% | 2.03% | 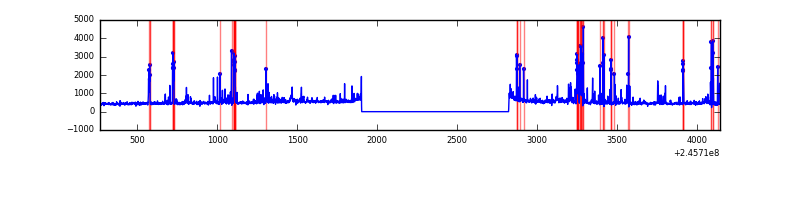 |
Top three noisy pixels from each quadrant. If the there are fewer than three noisy pixels in the level2.evt file, extra rows are filled as -1
| Pixel properties | Quadrant properties | ||||||
|---|---|---|---|---|---|---|---|
| Quadrant | DetID | PixID | Counts | Sigma | Mean | Median | Sigma |
| A | 15 | 174 | 470908 | 6093.7 | 370 | 362 | 77.2 |
| A | 8 | 15 | 88535 | 1141.87 | 370 | 362 | 77.2 |
| A | 14 | 238 | 7819 | 96.57 | 370 | 362 | 77.2 |
| B | 4 | 239 | 443552 | 6141.59 | 364 | 355 | 72.2 |
| B | 15 | 204 | 32826 | 449.97 | 364 | 355 | 72.2 |
| B | 0 | 214 | 16633 | 225.57 | 364 | 355 | 72.2 |
| C | 13 | 61 | 2620 | 26.88 | 357 | 358 | 84.1 |
| C | 8 | 222 | 1779 | 16.89 | 357 | 358 | 84.1 |
| C | 14 | 234 | 1489 | 13.44 | 357 | 358 | 84.1 |
| D | 10 | 253 | 252147 | 2869.51 | 356 | 346 | 87.8 |
| D | 13 | 249 | 53420 | 604.83 | 356 | 346 | 87.8 |
| D | 1 | 52 | 46978 | 531.42 | 356 | 346 | 87.8 |
Histogram calculated using DETX and DETY for each event in the final _common_clean file
| Quadrant A |  |
 |
Quadrant B |
|---|---|---|---|
| Quadrant D |  |
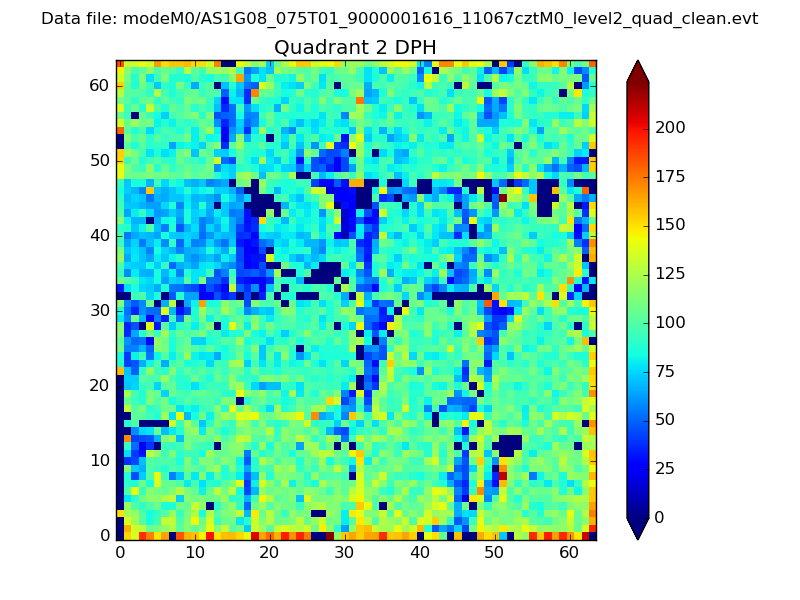 |
Quadrant C |
| Plot type | Count rate plots | Images |
|---|---|---|
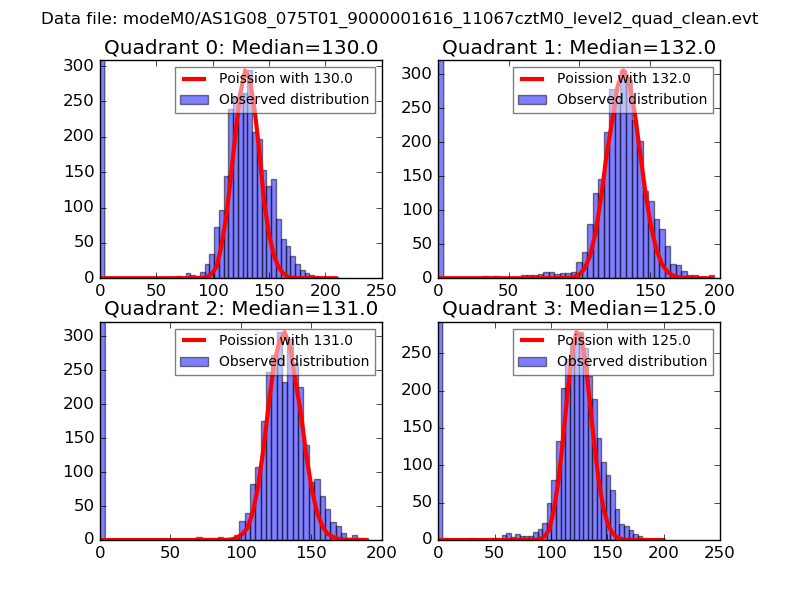
| Comparison with Poisson distribution Blue bars denote a histogram of data divided into 1 sec bins. Red curve is a Poisson curve with rate = median count rate of data. |
 |
 |
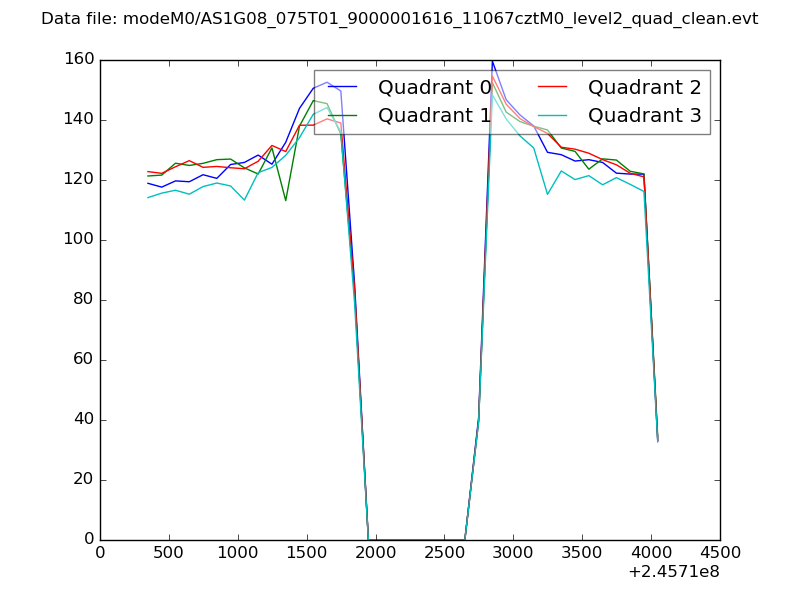
| Quadrant-wise count rates Data is divided into 100 sec bins |
 |
|
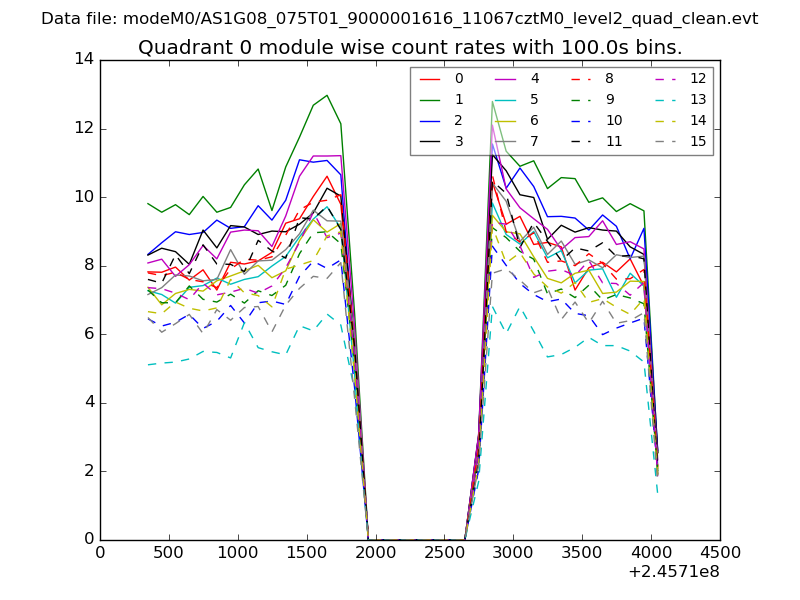
| Module-wise count rates for Quadrant A Data is divided into 100 sec bins |
 |
 |
| Module-wise count rates for Quadrant B Data is divided into 100 sec bins |
 |
 |
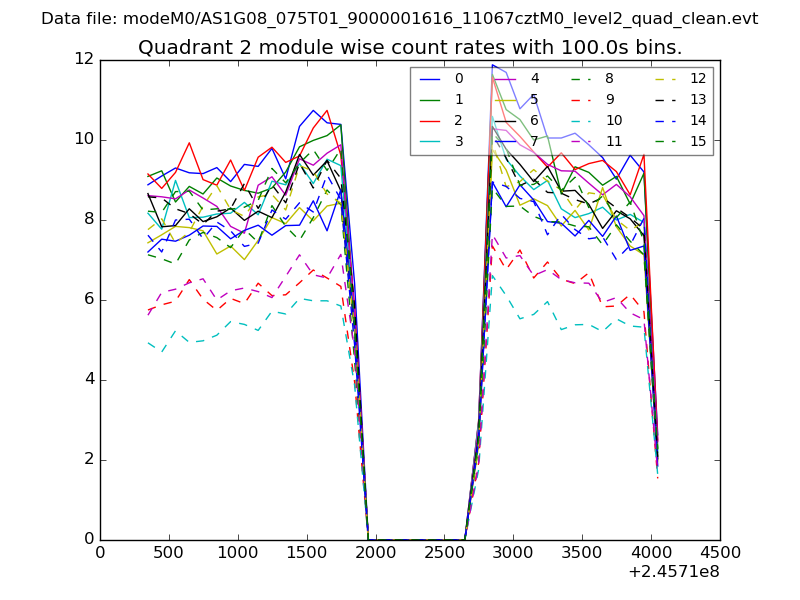
| Module-wise count rates for Quadrant C Data is divided into 100 sec bins |
 |
 |
| Module-wise count rates for Quadrant D Data is divided into 100 sec bins |
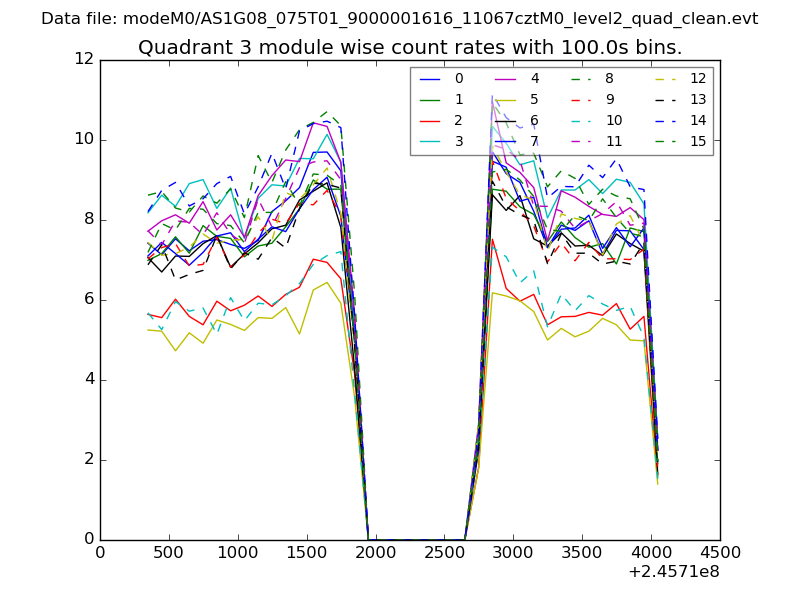 |
 |
| Parameter | Plot |
|---|---|
| CZT HV Monitor |  |
| D_VDD | 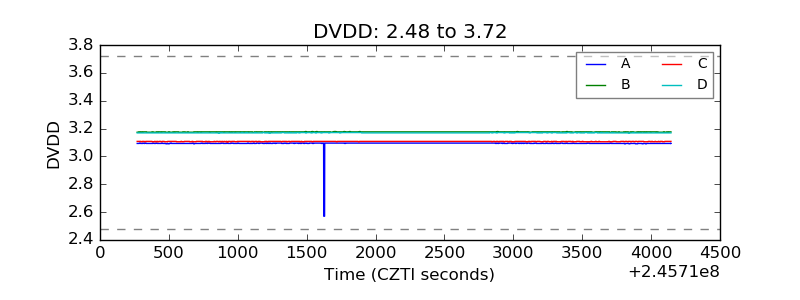 |
| Temperature 1 | 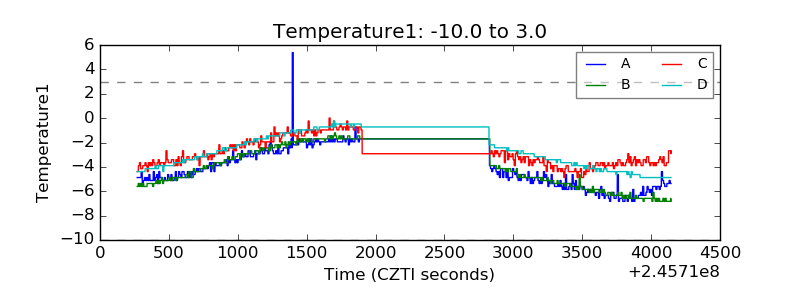 |
| Veto HV Monitor | 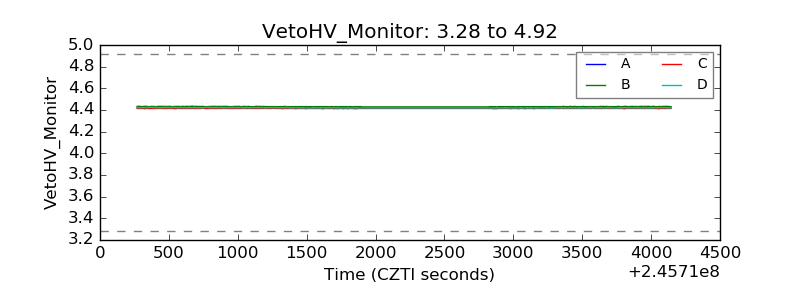 |
| Veto LLD | 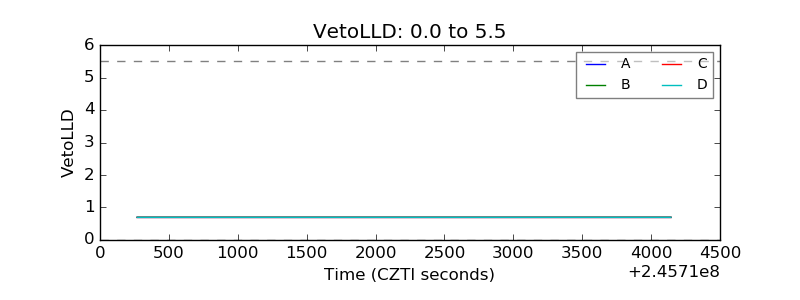 |
| Alpha Counter | 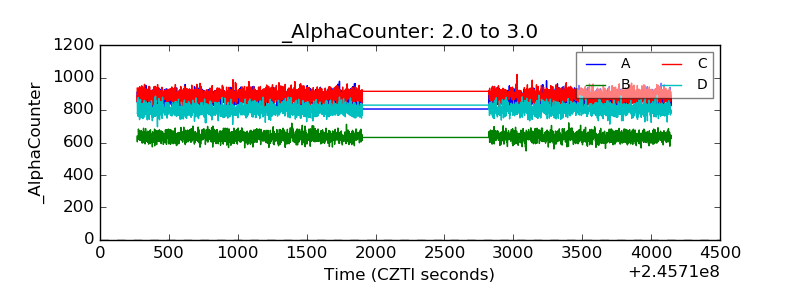 |
| _CPM_Rate | 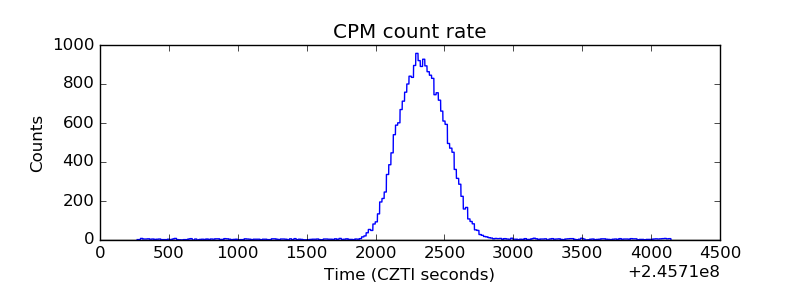 |
| CZT Counter | 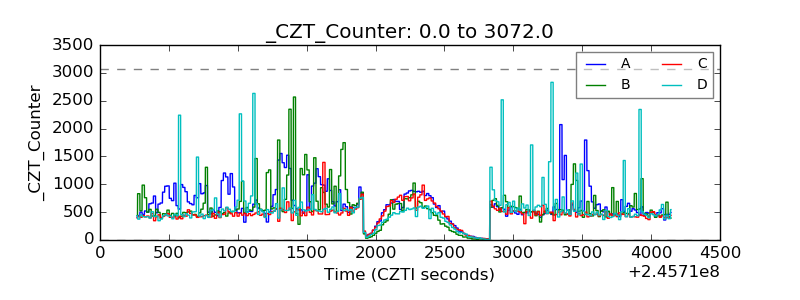 |
| +2.5 Volts monitor |  |
| +5 Volts monitor | 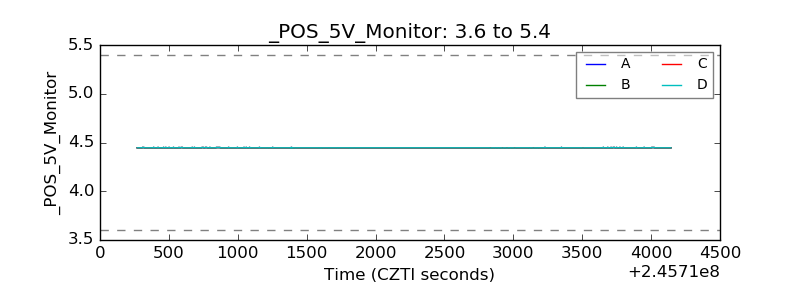 |
| _ROLL_ROT | 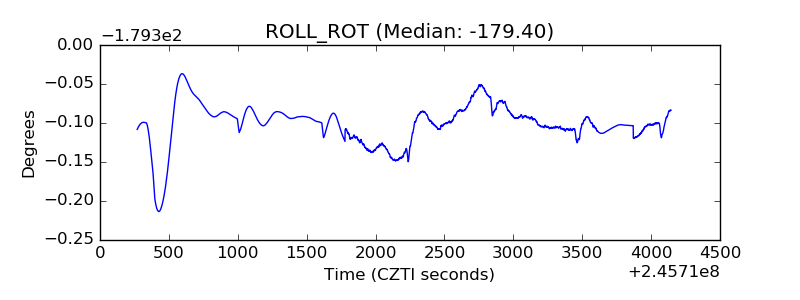 |
| _Roll_DEC | 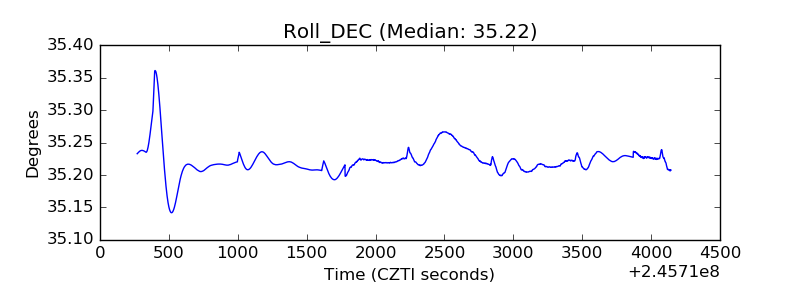 |
| _Roll_RA | 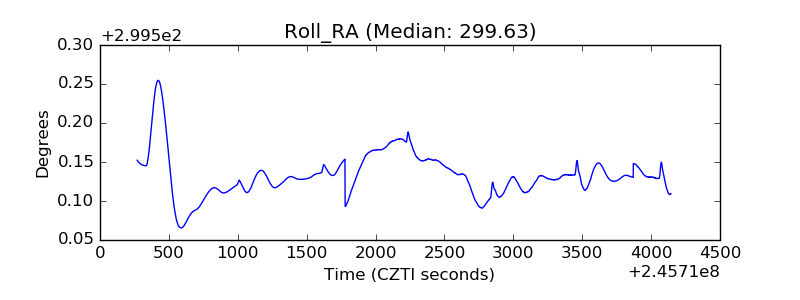 |
| Veto Counter | 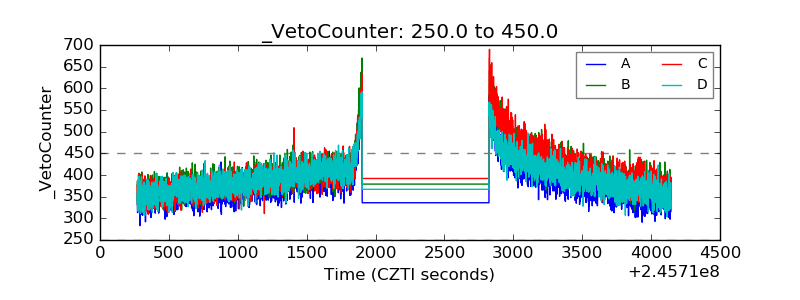 |