| Param | Original file | Final file |
|---|---|---|
| Filename | modeM0/AS1G08_075T01_9000001616_11070cztM0_level2.evt | modeM0/AS1G08_075T01_9000001616_11070cztM0_level2_quad_clean.evt |
| Size (bytes) | 558,164,160 | 74,721,600 |
| Size | 532.3 MB | 71.3 MB |
| Events in quadrant A | 3,654,186 | 458,547 |
| Events in quadrant B | 4,621,838 | 461,483 |
| Events in quadrant C | 3,084,185 | 460,020 |
| Events in quadrant D | 5,091,804 | 417,270 |
| Mode SS | |||
|---|---|---|---|
| Quadrant | BADHDUFLAG | Total packets | Discarded packets |
| A | 0 | 136 | 0 |
| B | 0 | 136 | 0 |
| C | 0 | 136 | 0 |
| D | 0 | 136 | 0 |
| Mode M9 | |||
|---|---|---|---|
| Quadrant | BADHDUFLAG | Total packets | Discarded packets |
| A | 0 | 16 | 0 |
| B | 0 | 16 | 0 |
| C | 0 | 16 | 0 |
| D | 0 | 17 | 0 |
| Mode M0 | |||
|---|---|---|---|
| Quadrant | BADHDUFLAG | Total packets | Discarded packets |
| A | 0 | 15228 | 3 |
| B | 0 | 18125 | 2 |
| C | 0 | 13654 | 2 |
| D | 0 | 19566 | 2 |
| Quadrant | Total seconds | Saturated seconds | Saturation percentage |
|---|---|---|---|
| A | 6667 | 61 | 0.914954% |
| B | 6667 | 312 | 4.679766% |
| C | 6667 | 22 | 0.329984% |
| D | 6667 | 502 | 7.529624% |
Noise dominated data is calculated using 1-second bins in cleaned event files. If a bin has >2000 counts, and if more than 50% of those come from <1% of pixels, then it is considered to be noise-dominated and hence unusable.
| Quadrant | # 1 sec bins | Bins with >0 counts | Bins with >2000 counts | High rate bins dominated by noise | Noise dominated (total time) | Noise dominated (detector-on time) | Marked lightcurve |
|---|---|---|---|---|---|---|---|
| A | 7827 | 6668 | 12 | 12 | 0.15% | 0.18% | 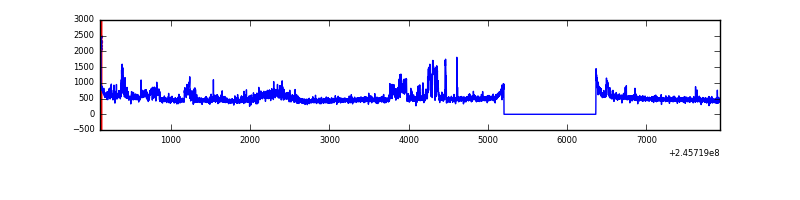 |
| B | 7827 | 6668 | 159 | 159 | 2.03% | 2.38% | 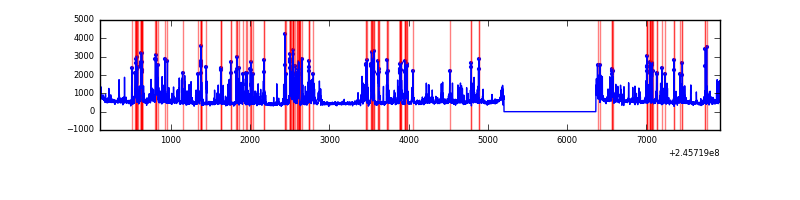 |
| C | 7827 | 6668 | 0 | 0 | 0.00% | 0.00% | 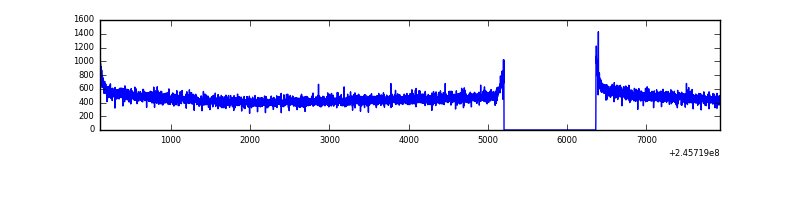 |
| D | 7827 | 6668 | 467 | 467 | 5.97% | 7.00% | 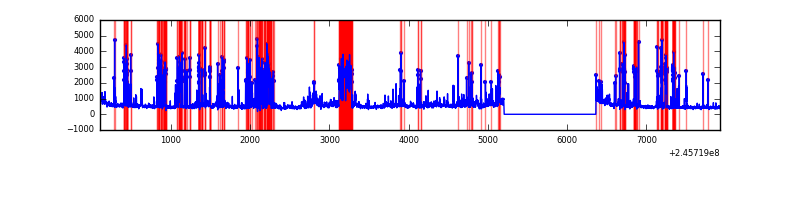 |
Top three noisy pixels from each quadrant. If the there are fewer than three noisy pixels in the level2.evt file, extra rows are filled as -1
| Pixel properties | Quadrant properties | ||||||
|---|---|---|---|---|---|---|---|
| Quadrant | DetID | PixID | Counts | Sigma | Mean | Median | Sigma |
| A | 15 | 174 | 360210 | 2206.6 | 804 | 786 | 162.9 |
| A | 8 | 15 | 181843 | 1111.55 | 804 | 786 | 162.9 |
| A | 11 | 29 | 9115 | 51.13 | 804 | 786 | 162.9 |
| B | 4 | 239 | 1394555 | 9068.12 | 806 | 786 | 153.7 |
| B | 0 | 214 | 53819 | 345.04 | 806 | 786 | 153.7 |
| B | 12 | 111 | 16579 | 102.75 | 806 | 786 | 153.7 |
| C | 13 | 61 | 5830 | 27.52 | 790 | 797 | 182.9 |
| C | 14 | 234 | 2841 | 11.18 | 790 | 797 | 182.9 |
| C | 3 | 202 | 1959 | 6.35 | 790 | 797 | 182.9 |
| D | 10 | 253 | 1541277 | 8513.54 | 751 | 729 | 181.0 |
| D | 11 | 129 | 278848 | 1536.97 | 751 | 729 | 181.0 |
| D | 1 | 52 | 174827 | 962.12 | 751 | 729 | 181.0 |
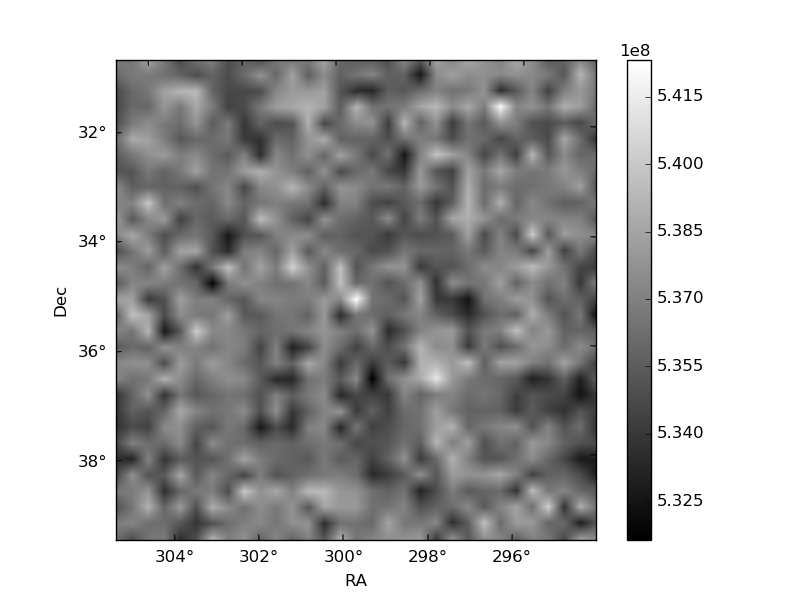
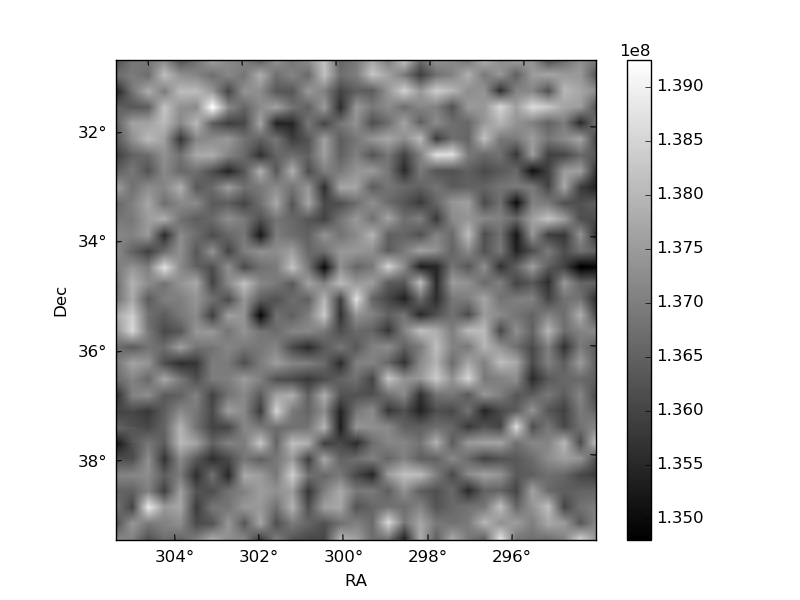
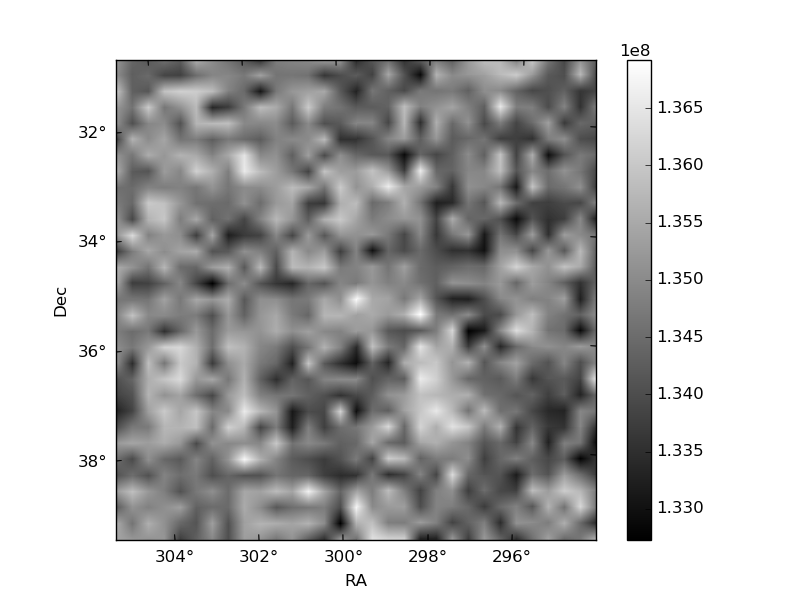
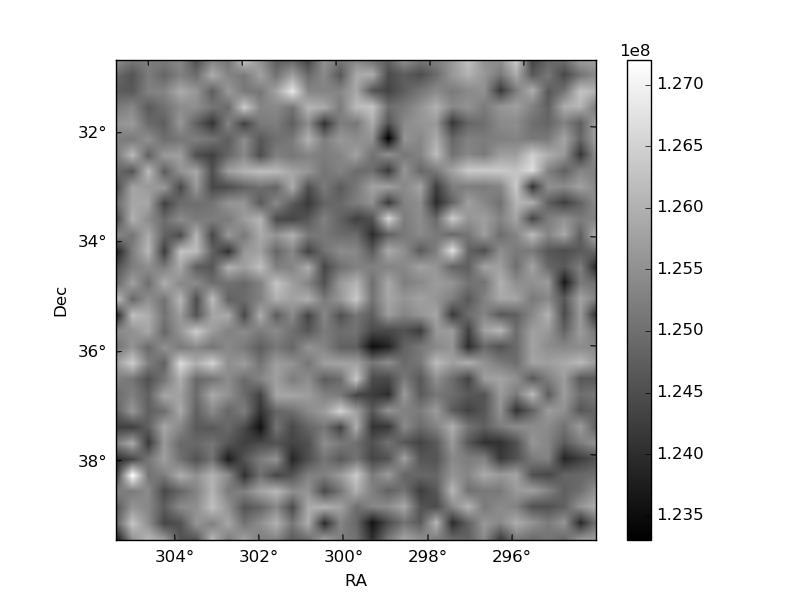
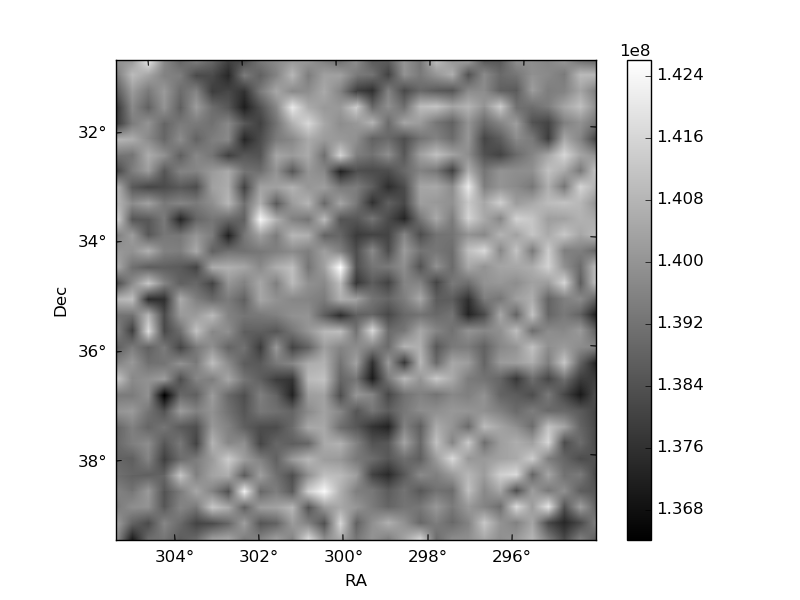
Histogram calculated using DETX and DETY for each event in the final _common_clean file
| Quadrant A | 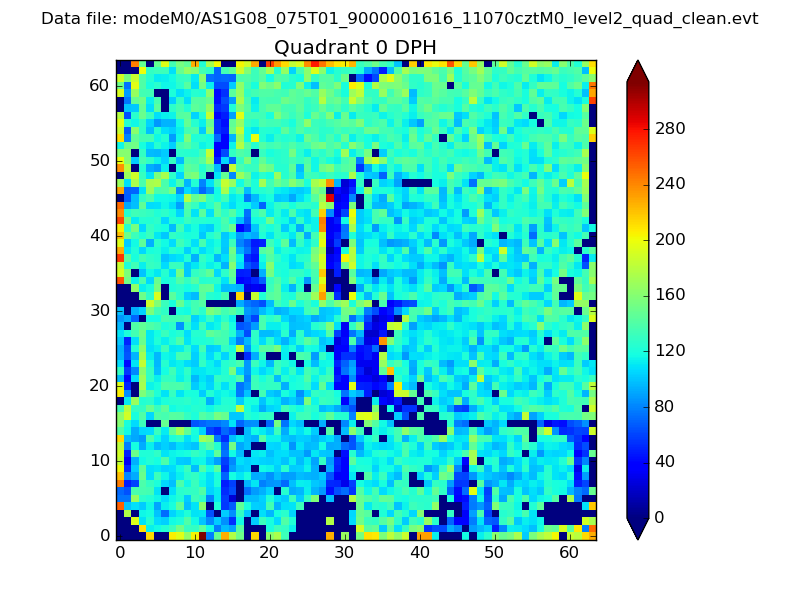 |
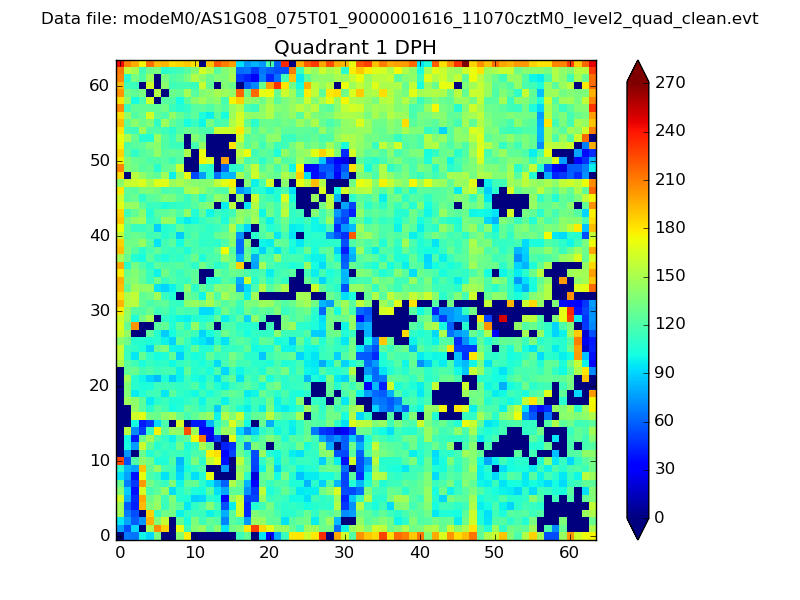 |
Quadrant B |
|---|---|---|---|
| Quadrant D |  |
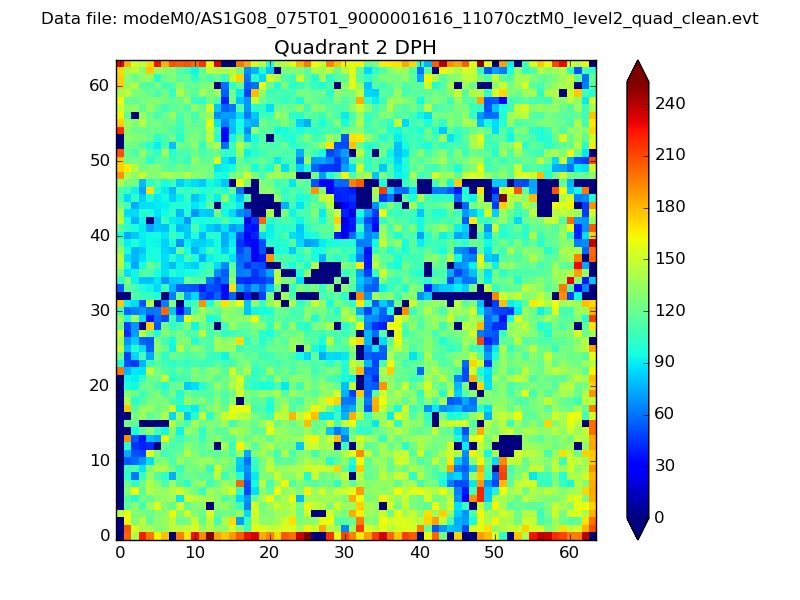 |
Quadrant C |
| Plot type | Count rate plots | Images |
|---|---|---|
| Comparison with Poisson distribution Blue bars denote a histogram of data divided into 1 sec bins. Red curve is a Poisson curve with rate = median count rate of data. |
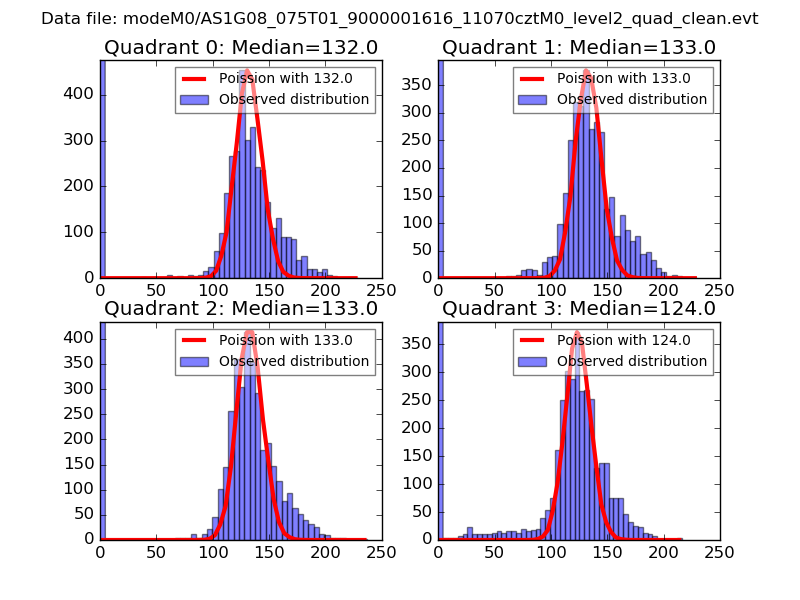 |
 |
| Quadrant-wise count rates Data is divided into 100 sec bins |
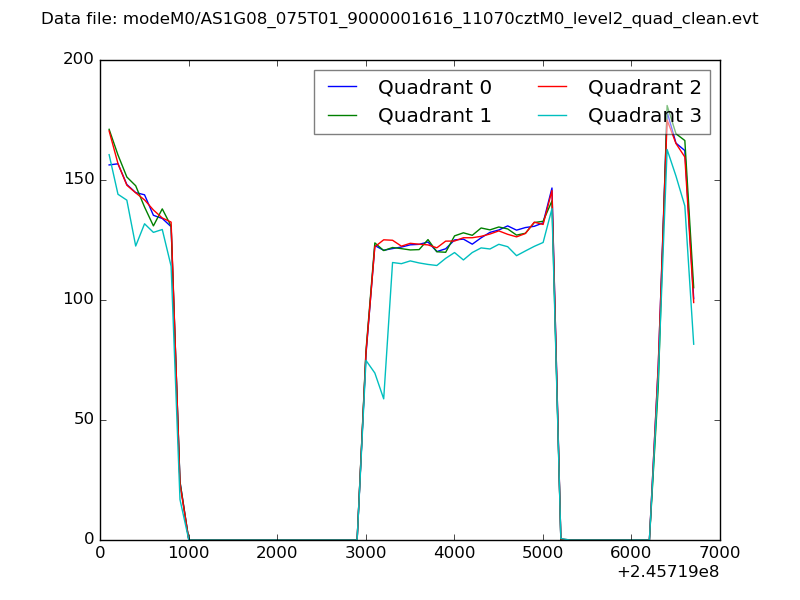 |
|
| Module-wise count rates for Quadrant A Data is divided into 100 sec bins |
 |
 |
| Module-wise count rates for Quadrant B Data is divided into 100 sec bins |
 |
 |
| Module-wise count rates for Quadrant C Data is divided into 100 sec bins |
 |
 |
| Module-wise count rates for Quadrant D Data is divided into 100 sec bins |
 |
 |
| Parameter | Plot |
|---|---|
| CZT HV Monitor |  |
| D_VDD | 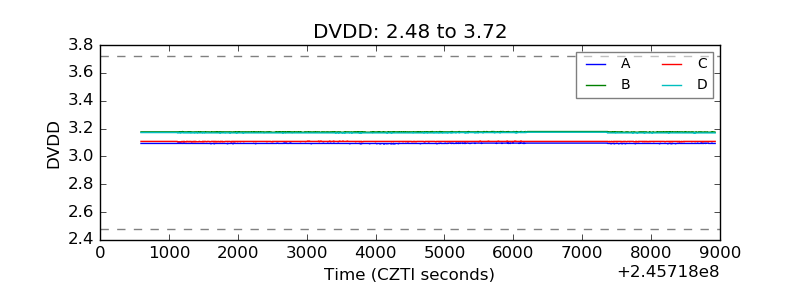 |
| Temperature 1 | 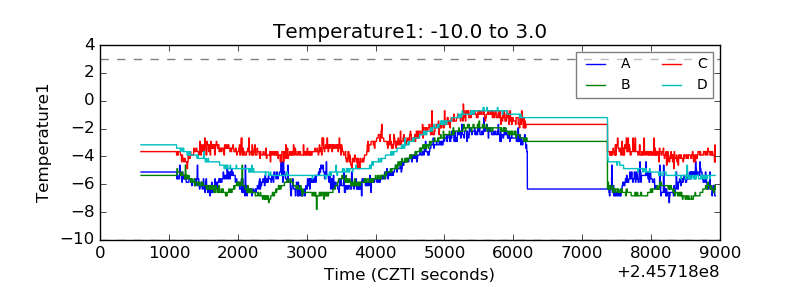 |
| Veto HV Monitor | 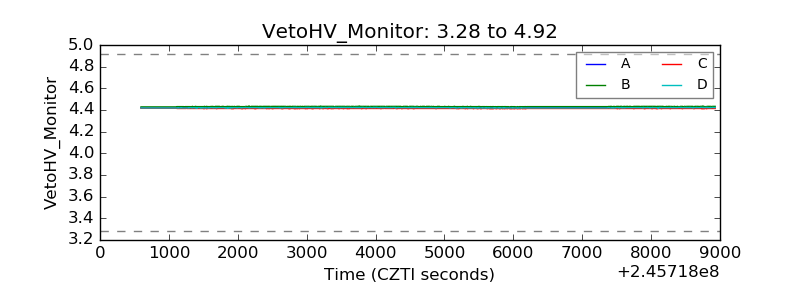 |
| Veto LLD | 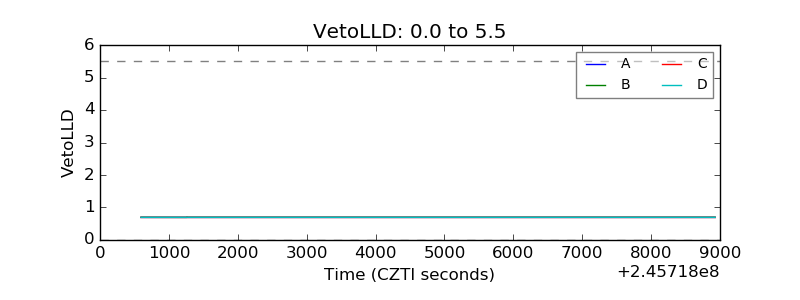 |
| Alpha Counter | 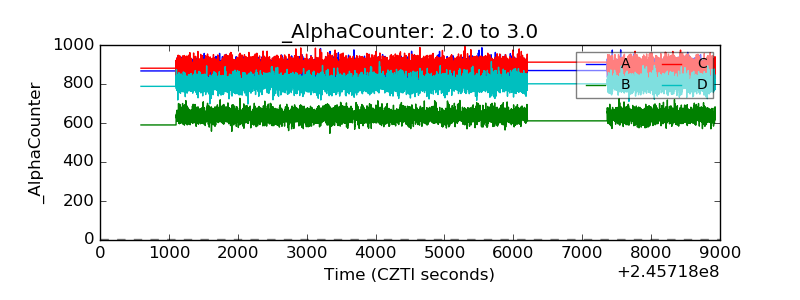 |
| _CPM_Rate | 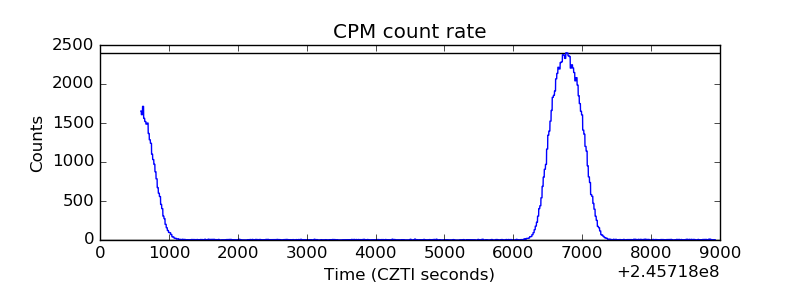 |
| CZT Counter | 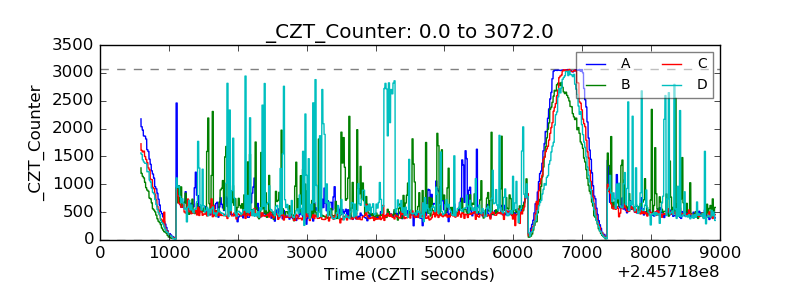 |
| +2.5 Volts monitor |  |
| +5 Volts monitor | 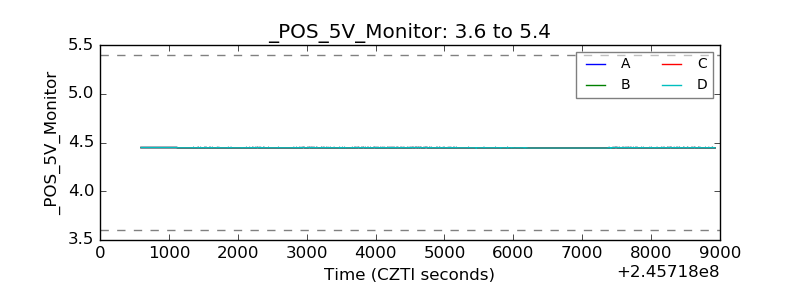 |
| _ROLL_ROT | 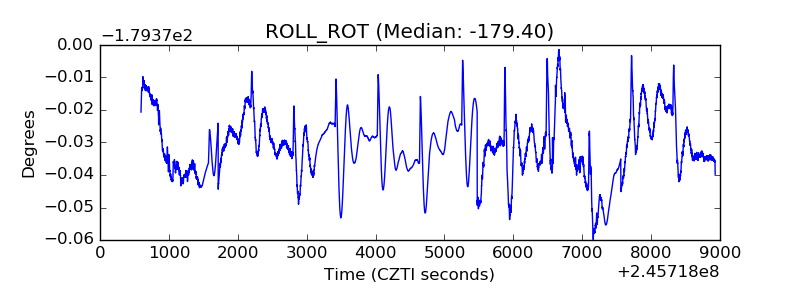 |
| _Roll_DEC | 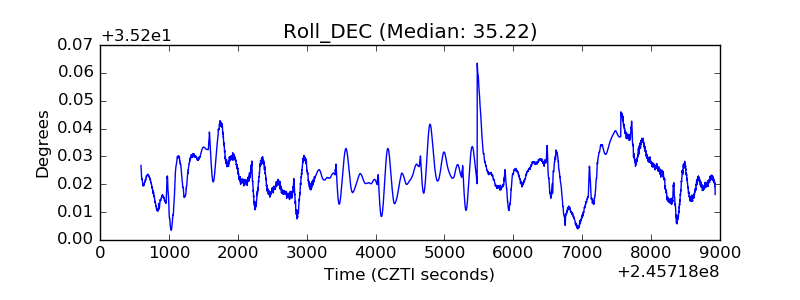 |
| _Roll_RA | 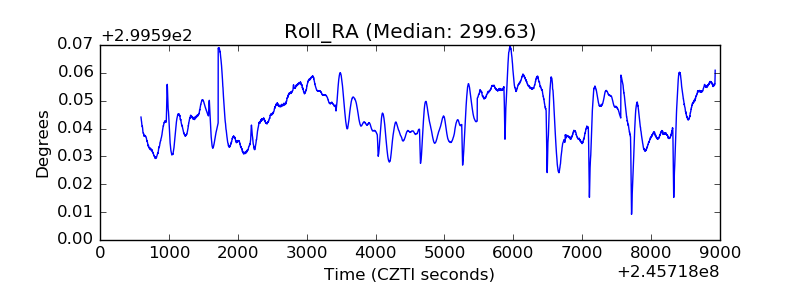 |
| Veto Counter | 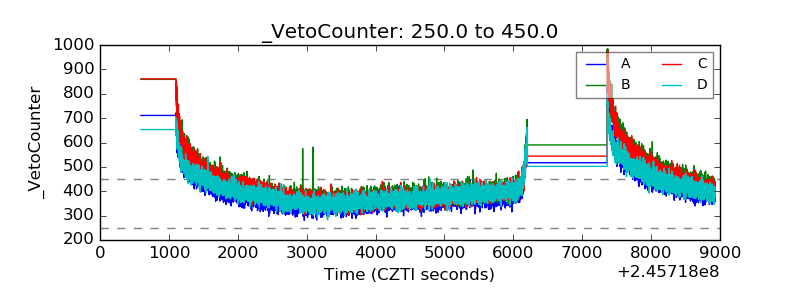 |