| Param | Original file | Final file |
|---|---|---|
| Filename | modeM0/AS1G08_075T01_9000001616_11071cztM0_level2.evt | modeM0/AS1G08_075T01_9000001616_11071cztM0_level2_quad_clean.evt |
| Size (bytes) | 547,888,320 | 65,151,360 |
| Size | 522.5 MB | 62.1 MB |
| Events in quadrant A | 3,819,964 | 388,467 |
| Events in quadrant B | 4,358,249 | 392,021 |
| Events in quadrant C | 3,060,879 | 390,055 |
| Events in quadrant D | 4,922,861 | 358,211 |
| Mode SS | |||
|---|---|---|---|
| Quadrant | BADHDUFLAG | Total packets | Discarded packets |
| A | 0 | 128 | 0 |
| B | 0 | 128 | 0 |
| C | 0 | 128 | 0 |
| D | 0 | 128 | 0 |
| Mode M9 | |||
|---|---|---|---|
| Quadrant | BADHDUFLAG | Total packets | Discarded packets |
| A | 0 | 19 | 0 |
| B | 0 | 19 | 0 |
| C | 0 | 19 | 0 |
| D | 0 | 20 | 0 |
| Mode M0 | |||
|---|---|---|---|
| Quadrant | BADHDUFLAG | Total packets | Discarded packets |
| A | 0 | 15402 | 3 |
| B | 0 | 17067 | 2 |
| C | 0 | 13186 | 2 |
| D | 0 | 19059 | 2 |
| Quadrant | Total seconds | Saturated seconds | Saturation percentage |
|---|---|---|---|
| A | 6362 | 77 | 1.210311% |
| B | 6362 | 300 | 4.715498% |
| C | 6362 | 36 | 0.565860% |
| D | 6362 | 441 | 6.931782% |
Noise dominated data is calculated using 1-second bins in cleaned event files. If a bin has >2000 counts, and if more than 50% of those come from <1% of pixels, then it is considered to be noise-dominated and hence unusable.
| Quadrant | # 1 sec bins | Bins with >0 counts | Bins with >2000 counts | High rate bins dominated by noise | Noise dominated (total time) | Noise dominated (detector-on time) | Marked lightcurve |
|---|---|---|---|---|---|---|---|
| A | 7617 | 6363 | 0 | 0 | 0.00% | 0.00% | 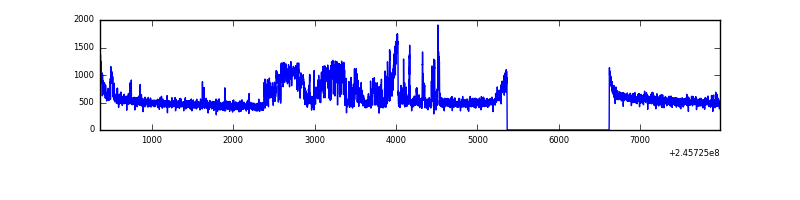 |
| B | 7617 | 6363 | 132 | 132 | 1.73% | 2.07% | 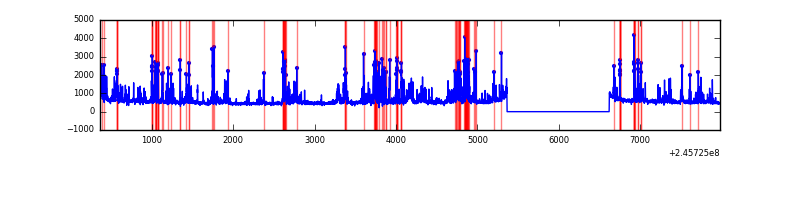 |
| C | 7617 | 6363 | 0 | 0 | 0.00% | 0.00% | 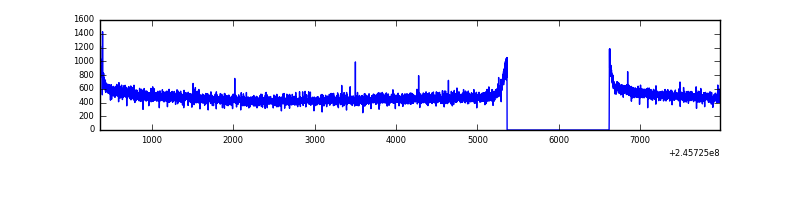 |
| D | 7617 | 6363 | 366 | 366 | 4.81% | 5.75% | 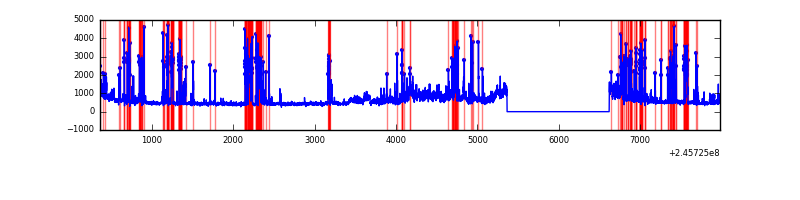 |
Top three noisy pixels from each quadrant. If the there are fewer than three noisy pixels in the level2.evt file, extra rows are filled as -1
| Pixel properties | Quadrant properties | ||||||
|---|---|---|---|---|---|---|---|
| Quadrant | DetID | PixID | Counts | Sigma | Mean | Median | Sigma |
| A | 15 | 174 | 646390 | 3985.1 | 806 | 790 | 162.0 |
| A | 8 | 15 | 57531 | 350.25 | 806 | 790 | 162.0 |
| A | 11 | 29 | 10708 | 61.22 | 806 | 790 | 162.0 |
| B | 4 | 239 | 1149242 | 7645.98 | 804 | 786 | 150.2 |
| B | 0 | 214 | 36846 | 240.07 | 804 | 786 | 150.2 |
| B | 12 | 111 | 16423 | 104.11 | 804 | 786 | 150.2 |
| C | 13 | 61 | 5987 | 29.1 | 783 | 790 | 178.6 |
| C | 14 | 234 | 2849 | 11.53 | 783 | 790 | 178.6 |
| C | 5 | 207 | 2296 | 8.43 | 783 | 790 | 178.6 |
| D | 10 | 253 | 1117950 | 6230.12 | 746 | 727 | 179.3 |
| D | 11 | 129 | 517804 | 2883.45 | 746 | 727 | 179.3 |
| D | 1 | 52 | 261210 | 1452.57 | 746 | 727 | 179.3 |
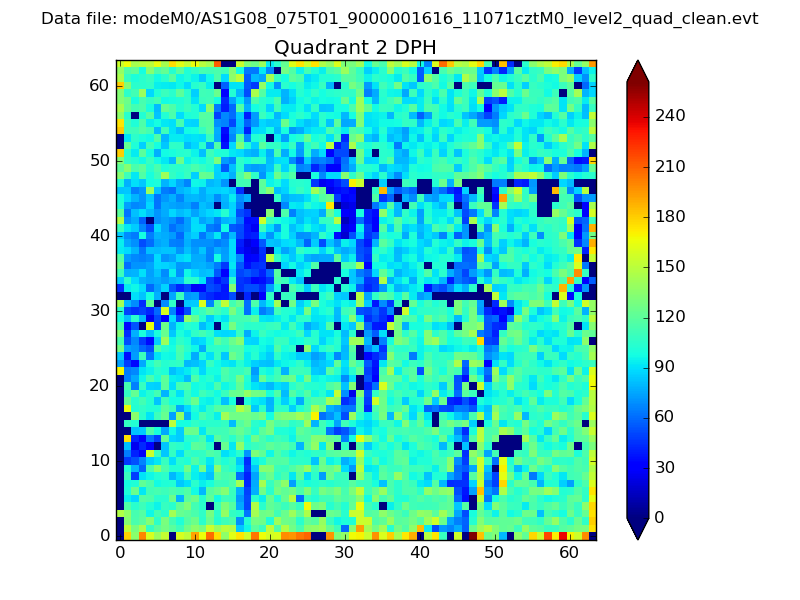
Histogram calculated using DETX and DETY for each event in the final _common_clean file
| Quadrant A |  |
 |
Quadrant B |
|---|---|---|---|
| Quadrant D |  |
 |
Quadrant C |
| Plot type | Count rate plots | Images |
|---|---|---|
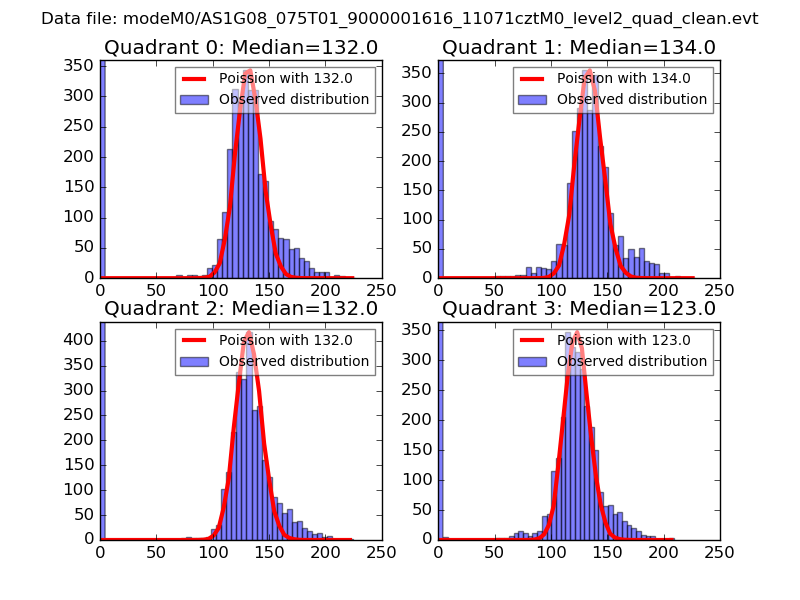
| Comparison with Poisson distribution Blue bars denote a histogram of data divided into 1 sec bins. Red curve is a Poisson curve with rate = median count rate of data. |
 |
 |
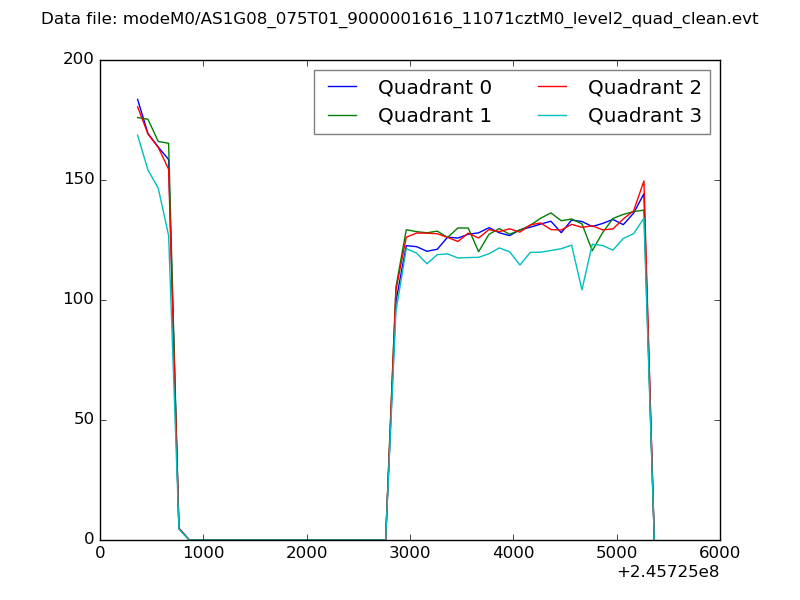
| Quadrant-wise count rates Data is divided into 100 sec bins |
 |
|
| Module-wise count rates for Quadrant A Data is divided into 100 sec bins |
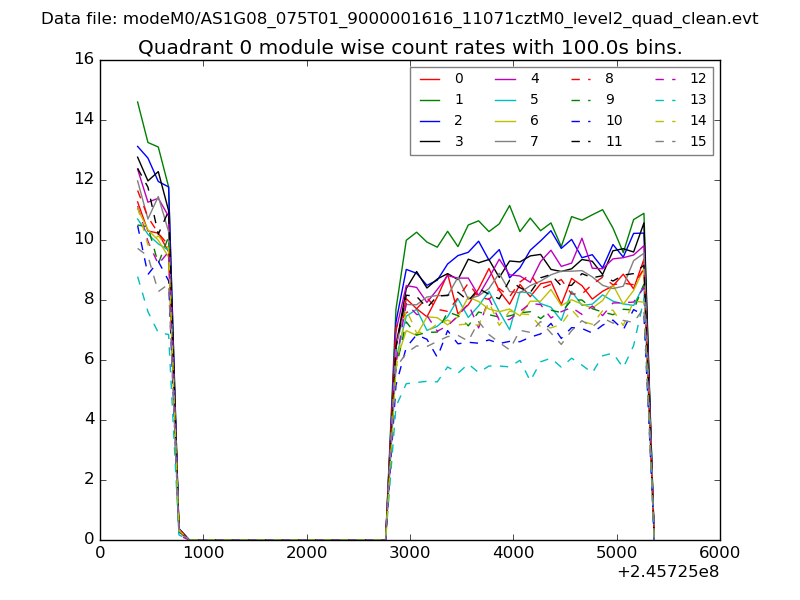 |
 |
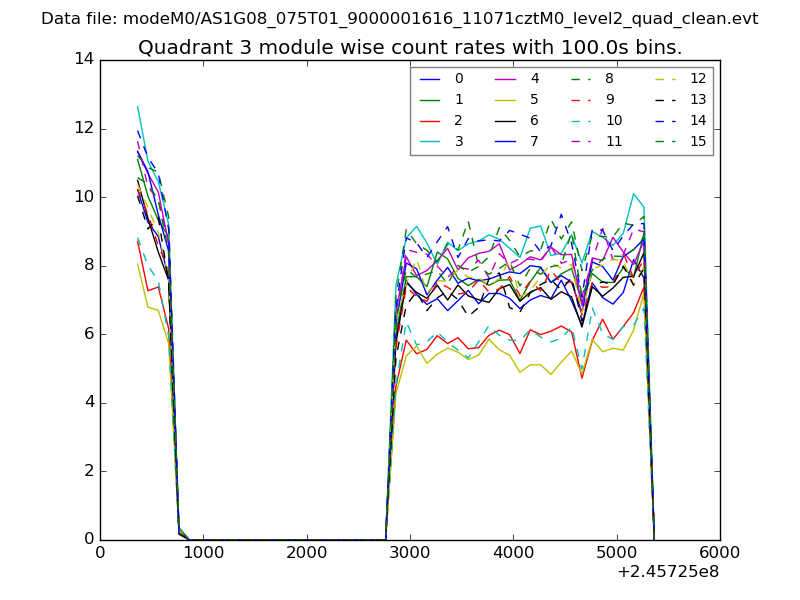
| Module-wise count rates for Quadrant B Data is divided into 100 sec bins |
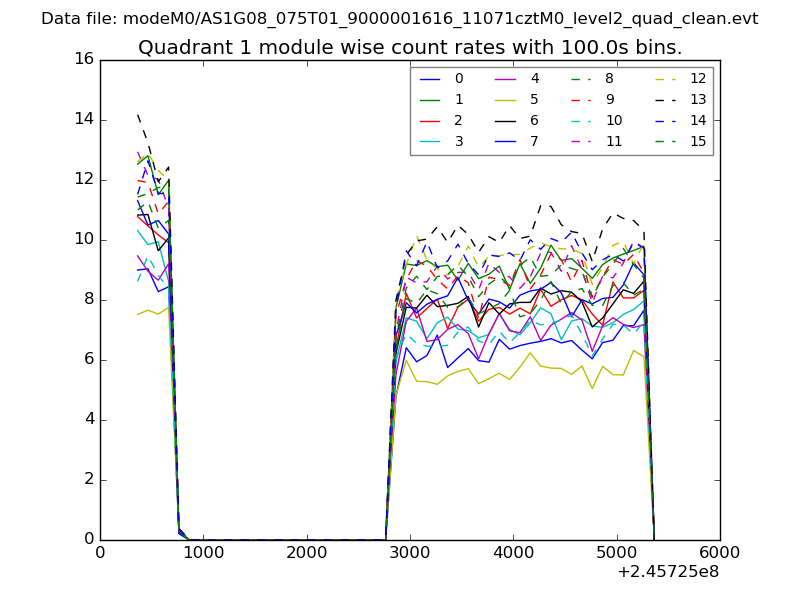 |
 |
| Module-wise count rates for Quadrant C Data is divided into 100 sec bins |
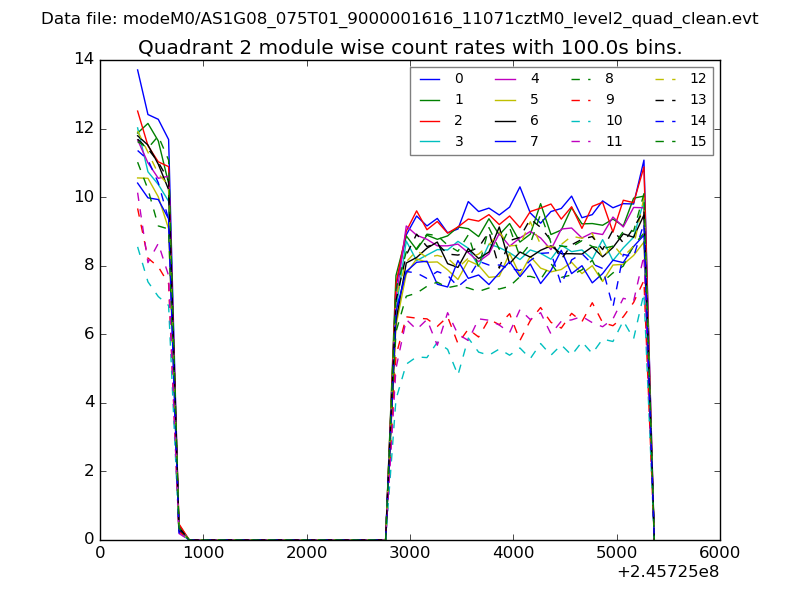 |
 |
| Module-wise count rates for Quadrant D Data is divided into 100 sec bins |
 |
 |
| Parameter | Plot |
|---|---|
| CZT HV Monitor | 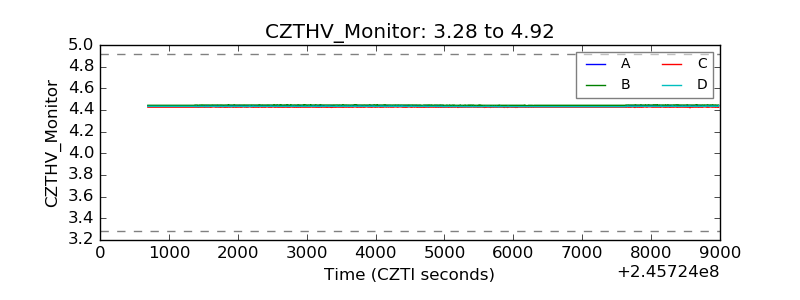 |
| D_VDD | 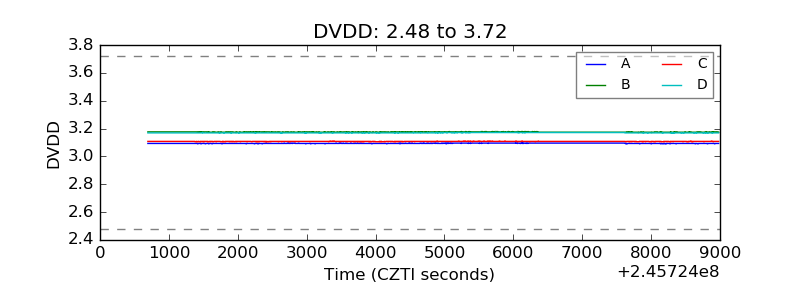 |
| Temperature 1 | 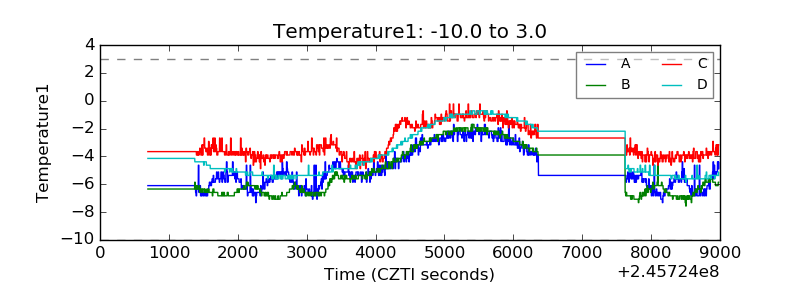 |
| Veto HV Monitor | 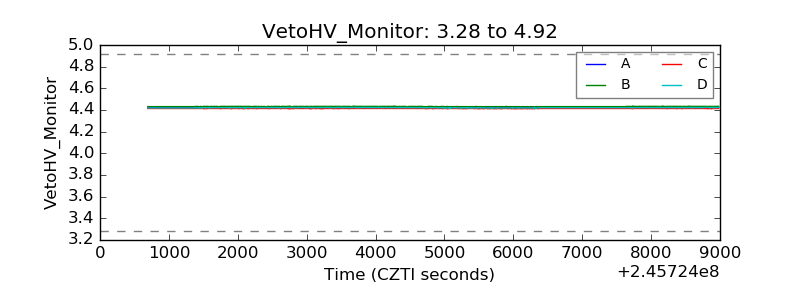 |
| Veto LLD | 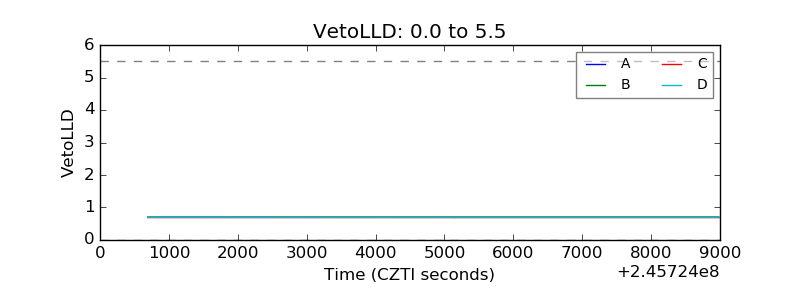 |
| Alpha Counter | 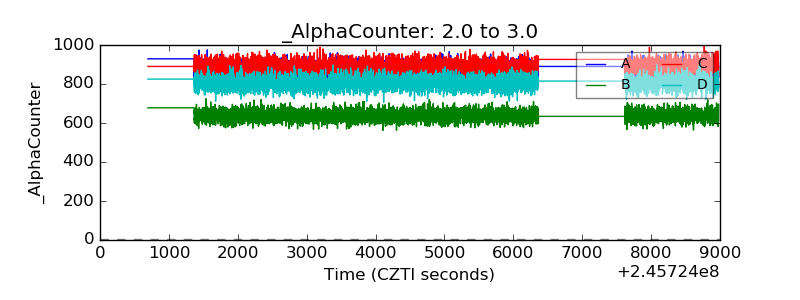 |
| _CPM_Rate | 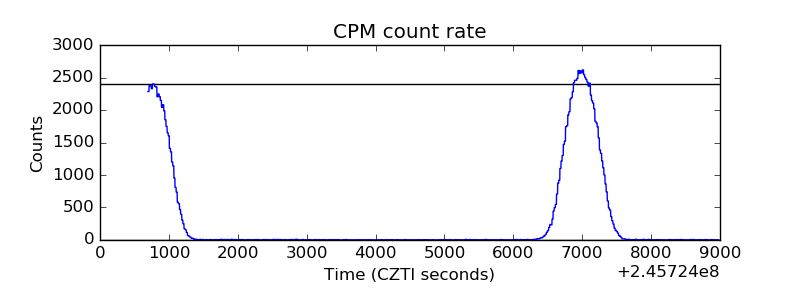 |
| CZT Counter | 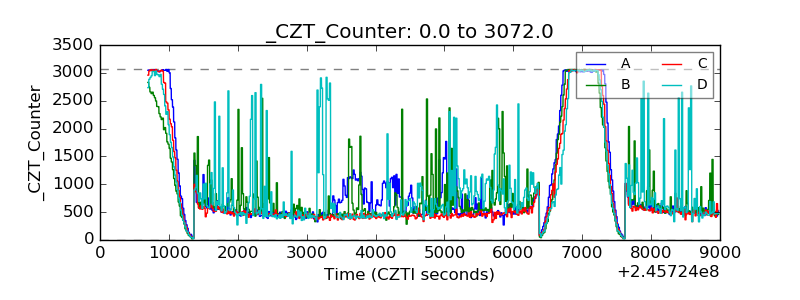 |
| +2.5 Volts monitor |  |
| +5 Volts monitor | 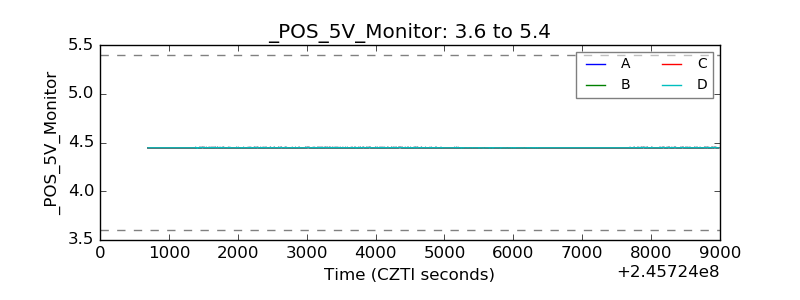 |
| _ROLL_ROT | 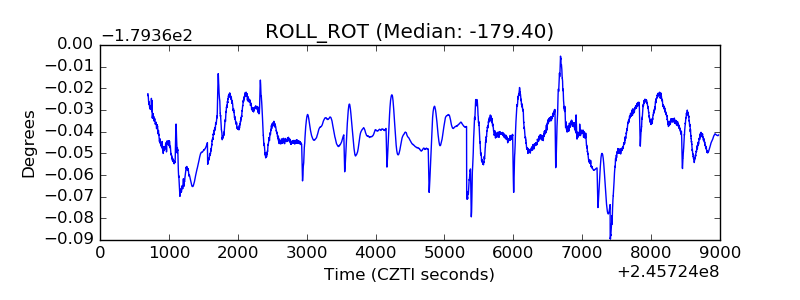 |
| _Roll_DEC | 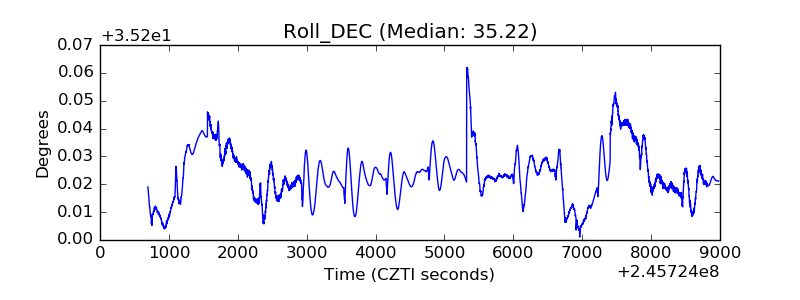 |
| _Roll_RA | 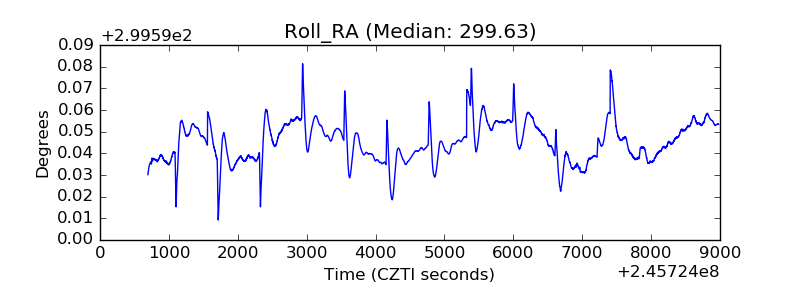 |
| Veto Counter | 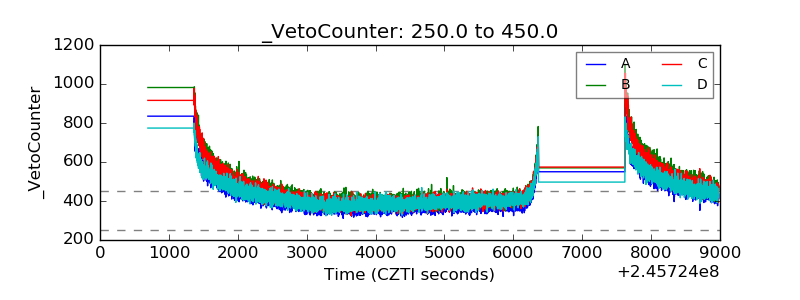 |