| Param | Original file | Final file |
|---|---|---|
| Filename | modeM0/AS1G08_075T01_9000001616_11072cztM0_level2.evt | modeM0/AS1G08_075T01_9000001616_11072cztM0_level2_quad_clean.evt |
| Size (bytes) | 513,452,160 | 63,800,640 |
| Size | 489.7 MB | 60.8 MB |
| Events in quadrant A | 3,365,601 | 381,463 |
| Events in quadrant B | 4,179,074 | 379,095 |
| Events in quadrant C | 3,073,887 | 379,105 |
| Events in quadrant D | 4,505,976 | 354,169 |
| Mode SS | |||
|---|---|---|---|
| Quadrant | BADHDUFLAG | Total packets | Discarded packets |
| A | 0 | 128 | 0 |
| B | 0 | 128 | 0 |
| C | 0 | 128 | 0 |
| D | 0 | 128 | 0 |
| Mode M9 | |||
|---|---|---|---|
| Quadrant | BADHDUFLAG | Total packets | Discarded packets |
| A | 0 | 23 | 0 |
| B | 0 | 23 | 0 |
| C | 0 | 23 | 0 |
| D | 0 | 24 | 0 |
| Mode M0 | |||
|---|---|---|---|
| Quadrant | BADHDUFLAG | Total packets | Discarded packets |
| A | 0 | 13717 | 3 |
| B | 0 | 16329 | 2 |
| C | 0 | 13067 | 2 |
| D | 0 | 17499 | 2 |
| Quadrant | Total seconds | Saturated seconds | Saturation percentage |
|---|---|---|---|
| A | 6270 | 75 | 1.196172% |
| B | 6270 | 318 | 5.071770% |
| C | 6270 | 42 | 0.669856% |
| D | 6270 | 281 | 4.481659% |
Noise dominated data is calculated using 1-second bins in cleaned event files. If a bin has >2000 counts, and if more than 50% of those come from <1% of pixels, then it is considered to be noise-dominated and hence unusable.
| Quadrant | # 1 sec bins | Bins with >0 counts | Bins with >2000 counts | High rate bins dominated by noise | Noise dominated (total time) | Noise dominated (detector-on time) | Marked lightcurve |
|---|---|---|---|---|---|---|---|
| A | 7580 | 6271 | 1 | 1 | 0.01% | 0.02% | 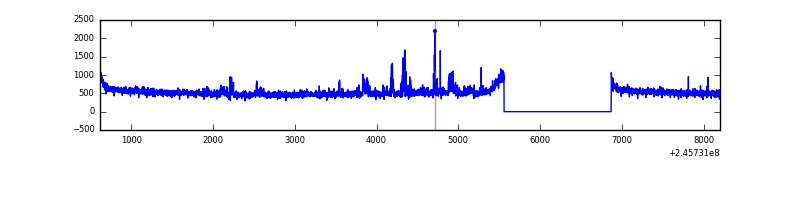 |
| B | 7580 | 6271 | 161 | 161 | 2.12% | 2.57% | 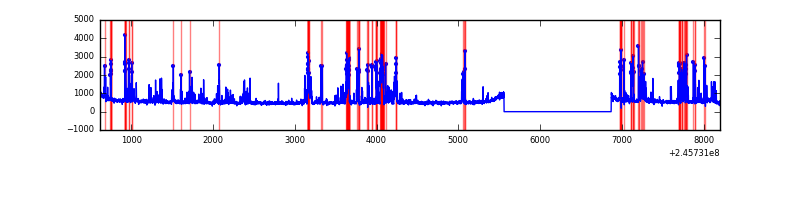 |
| C | 7580 | 6271 | 0 | 0 | 0.00% | 0.00% |  |
| D | 7580 | 6271 | 237 | 237 | 3.13% | 3.78% | 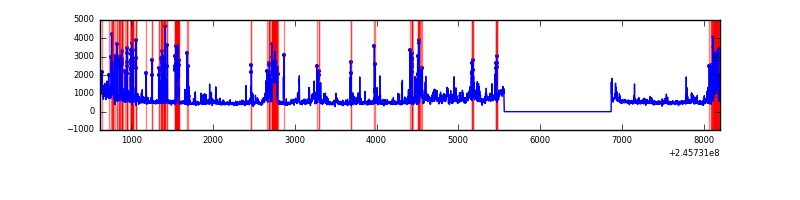 |
Top three noisy pixels from each quadrant. If the there are fewer than three noisy pixels in the level2.evt file, extra rows are filled as -1
| Pixel properties | Quadrant properties | ||||||
|---|---|---|---|---|---|---|---|
| Quadrant | DetID | PixID | Counts | Sigma | Mean | Median | Sigma |
| A | 8 | 15 | 148856 | 899.27 | 819 | 803 | 164.6 |
| A | 15 | 174 | 57234 | 342.76 | 819 | 803 | 164.6 |
| A | 0 | 226 | 7397 | 40.05 | 819 | 803 | 164.6 |
| B | 4 | 239 | 942960 | 6202.86 | 811 | 793 | 151.9 |
| B | 15 | 204 | 24508 | 156.13 | 811 | 793 | 151.9 |
| B | 0 | 214 | 23680 | 150.68 | 811 | 793 | 151.9 |
| C | 13 | 61 | 5751 | 27.58 | 787 | 795 | 179.7 |
| C | 14 | 234 | 2575 | 9.9 | 787 | 795 | 179.7 |
| C | 5 | 207 | 2043 | 6.94 | 787 | 795 | 179.7 |
| D | 10 | 253 | 609239 | 3344.25 | 770 | 751 | 182.0 |
| D | 11 | 129 | 458910 | 2518.04 | 770 | 751 | 182.0 |
| D | 2 | 136 | 220260 | 1206.42 | 770 | 751 | 182.0 |
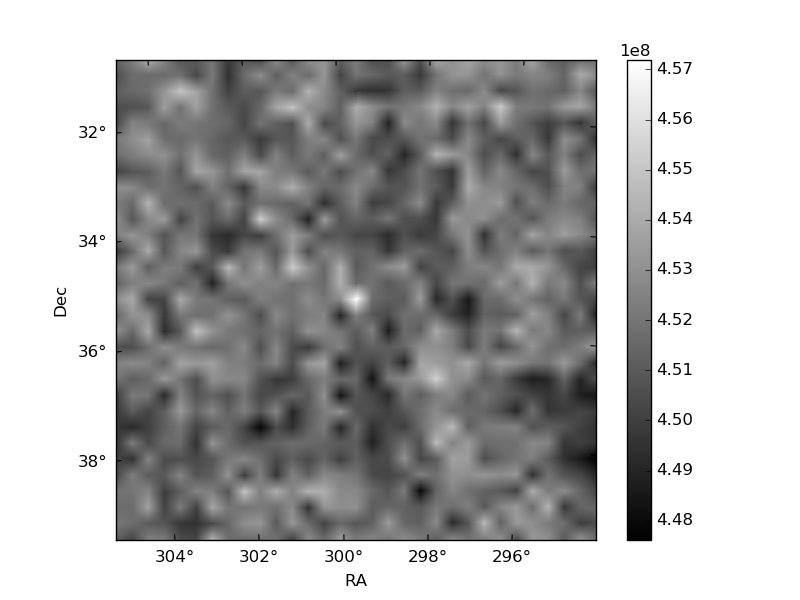
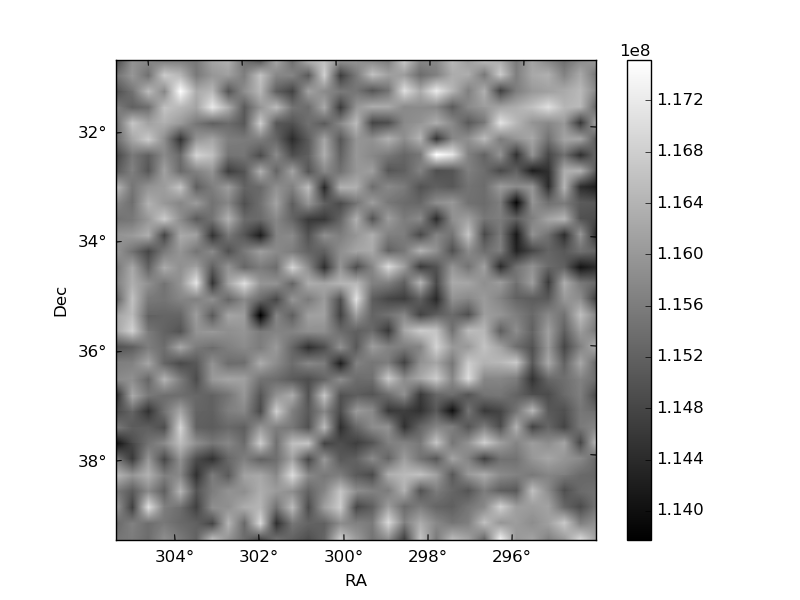
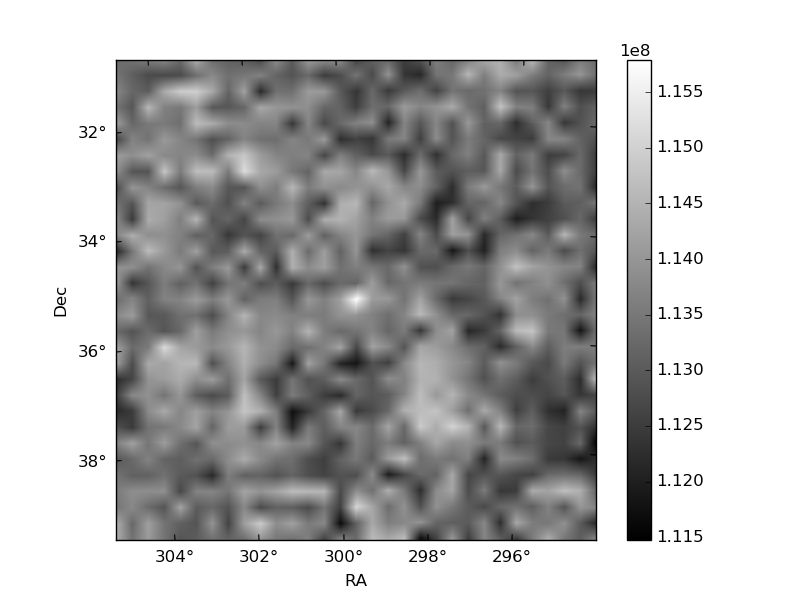
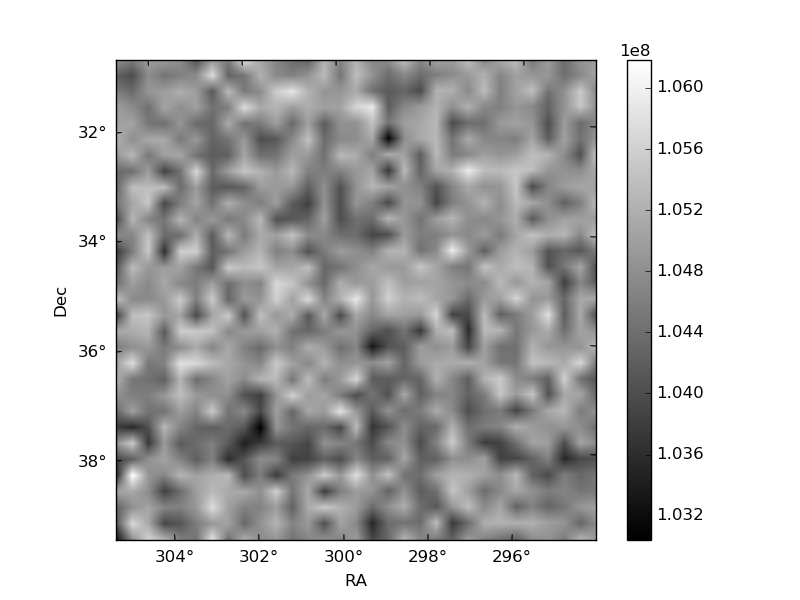
Histogram calculated using DETX and DETY for each event in the final _common_clean file
| Quadrant A |  |
 |
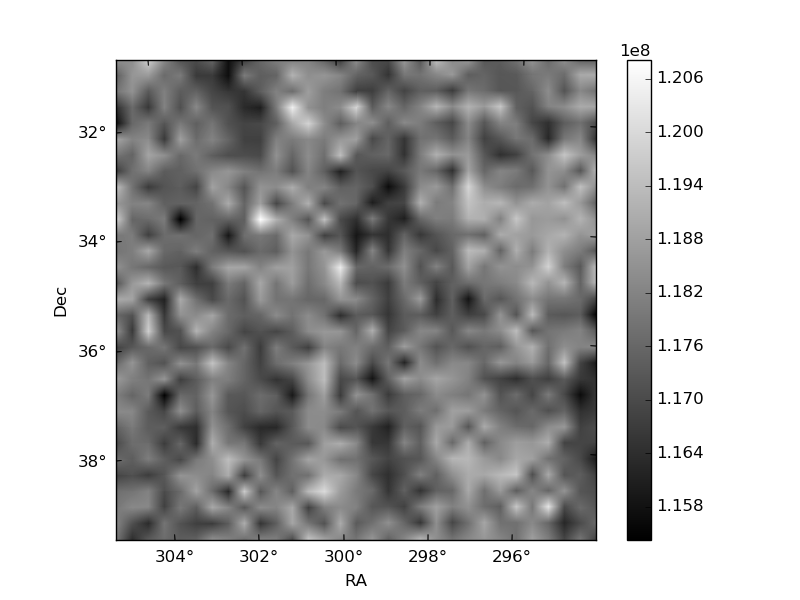
Quadrant B |
|---|---|---|---|
| Quadrant D | 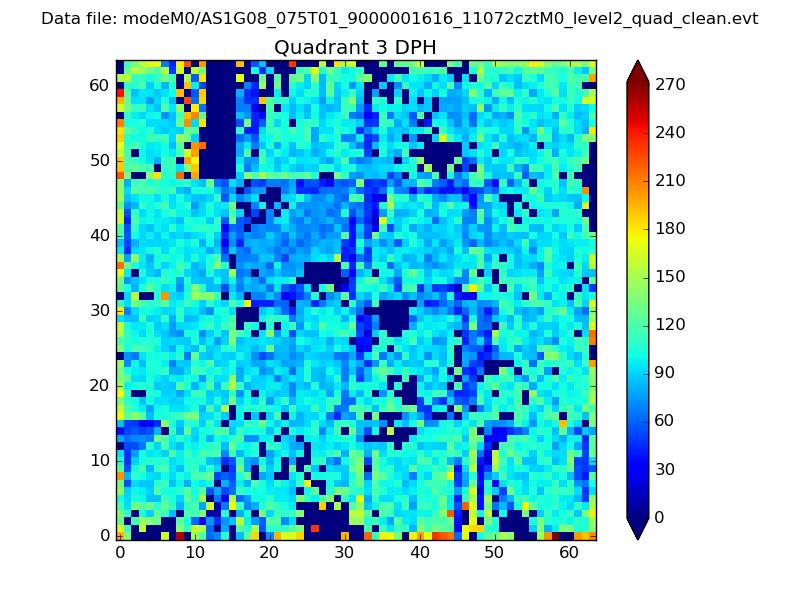 |
 |
Quadrant C |
| Plot type | Count rate plots | Images |
|---|---|---|
| Comparison with Poisson distribution Blue bars denote a histogram of data divided into 1 sec bins. Red curve is a Poisson curve with rate = median count rate of data. |
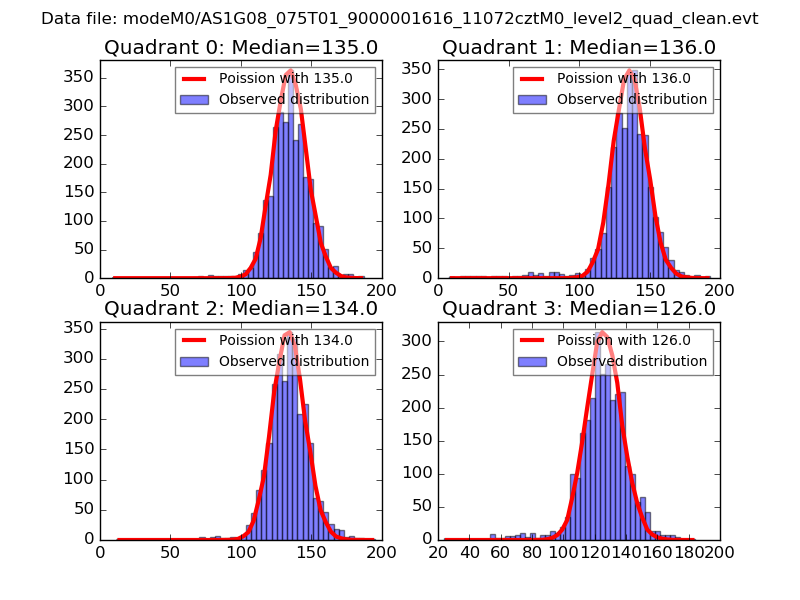 |
 |
| Quadrant-wise count rates Data is divided into 100 sec bins |
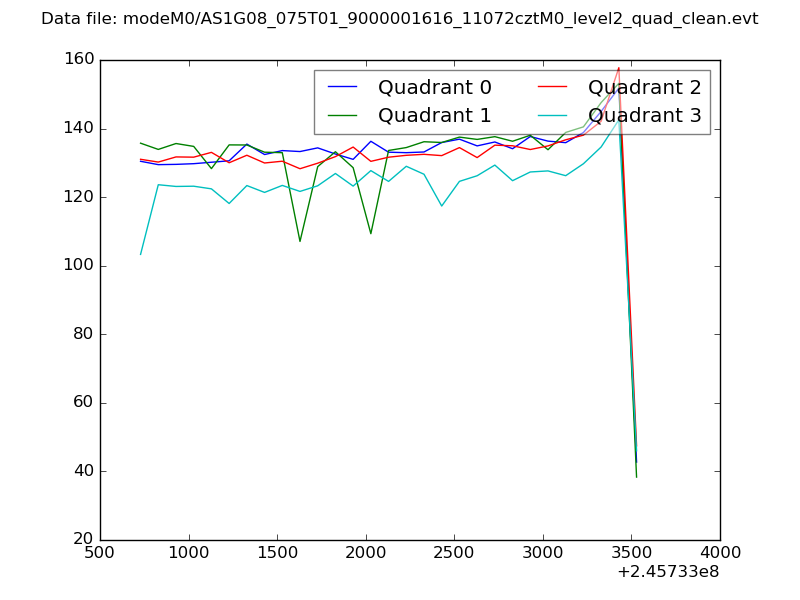 |
|
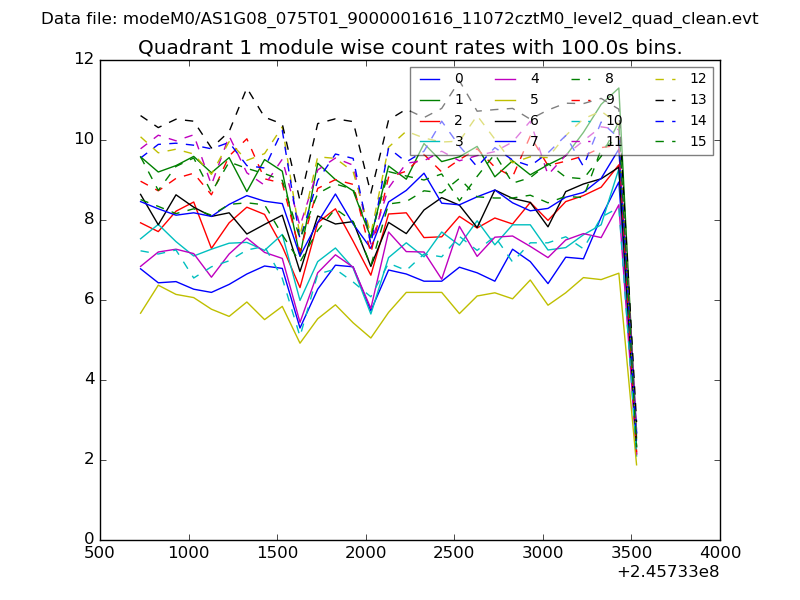
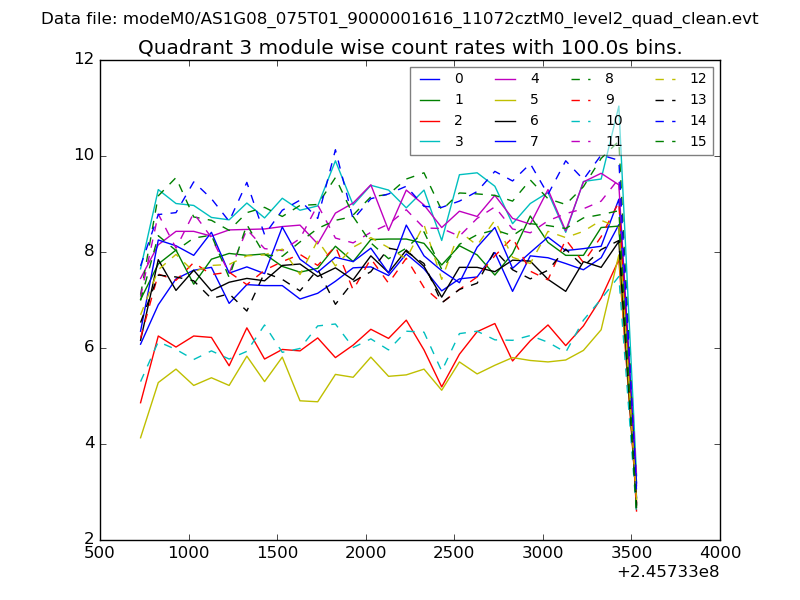
| Module-wise count rates for Quadrant A Data is divided into 100 sec bins |
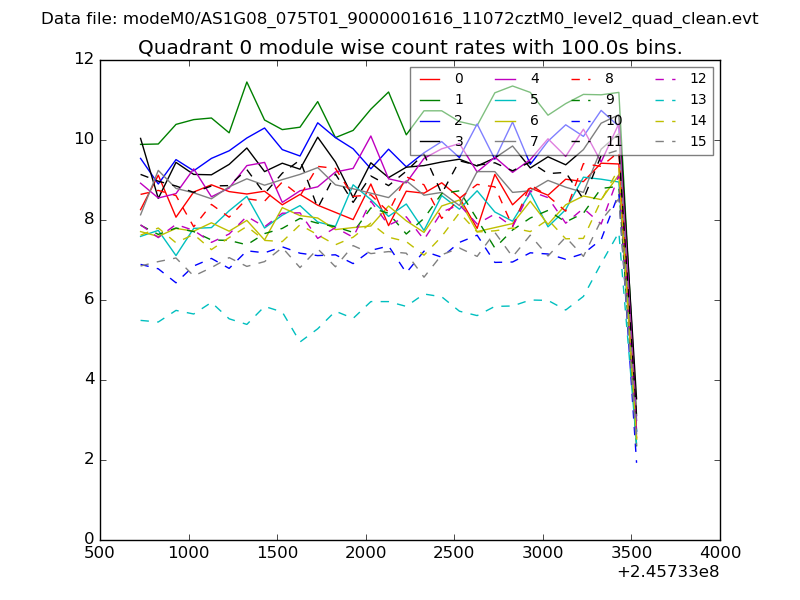 |
 |
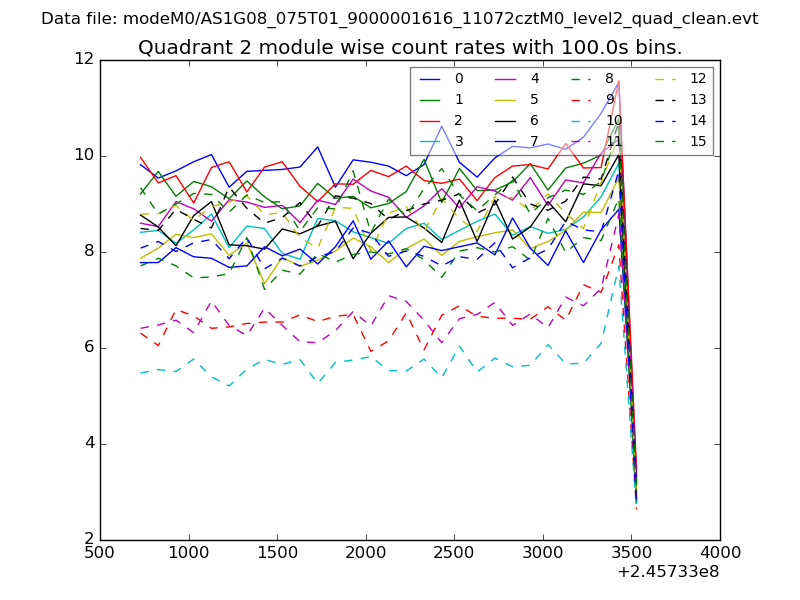
| Module-wise count rates for Quadrant B Data is divided into 100 sec bins |
 |
 |
| Module-wise count rates for Quadrant C Data is divided into 100 sec bins |
 |
 |
| Module-wise count rates for Quadrant D Data is divided into 100 sec bins |
 |
 |
| Parameter | Plot |
|---|---|
| CZT HV Monitor | 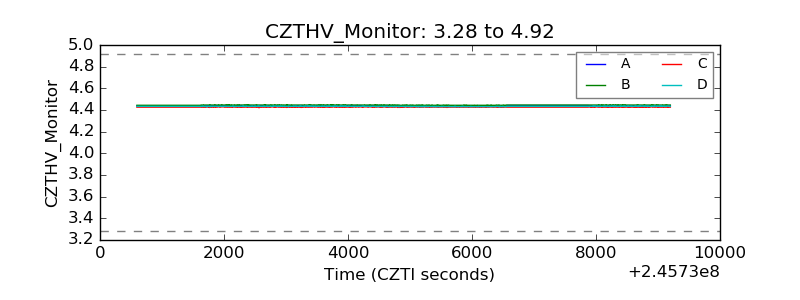 |
| D_VDD | 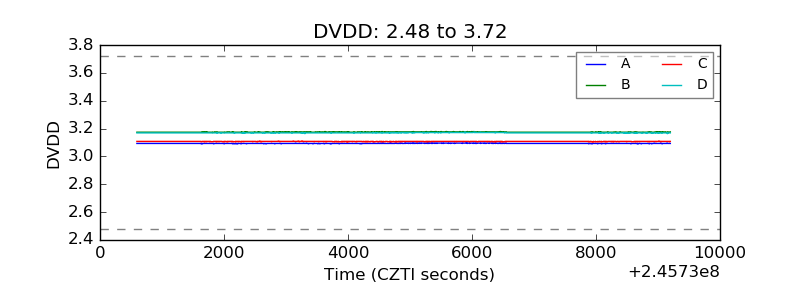 |
| Temperature 1 |  |
| Veto HV Monitor | 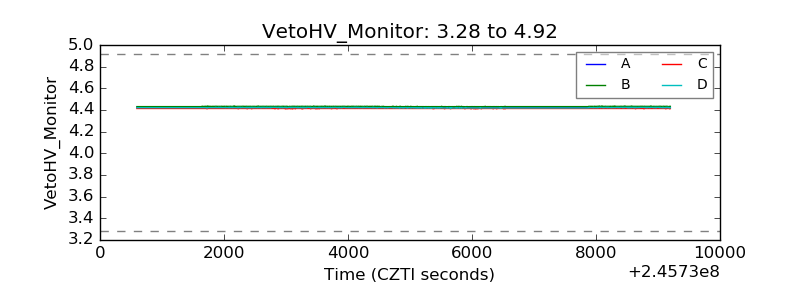 |
| Veto LLD | 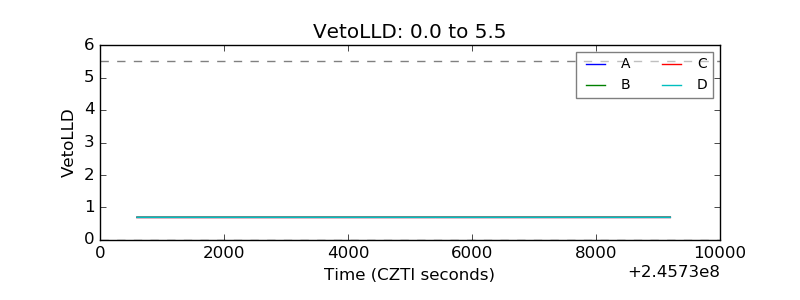 |
| Alpha Counter | 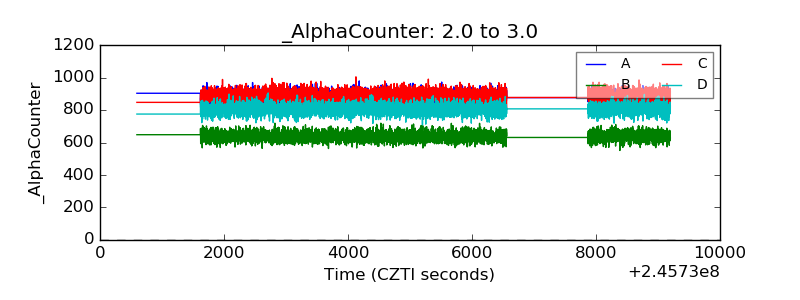 |
| _CPM_Rate | 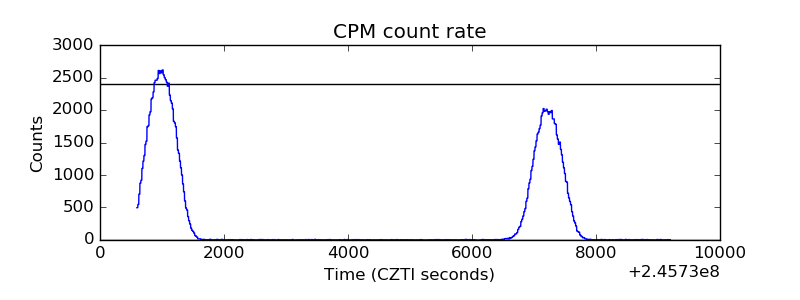 |
| CZT Counter | 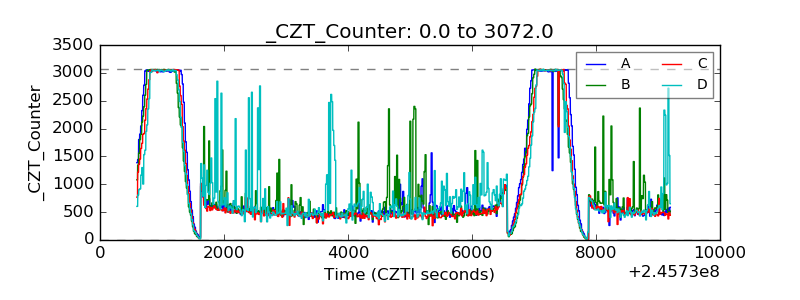 |
| +2.5 Volts monitor |  |
| +5 Volts monitor | 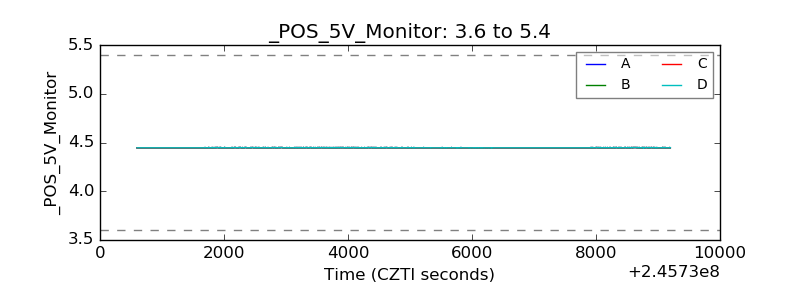 |
| _ROLL_ROT | 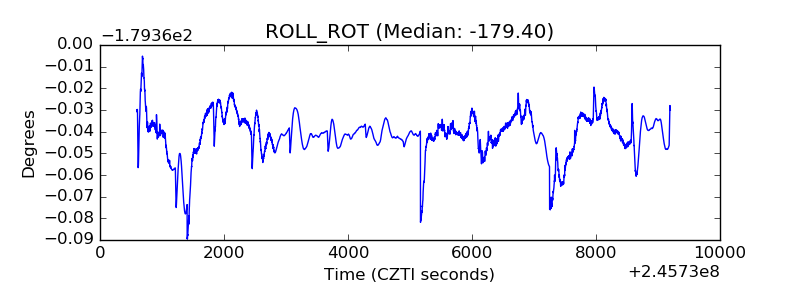 |
| _Roll_DEC | 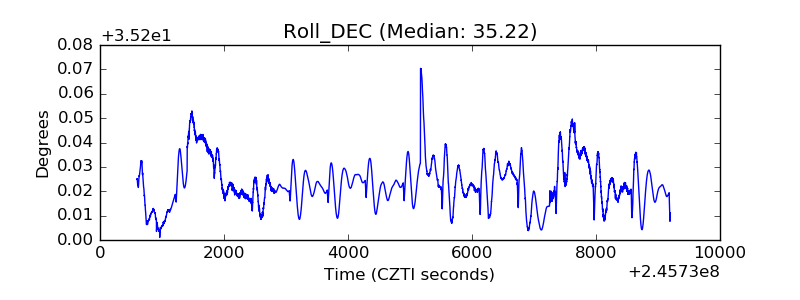 |
| _Roll_RA | 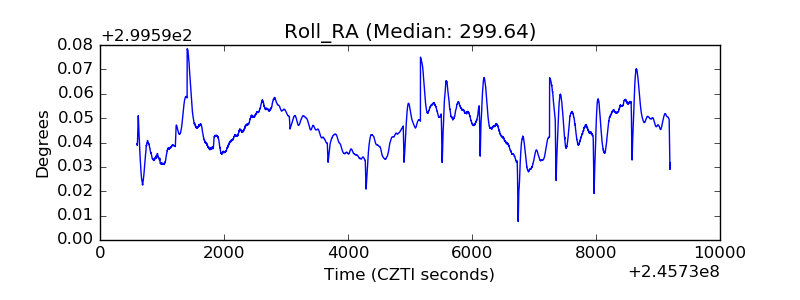 |
| Veto Counter | 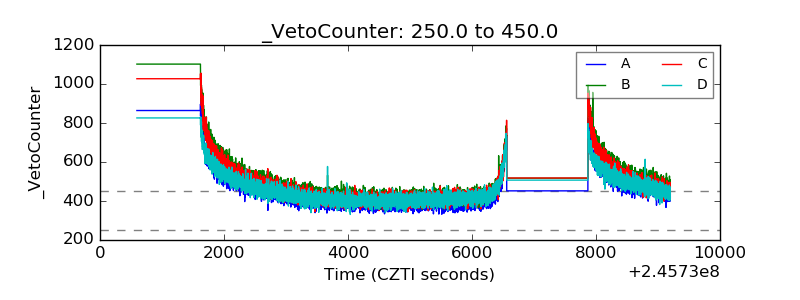 |