| Param | Original file | Final file |
|---|---|---|
| Filename | modeM0/AS1G08_075T01_9000001616_11073cztM0_level2.evt | modeM0/AS1G08_075T01_9000001616_11073cztM0_level2_quad_clean.evt |
| Size (bytes) | 501,318,720 | 71,772,480 |
| Size | 478.1 MB | 68.4 MB |
| Events in quadrant A | 3,382,652 | 443,816 |
| Events in quadrant B | 4,350,438 | 441,752 |
| Events in quadrant C | 3,065,541 | 439,140 |
| Events in quadrant D | 3,957,967 | 410,229 |
| Mode SS | |||
|---|---|---|---|
| Quadrant | BADHDUFLAG | Total packets | Discarded packets |
| A | 0 | 128 | 0 |
| B | 0 | 128 | 0 |
| C | 0 | 128 | 0 |
| D | 0 | 128 | 0 |
| Mode M9 | |||
|---|---|---|---|
| Quadrant | BADHDUFLAG | Total packets | Discarded packets |
| A | 0 | 13 | 0 |
| B | 0 | 13 | 0 |
| C | 0 | 13 | 0 |
| D | 0 | 13 | 0 |
| Mode M0 | |||
|---|---|---|---|
| Quadrant | BADHDUFLAG | Total packets | Discarded packets |
| A | 0 | 13838 | 3 |
| B | 0 | 16867 | 2 |
| C | 0 | 13070 | 2 |
| D | 0 | 15751 | 2 |
| Quadrant | Total seconds | Saturated seconds | Saturation percentage |
|---|---|---|---|
| A | 6276 | 102 | 1.625239% |
| B | 6276 | 352 | 5.608668% |
| C | 6276 | 54 | 0.860421% |
| D | 6277 | 158 | 2.517126% |
Noise dominated data is calculated using 1-second bins in cleaned event files. If a bin has >2000 counts, and if more than 50% of those come from <1% of pixels, then it is considered to be noise-dominated and hence unusable.
| Quadrant | # 1 sec bins | Bins with >0 counts | Bins with >2000 counts | High rate bins dominated by noise | Noise dominated (total time) | Noise dominated (detector-on time) | Marked lightcurve |
|---|---|---|---|---|---|---|---|
| A | 7561 | 6277 | 0 | 0 | 0.00% | 0.00% | 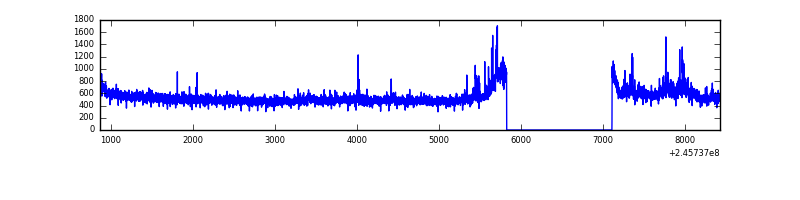 |
| B | 7561 | 6276 | 164 | 164 | 2.17% | 2.61% | 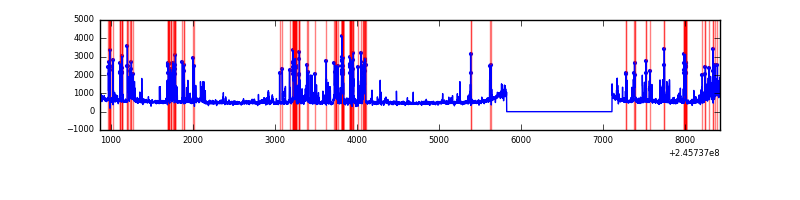 |
| C | 7561 | 6277 | 0 | 0 | 0.00% | 0.00% | 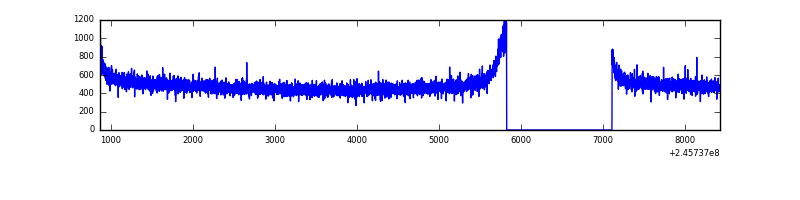 |
| D | 7562 | 6278 | 87 | 87 | 1.15% | 1.39% | 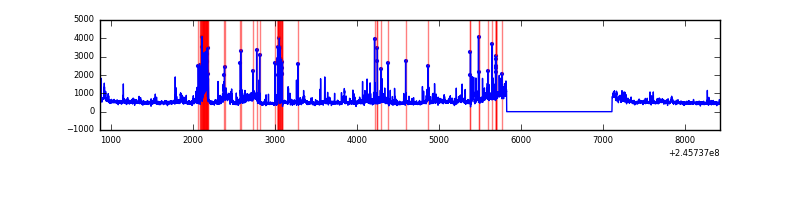 |
Top three noisy pixels from each quadrant. If the there are fewer than three noisy pixels in the level2.evt file, extra rows are filled as -1
| Pixel properties | Quadrant properties | ||||||
|---|---|---|---|---|---|---|---|
| Quadrant | DetID | PixID | Counts | Sigma | Mean | Median | Sigma |
| A | 8 | 15 | 218199 | 1317.83 | 818 | 803 | 165.0 |
| A | 0 | 226 | 7428 | 40.16 | 818 | 803 | 165.0 |
| A | 12 | 194 | 6440 | 34.17 | 818 | 803 | 165.0 |
| B | 4 | 239 | 1087337 | 7125.52 | 808 | 789 | 152.5 |
| B | 0 | 214 | 41821 | 269.09 | 808 | 789 | 152.5 |
| B | 15 | 204 | 27805 | 177.17 | 808 | 789 | 152.5 |
| C | 13 | 61 | 5833 | 27.87 | 786 | 791 | 180.9 |
| C | 14 | 67 | 2275 | 8.2 | 786 | 791 | 180.9 |
| C | 3 | 202 | 1978 | 6.56 | 786 | 791 | 180.9 |
| D | 11 | 129 | 431480 | 2315.05 | 775 | 755 | 186.1 |
| D | 10 | 253 | 363418 | 1949.23 | 775 | 755 | 186.1 |
| D | 13 | 104 | 73557 | 391.29 | 775 | 755 | 186.1 |
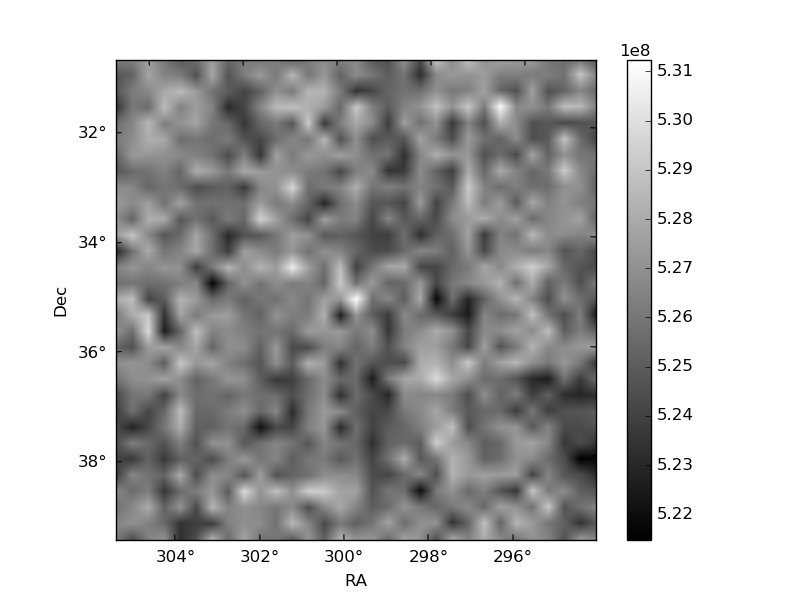
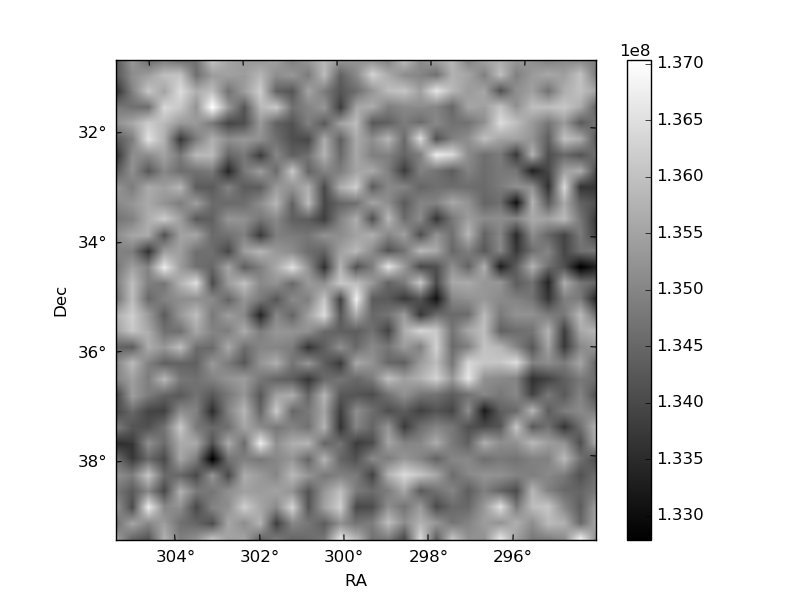
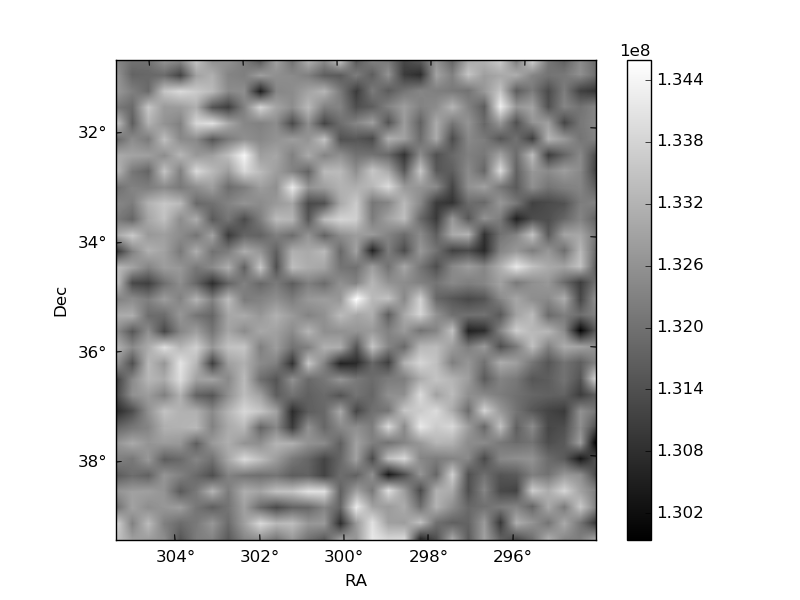
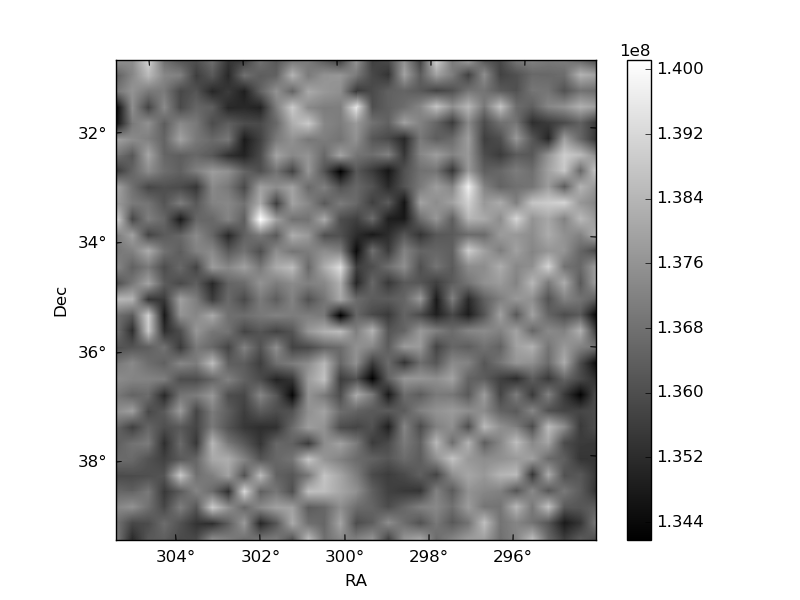
Histogram calculated using DETX and DETY for each event in the final _common_clean file
| Quadrant A | 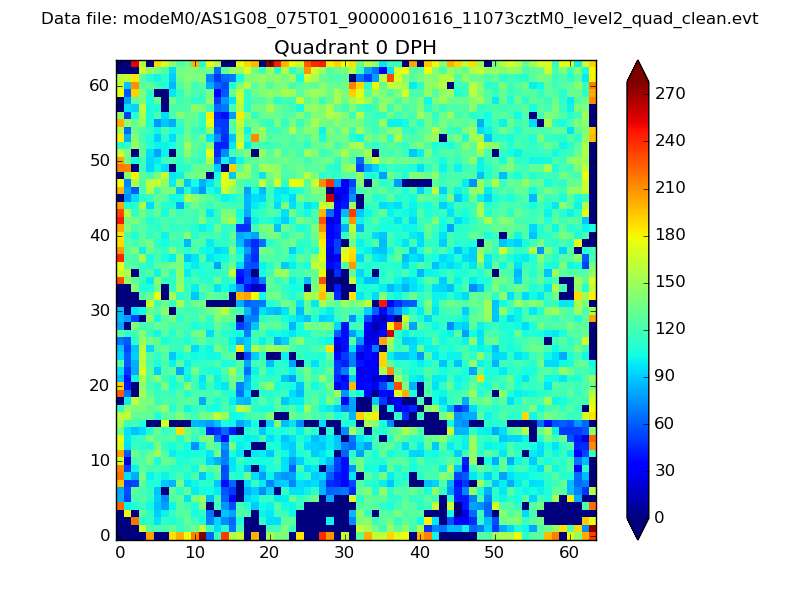 |
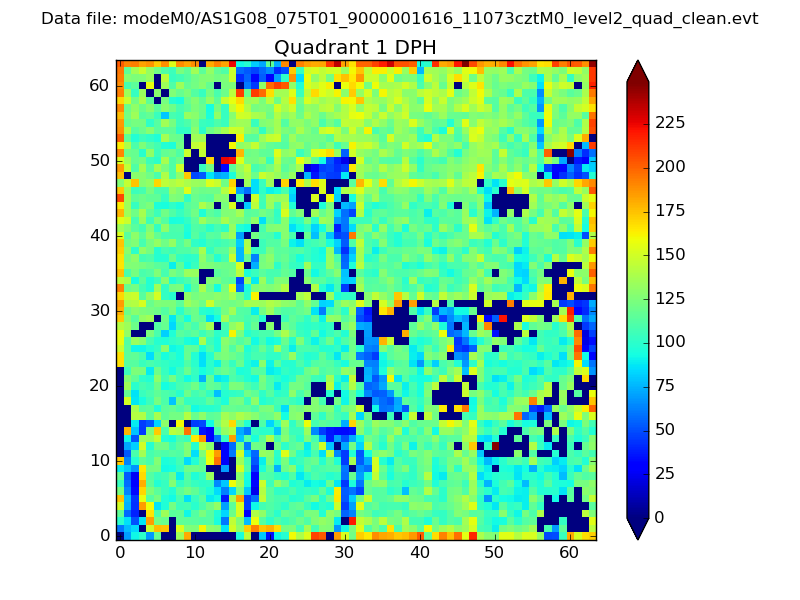 |
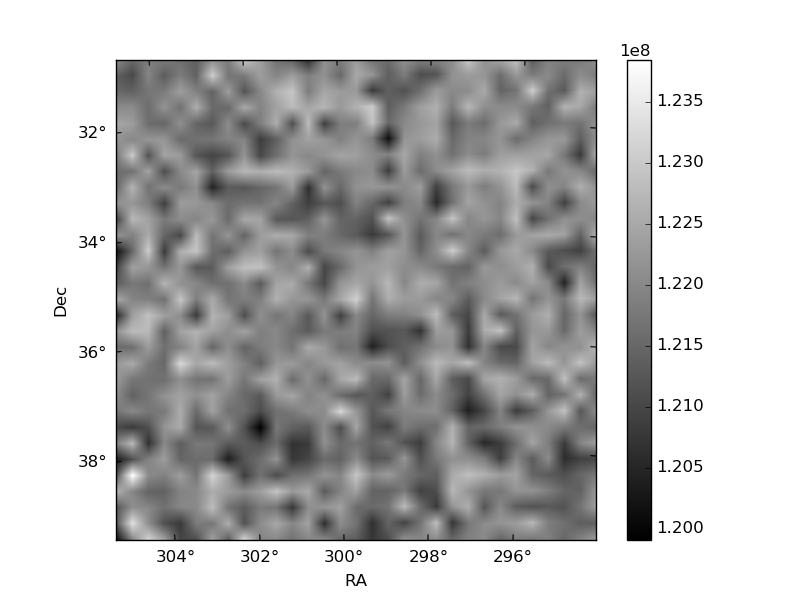
Quadrant B |
|---|---|---|---|
| Quadrant D | 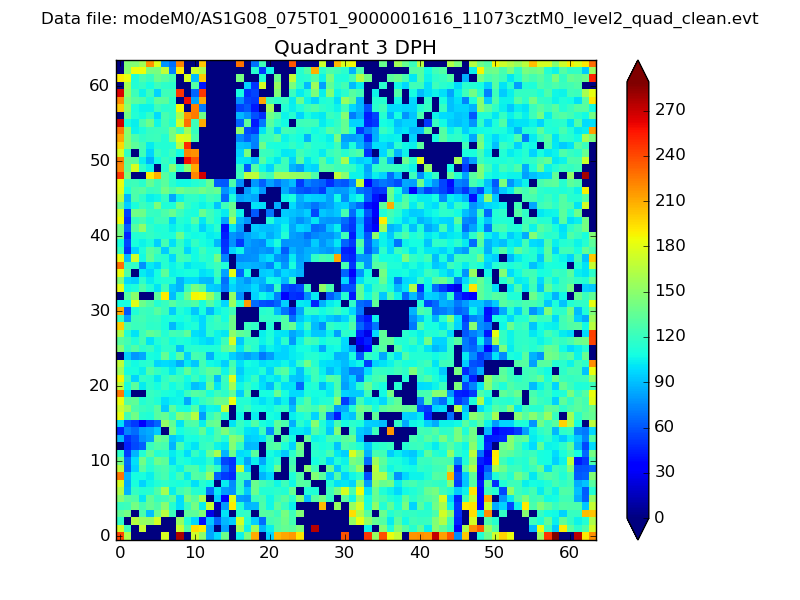 |
 |
Quadrant C |
| Plot type | Count rate plots | Images |
|---|---|---|
| Comparison with Poisson distribution Blue bars denote a histogram of data divided into 1 sec bins. Red curve is a Poisson curve with rate = median count rate of data. |
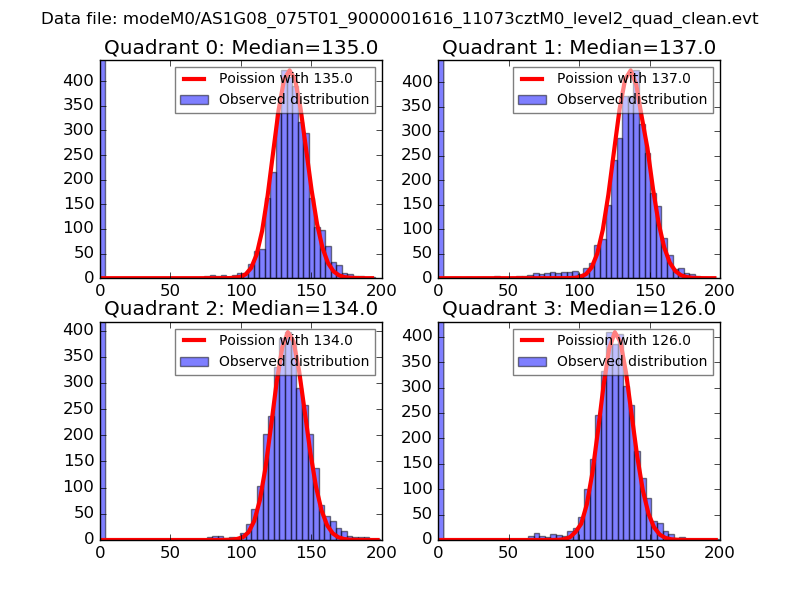 |
 |
| Quadrant-wise count rates Data is divided into 100 sec bins |
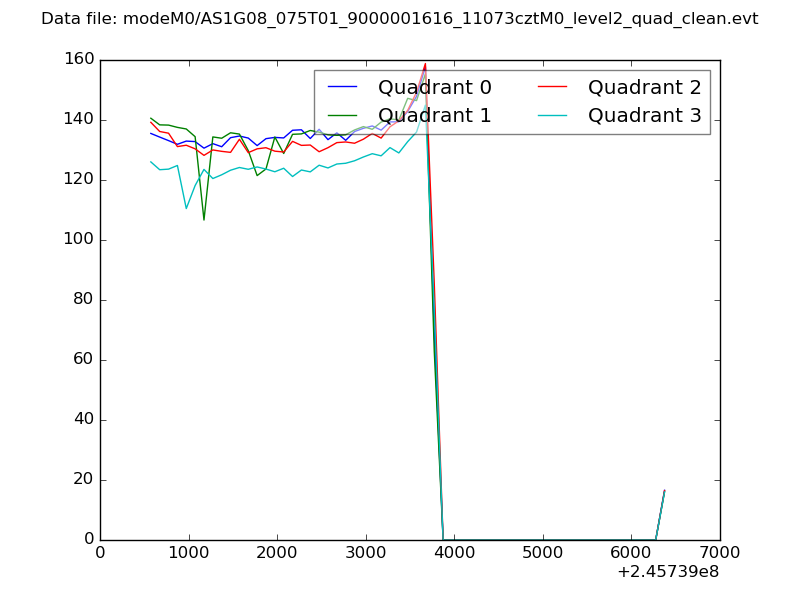 |
|
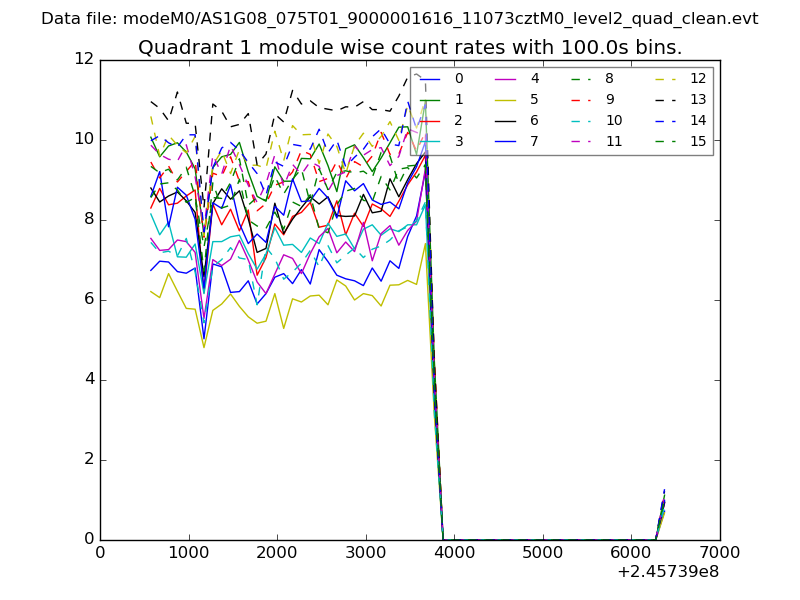
| Module-wise count rates for Quadrant A Data is divided into 100 sec bins |
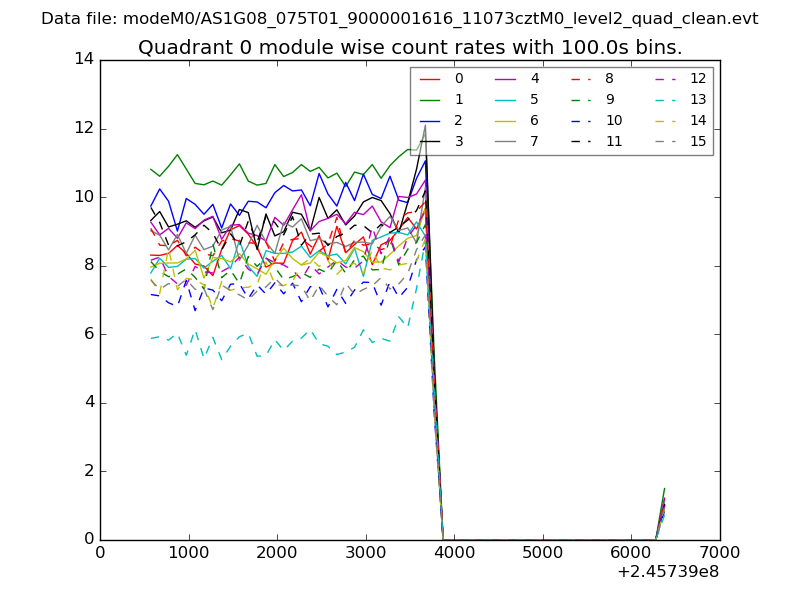 |
 |
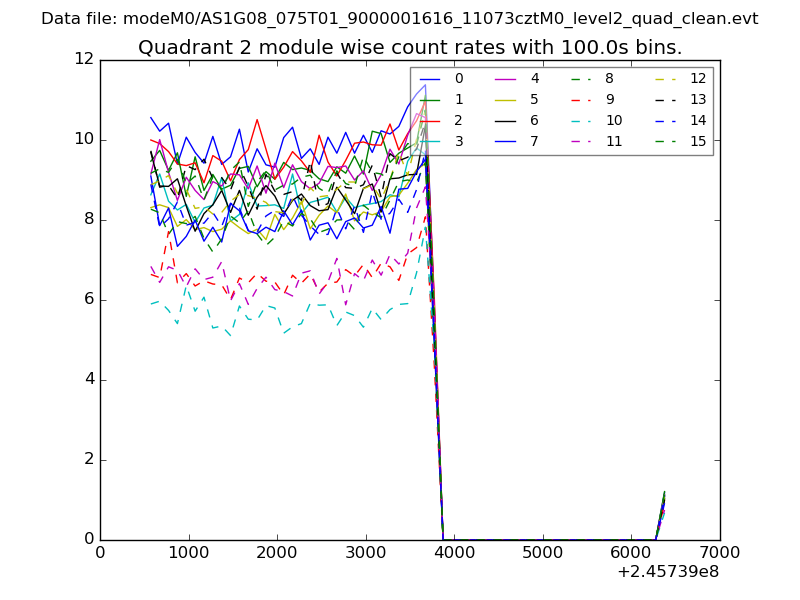
| Module-wise count rates for Quadrant B Data is divided into 100 sec bins |
 |
 |
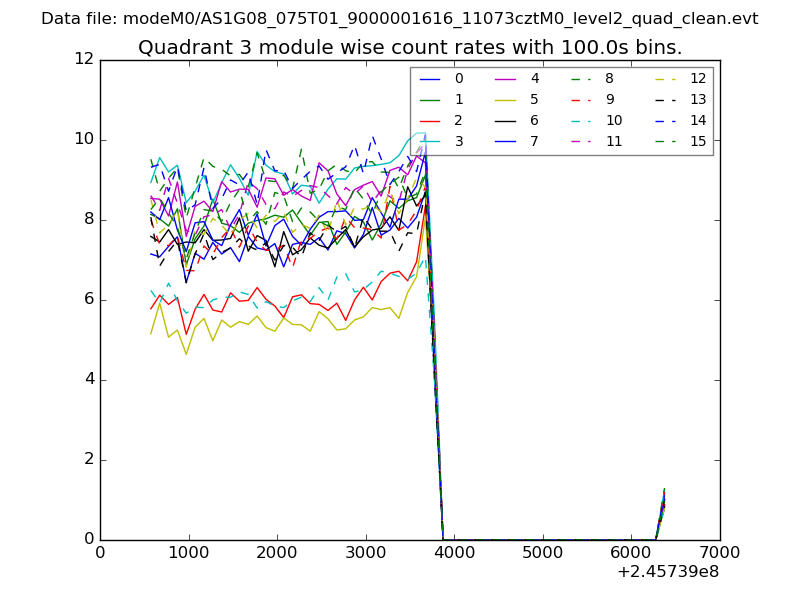
| Module-wise count rates for Quadrant C Data is divided into 100 sec bins |
 |
 |
| Module-wise count rates for Quadrant D Data is divided into 100 sec bins |
 |
 |
| Parameter | Plot |
|---|---|
| CZT HV Monitor | 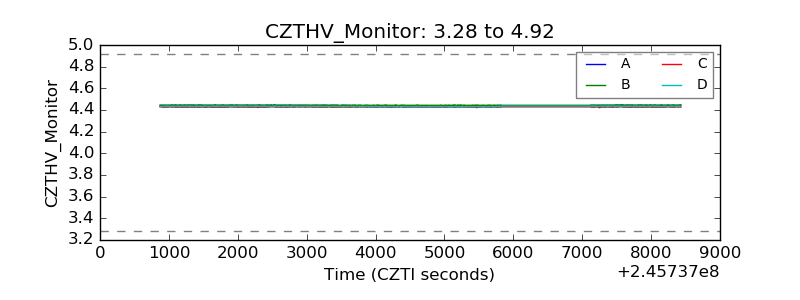 |
| D_VDD | 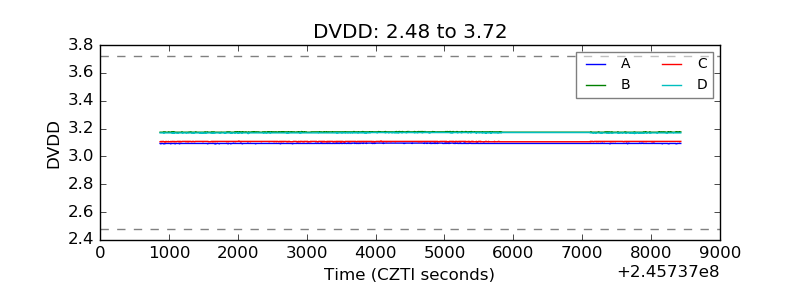 |
| Temperature 1 |  |
| Veto HV Monitor | 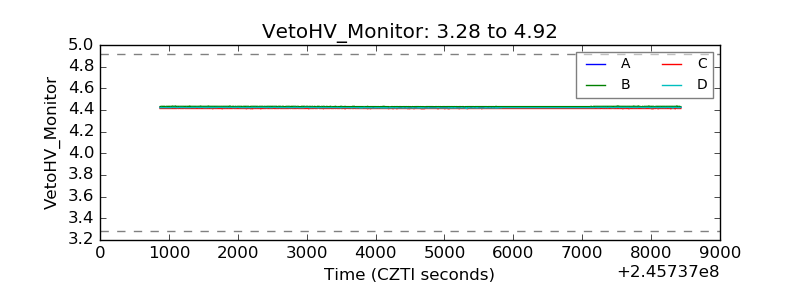 |
| Veto LLD | 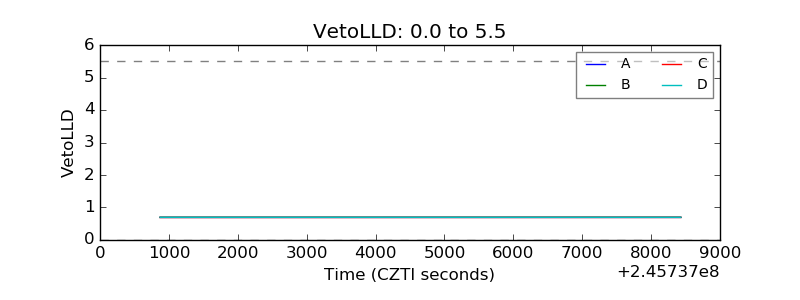 |
| Alpha Counter | 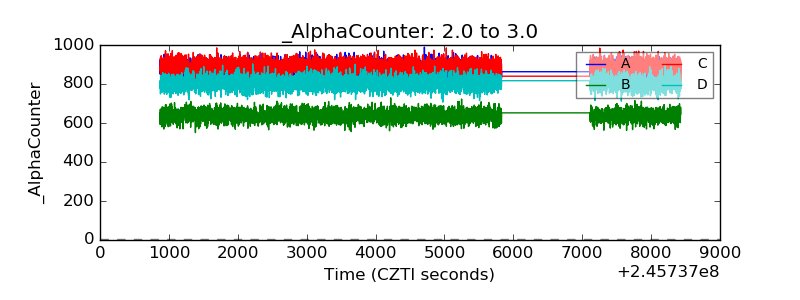 |
| _CPM_Rate | 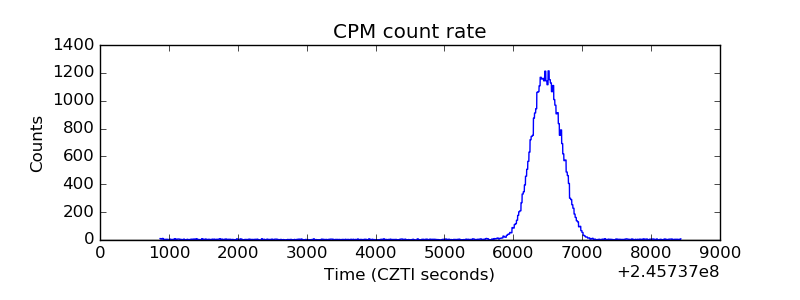 |
| CZT Counter |  |
| +2.5 Volts monitor |  |
| +5 Volts monitor | 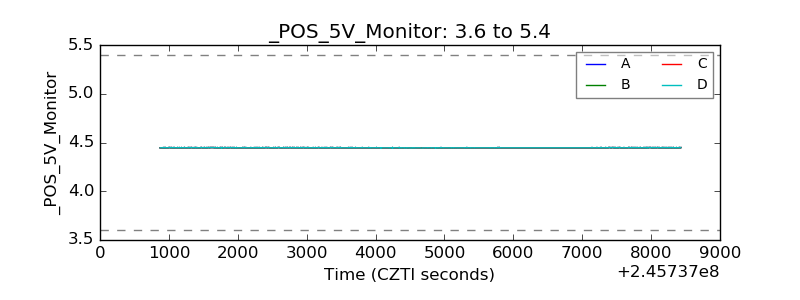 |
| _ROLL_ROT | 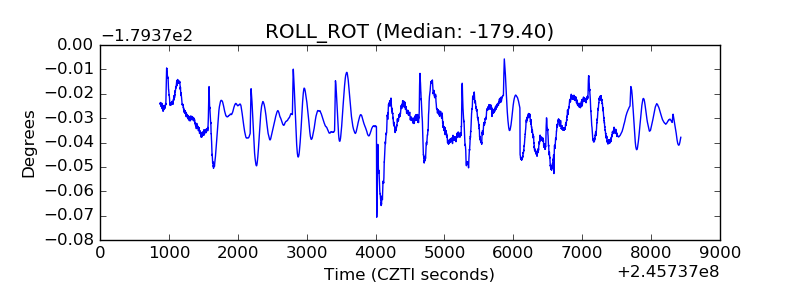 |
| _Roll_DEC | 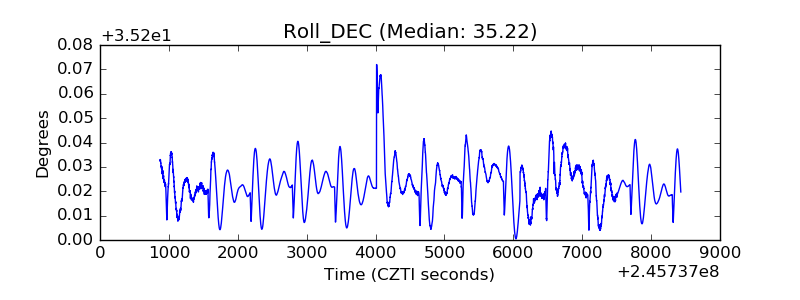 |
| _Roll_RA | 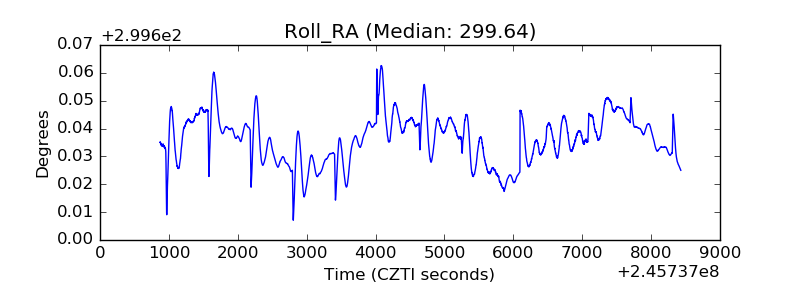 |
| Veto Counter | 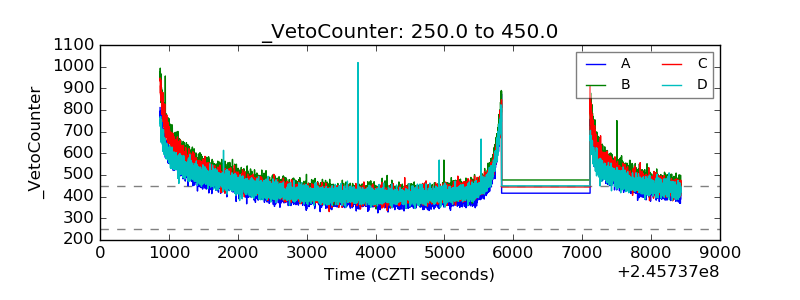 |