| Param | Original file | Final file |
|---|---|---|
| Filename | modeM0/AS1G08_075T01_9000001616_11074cztM0_level2.evt | modeM0/AS1G08_075T01_9000001616_11074cztM0_level2_quad_clean.evt |
| Size (bytes) | 509,307,840 | 85,512,960 |
| Size | 485.7 MB | 81.6 MB |
| Events in quadrant A | 3,841,772 | 544,186 |
| Events in quadrant B | 4,231,374 | 547,511 |
| Events in quadrant C | 3,093,324 | 541,834 |
| Events in quadrant D | 3,821,679 | 507,453 |
| Mode SS | |||
|---|---|---|---|
| Quadrant | BADHDUFLAG | Total packets | Discarded packets |
| A | 0 | 130 | 0 |
| B | 0 | 130 | 0 |
| C | 0 | 130 | 0 |
| D | 0 | 130 | 0 |
| Mode M9 | |||
|---|---|---|---|
| Quadrant | BADHDUFLAG | Total packets | Discarded packets |
| A | 0 | 12 | 0 |
| B | 0 | 12 | 0 |
| C | 0 | 12 | 0 |
| D | 0 | 13 | 0 |
| Mode M0 | |||
|---|---|---|---|
| Quadrant | BADHDUFLAG | Total packets | Discarded packets |
| A | 0 | 15564 | 3 |
| B | 0 | 16731 | 2 |
| C | 0 | 13422 | 2 |
| D | 0 | 15464 | 2 |
| Quadrant | Total seconds | Saturated seconds | Saturation percentage |
|---|---|---|---|
| A | 6429 | 143 | 2.224296% |
| B | 6429 | 388 | 6.035153% |
| C | 6429 | 88 | 1.368798% |
| D | 6429 | 215 | 3.344221% |
Noise dominated data is calculated using 1-second bins in cleaned event files. If a bin has >2000 counts, and if more than 50% of those come from <1% of pixels, then it is considered to be noise-dominated and hence unusable.
| Quadrant | # 1 sec bins | Bins with >0 counts | Bins with >2000 counts | High rate bins dominated by noise | Noise dominated (total time) | Noise dominated (detector-on time) | Marked lightcurve |
|---|---|---|---|---|---|---|---|
| A | 7554 | 6429 | 0 | 0 | 0.00% | 0.00% | 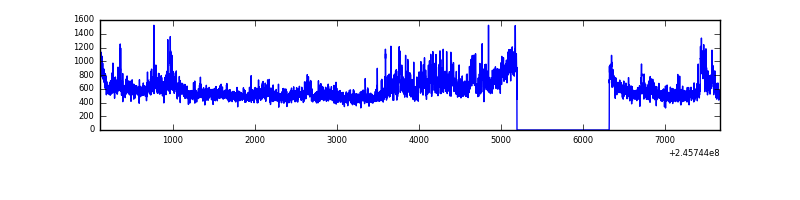 |
| B | 7554 | 6429 | 113 | 113 | 1.50% | 1.76% | 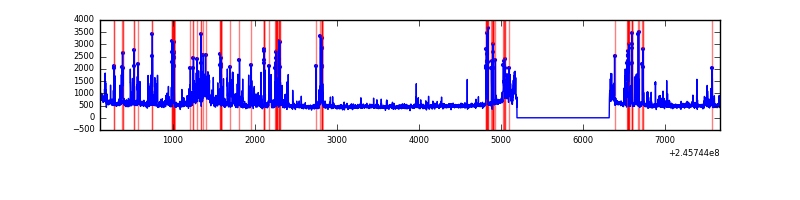 |
| C | 7554 | 6430 | 5 | 5 | 0.07% | 0.08% | 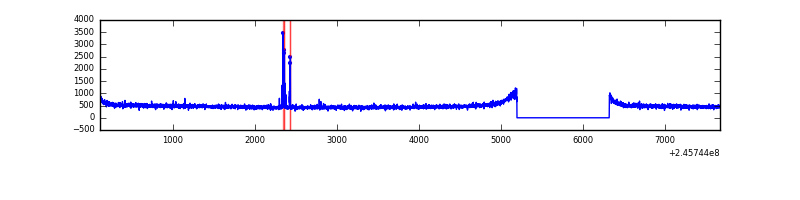 |
| D | 7554 | 6430 | 105 | 105 | 1.39% | 1.63% | 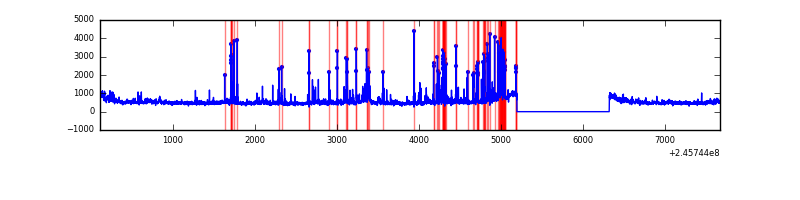 |
Top three noisy pixels from each quadrant. If the there are fewer than three noisy pixels in the level2.evt file, extra rows are filled as -1
| Pixel properties | Quadrant properties | ||||||
|---|---|---|---|---|---|---|---|
| Quadrant | DetID | PixID | Counts | Sigma | Mean | Median | Sigma |
| A | 8 | 15 | 677565 | 4097.68 | 817 | 802 | 165.2 |
| A | 11 | 29 | 11797 | 66.57 | 817 | 802 | 165.2 |
| A | 0 | 226 | 7317 | 39.45 | 817 | 802 | 165.2 |
| B | 4 | 239 | 1015460 | 6557.11 | 805 | 785 | 154.7 |
| B | 0 | 214 | 28701 | 180.4 | 805 | 785 | 154.7 |
| B | 10 | 16 | 21031 | 130.84 | 805 | 785 | 154.7 |
| C | 14 | 234 | 31800 | 170.42 | 785 | 791 | 182.0 |
| C | 13 | 61 | 5720 | 27.09 | 785 | 791 | 182.0 |
| C | 14 | 67 | 2316 | 8.38 | 785 | 791 | 182.0 |
| D | 10 | 253 | 465389 | 2506.62 | 777 | 755 | 185.4 |
| D | 11 | 129 | 237300 | 1276.12 | 777 | 755 | 185.4 |
| D | 8 | 195 | 61406 | 327.2 | 777 | 755 | 185.4 |
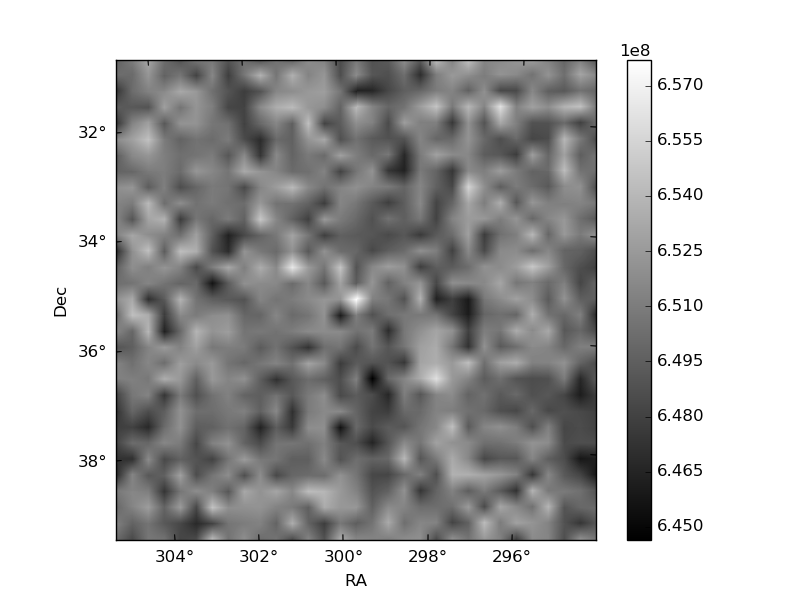
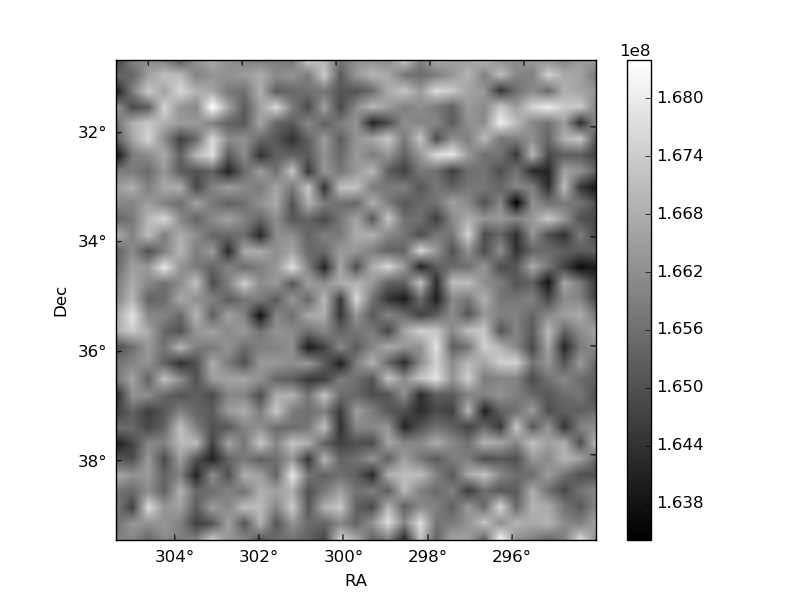
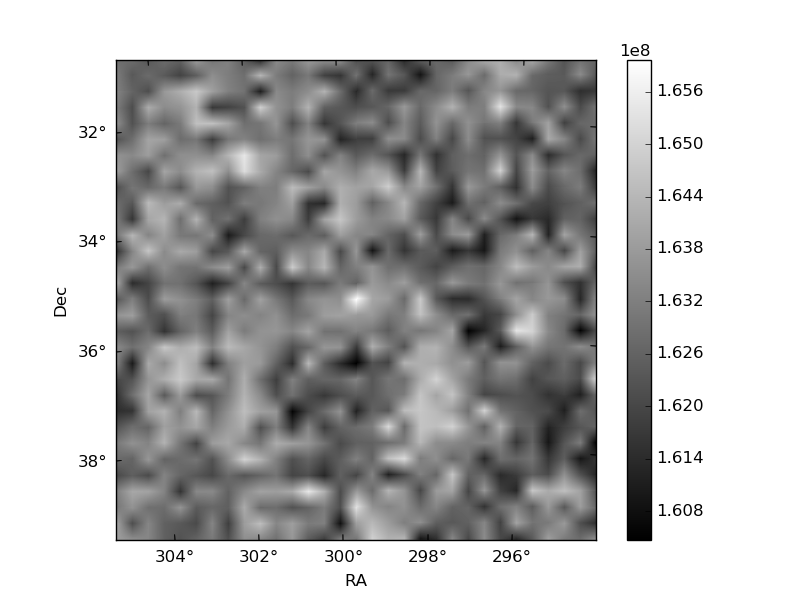
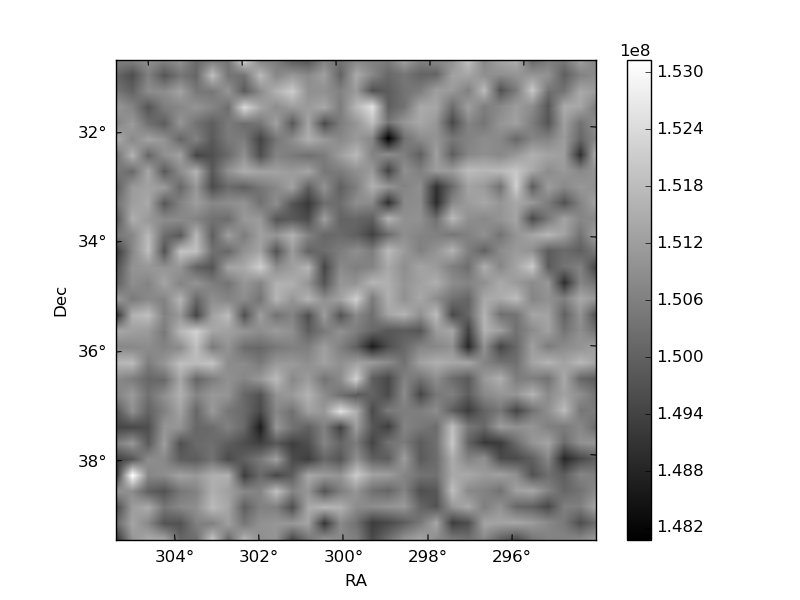
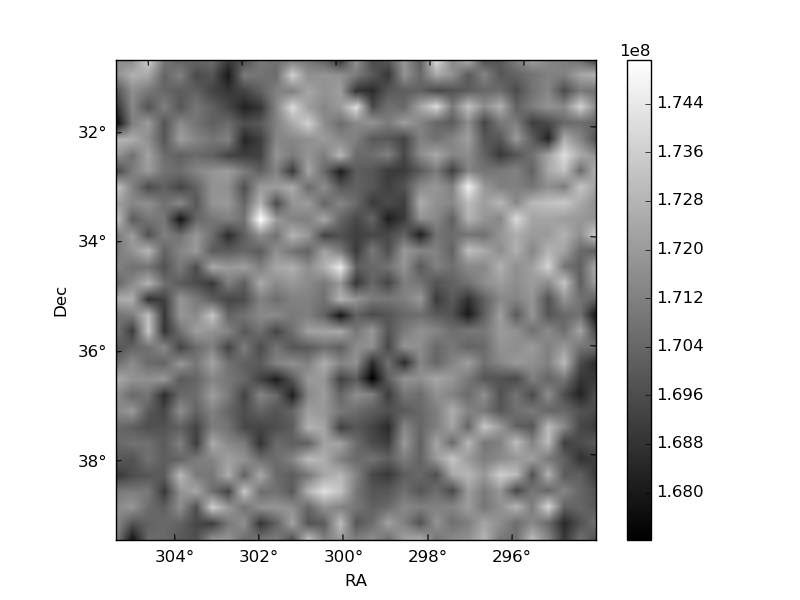
Histogram calculated using DETX and DETY for each event in the final _common_clean file
| Quadrant A | 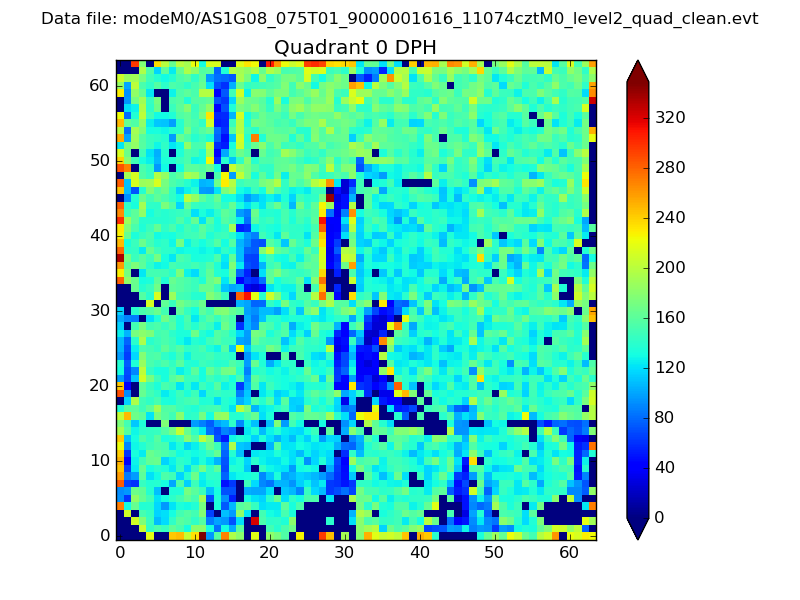 |
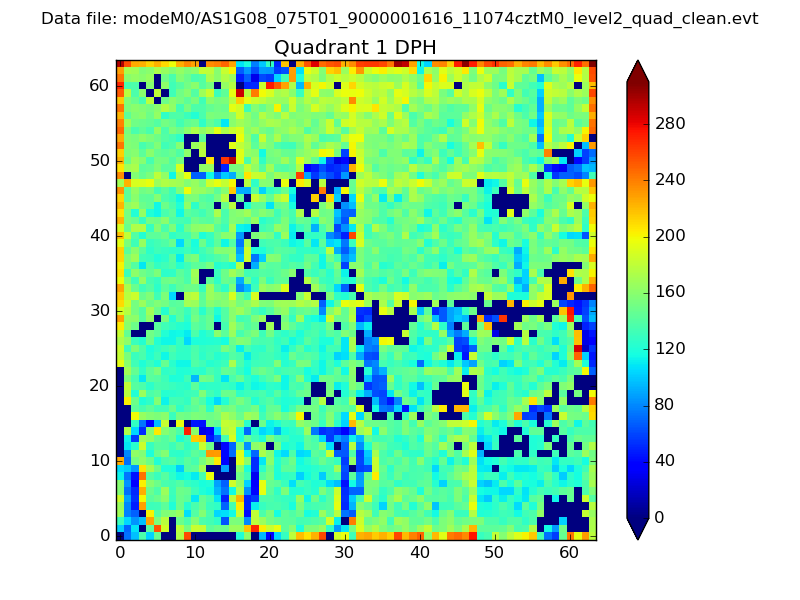 |
Quadrant B |
|---|---|---|---|
| Quadrant D | 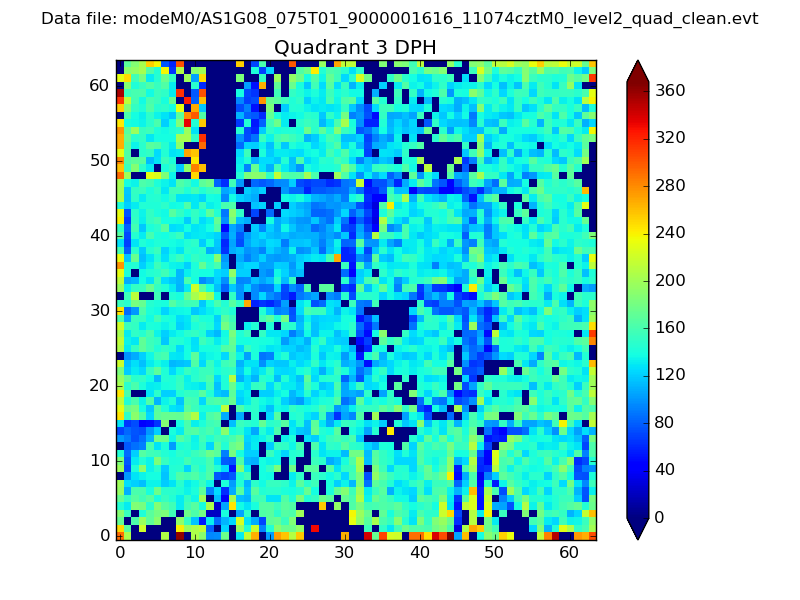 |
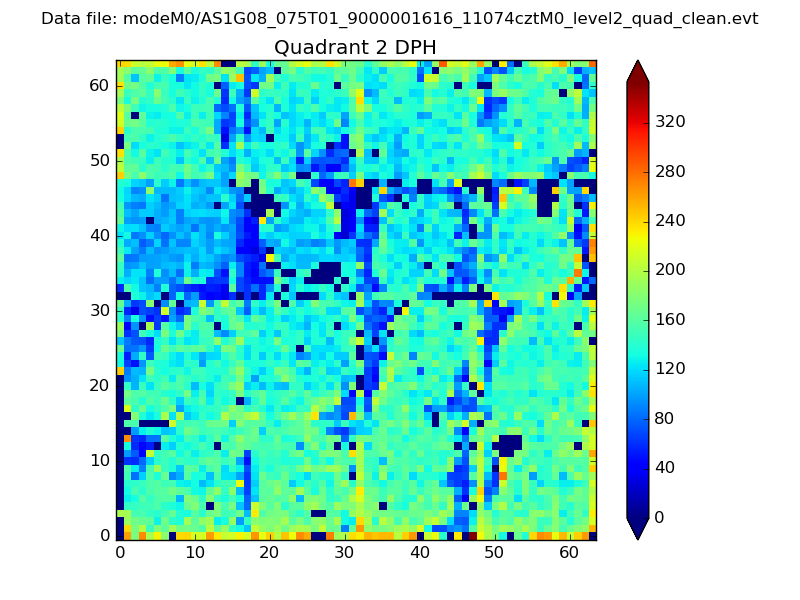 |
Quadrant C |
| Plot type | Count rate plots | Images |
|---|---|---|
| Comparison with Poisson distribution Blue bars denote a histogram of data divided into 1 sec bins. Red curve is a Poisson curve with rate = median count rate of data. |
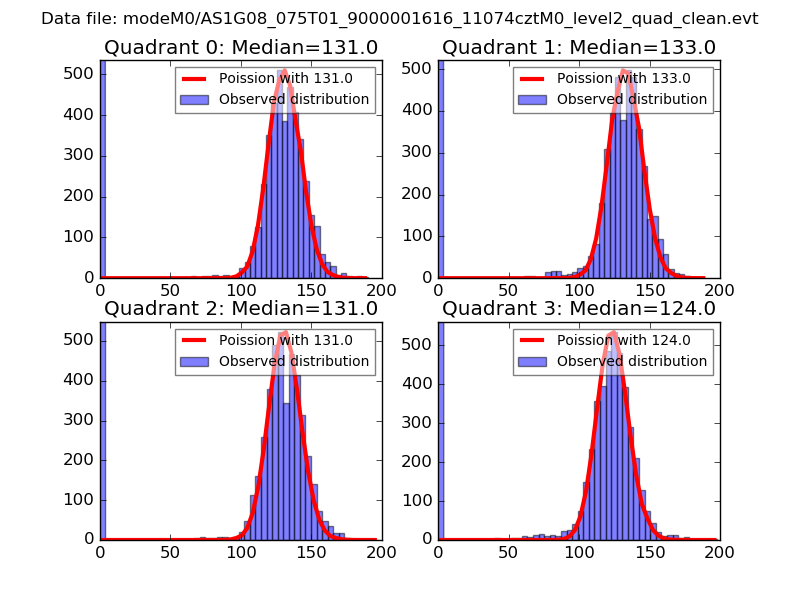 |
 |
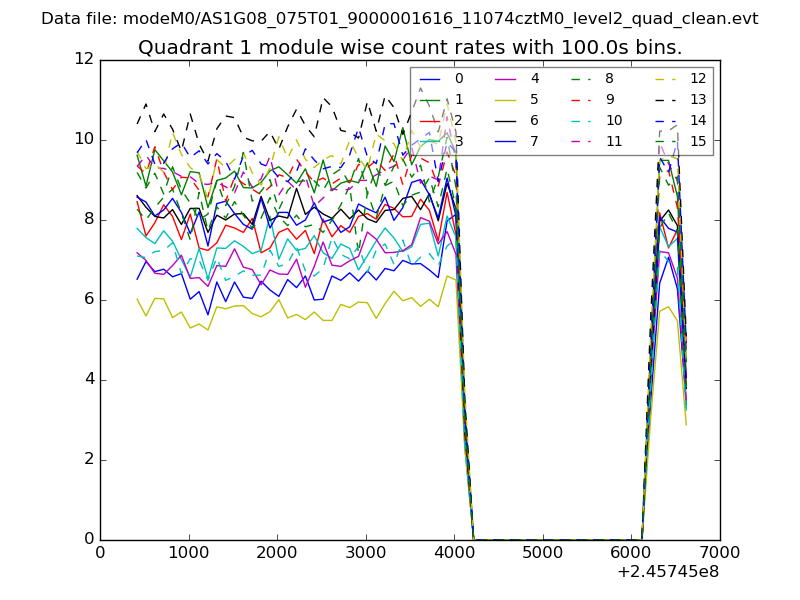
| Quadrant-wise count rates Data is divided into 100 sec bins |
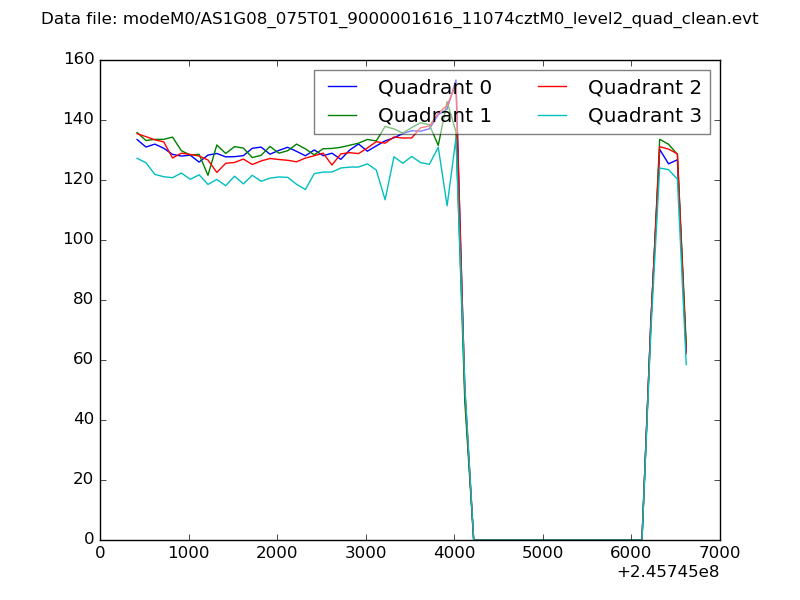 |
|
| Module-wise count rates for Quadrant A Data is divided into 100 sec bins |
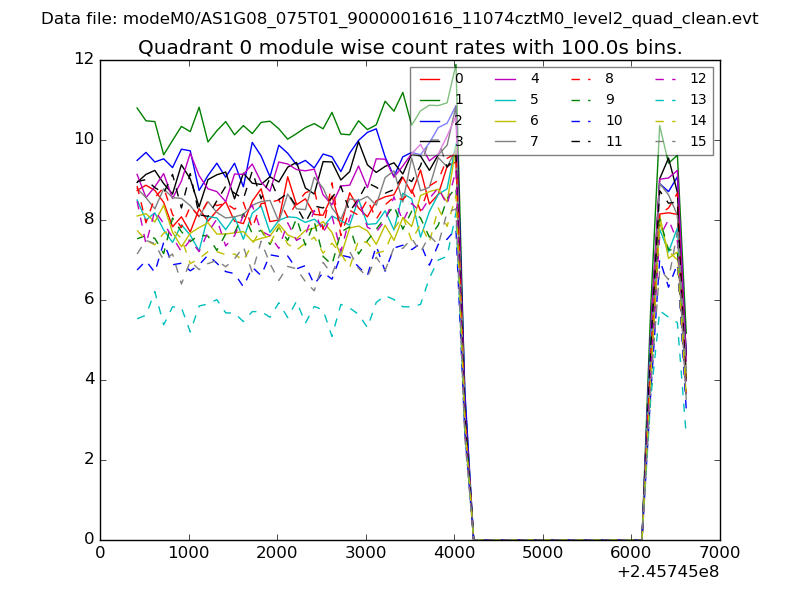 |
 |
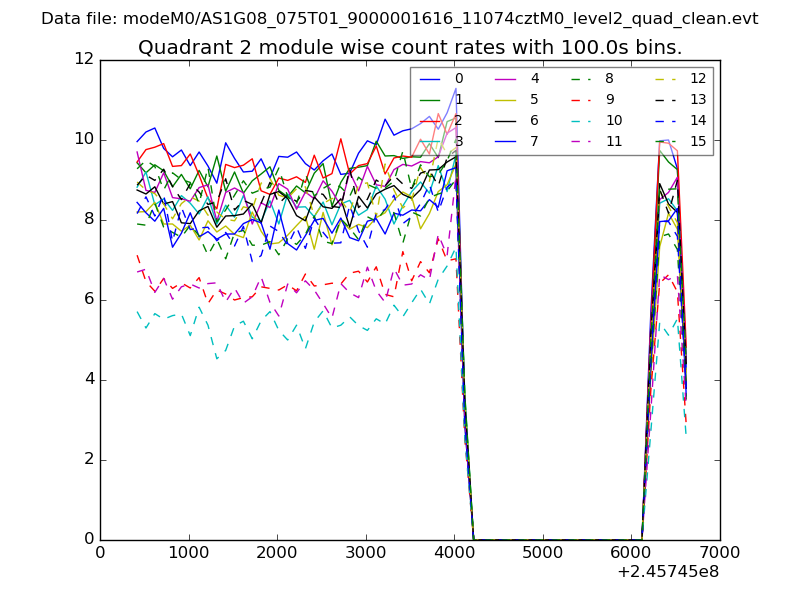
| Module-wise count rates for Quadrant B Data is divided into 100 sec bins |
 |
 |
| Module-wise count rates for Quadrant C Data is divided into 100 sec bins |
 |
 |
| Module-wise count rates for Quadrant D Data is divided into 100 sec bins |
 |
 |
| Parameter | Plot |
|---|---|
| CZT HV Monitor | 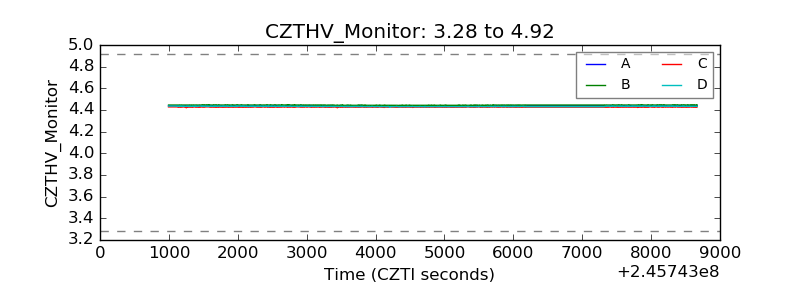 |
| D_VDD |  |
| Temperature 1 | 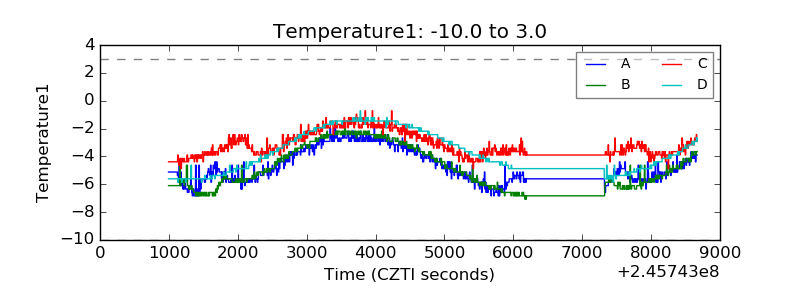 |
| Veto HV Monitor | 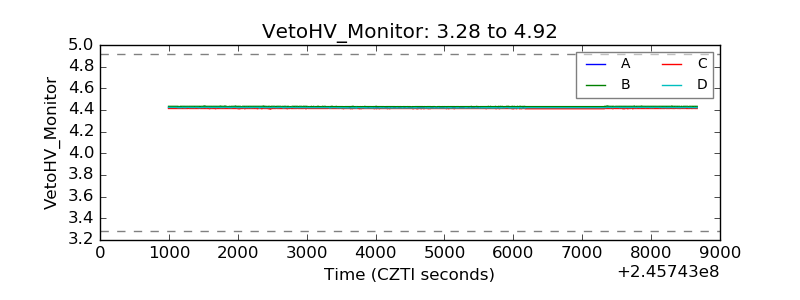 |
| Veto LLD |  |
| Alpha Counter | 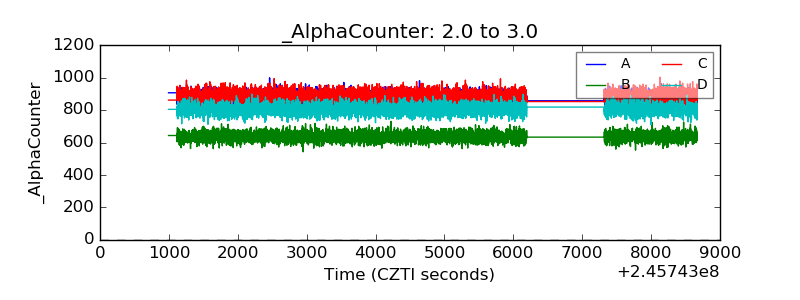 |
| _CPM_Rate | 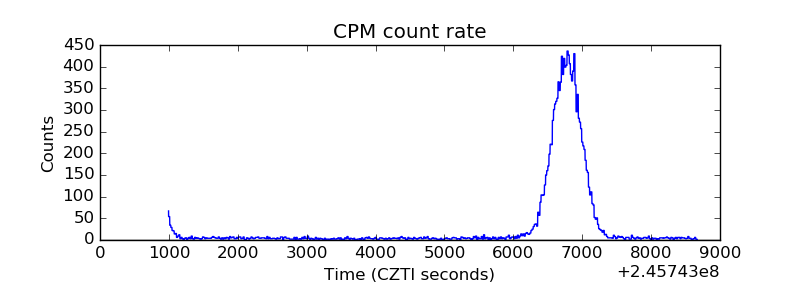 |
| CZT Counter | 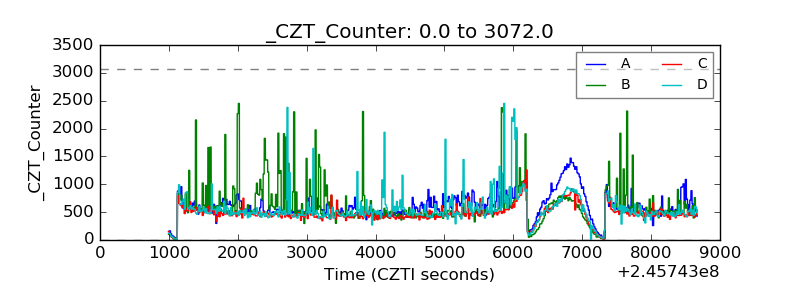 |
| +2.5 Volts monitor |  |
| +5 Volts monitor |  |
| _ROLL_ROT | 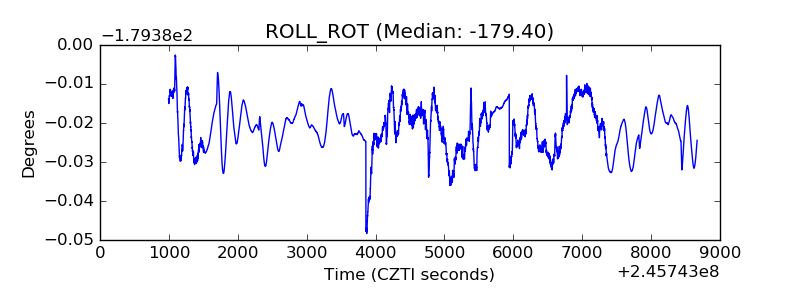 |
| _Roll_DEC |  |
| _Roll_RA | 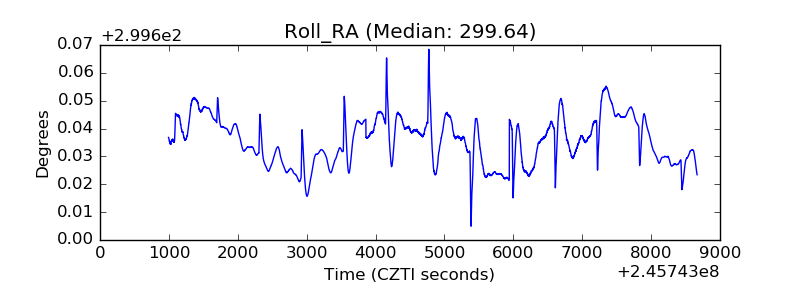 |
| Veto Counter | 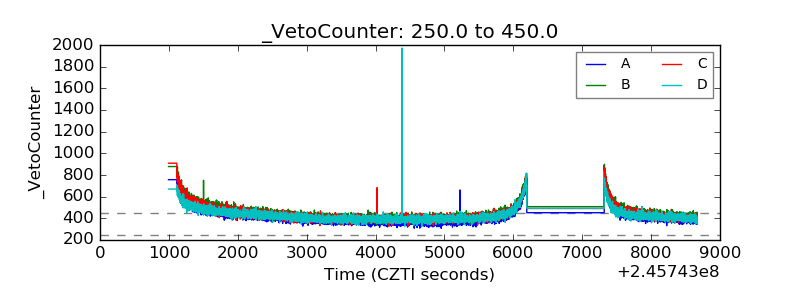 |