| Param | Original file | Final file |
|---|---|---|
| Filename | modeM0/AS1G08_075T01_9000001616_11075cztM0_level2.evt | modeM0/AS1G08_075T01_9000001616_11075cztM0_level2_quad_clean.evt |
| Size (bytes) | 521,369,280 | 82,537,920 |
| Size | 497.2 MB | 78.7 MB |
| Events in quadrant A | 3,666,887 | 524,062 |
| Events in quadrant B | 4,583,541 | 516,661 |
| Events in quadrant C | 2,981,028 | 522,222 |
| Events in quadrant D | 4,124,247 | 489,993 |
| Mode SS | |||
|---|---|---|---|
| Quadrant | BADHDUFLAG | Total packets | Discarded packets |
| A | 0 | 130 | 0 |
| B | 0 | 130 | 0 |
| C | 0 | 130 | 0 |
| D | 0 | 130 | 0 |
| Mode M9 | |||
|---|---|---|---|
| Quadrant | BADHDUFLAG | Total packets | Discarded packets |
| A | 0 | 10 | 0 |
| B | 0 | 10 | 0 |
| C | 0 | 10 | 0 |
| D | 0 | 11 | 0 |
| Mode M0 | |||
|---|---|---|---|
| Quadrant | BADHDUFLAG | Total packets | Discarded packets |
| A | 0 | 14943 | 2 |
| B | 0 | 17688 | 2 |
| C | 0 | 13261 | 2 |
| D | 0 | 16425 | 2 |
| Quadrant | Total seconds | Saturated seconds | Saturation percentage |
|---|---|---|---|
| A | 6398 | 169 | 2.641450% |
| B | 6398 | 522 | 8.158800% |
| C | 6398 | 95 | 1.484839% |
| D | 6398 | 230 | 3.594873% |
Noise dominated data is calculated using 1-second bins in cleaned event files. If a bin has >2000 counts, and if more than 50% of those come from <1% of pixels, then it is considered to be noise-dominated and hence unusable.
| Quadrant | # 1 sec bins | Bins with >0 counts | Bins with >2000 counts | High rate bins dominated by noise | Noise dominated (total time) | Noise dominated (detector-on time) | Marked lightcurve |
|---|---|---|---|---|---|---|---|
| A | 7208 | 6399 | 7 | 7 | 0.10% | 0.11% | 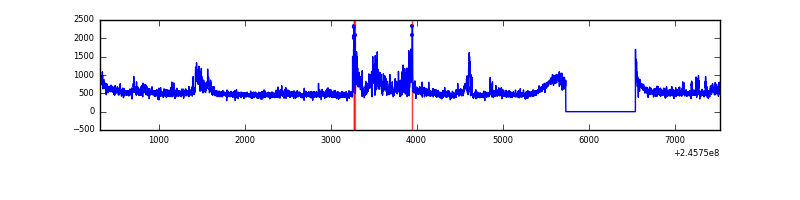 |
| B | 7208 | 6399 | 244 | 244 | 3.39% | 3.81% |  |
| C | 7208 | 6399 | 0 | 0 | 0.00% | 0.00% | 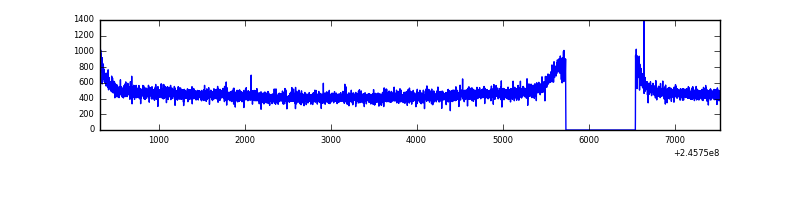 |
| D | 7208 | 6398 | 82 | 82 | 1.14% | 1.28% | 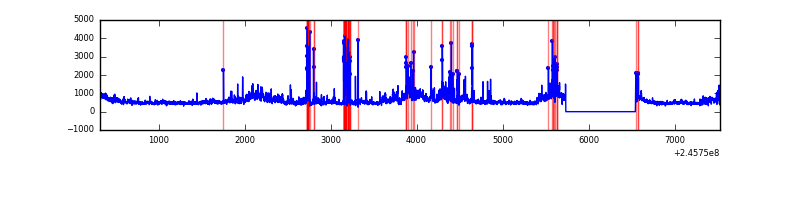 |
Top three noisy pixels from each quadrant. If the there are fewer than three noisy pixels in the level2.evt file, extra rows are filled as -1
| Pixel properties | Quadrant properties | ||||||
|---|---|---|---|---|---|---|---|
| Quadrant | DetID | PixID | Counts | Sigma | Mean | Median | Sigma |
| A | 8 | 15 | 592497 | 3656.56 | 798 | 781 | 161.8 |
| A | 0 | 226 | 7070 | 38.86 | 798 | 781 | 161.8 |
| A | 12 | 194 | 6246 | 33.77 | 798 | 781 | 161.8 |
| B | 4 | 239 | 1449187 | 9856.93 | 774 | 756 | 146.9 |
| B | 15 | 204 | 48087 | 322.1 | 774 | 756 | 146.9 |
| B | 0 | 214 | 27597 | 182.66 | 774 | 756 | 146.9 |
| C | 13 | 61 | 5641 | 27.47 | 764 | 768 | 177.4 |
| C | 9 | 204 | 2186 | 7.99 | 764 | 768 | 177.4 |
| C | 3 | 202 | 1856 | 6.13 | 764 | 768 | 177.4 |
| D | 11 | 129 | 508492 | 2782.25 | 763 | 742 | 182.5 |
| D | 10 | 253 | 282600 | 1544.46 | 763 | 742 | 182.5 |
| D | 8 | 195 | 181595 | 991.0 | 763 | 742 | 182.5 |
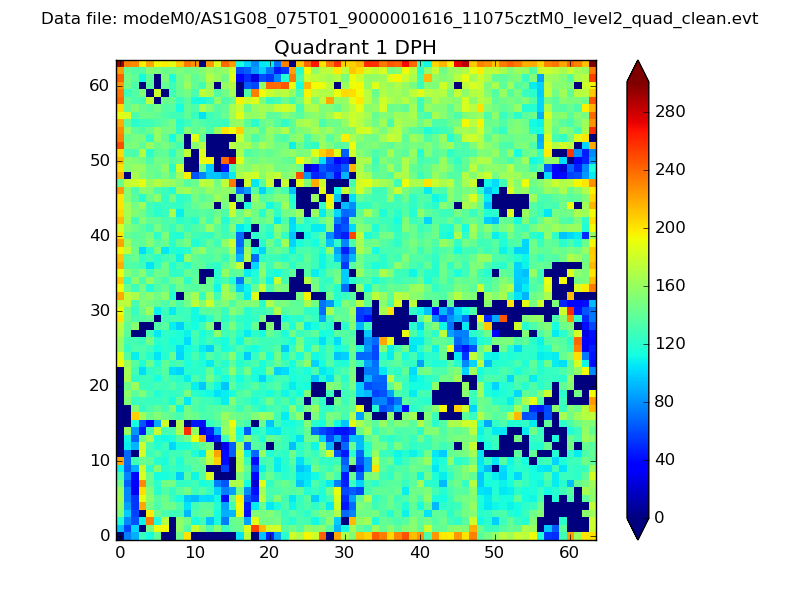
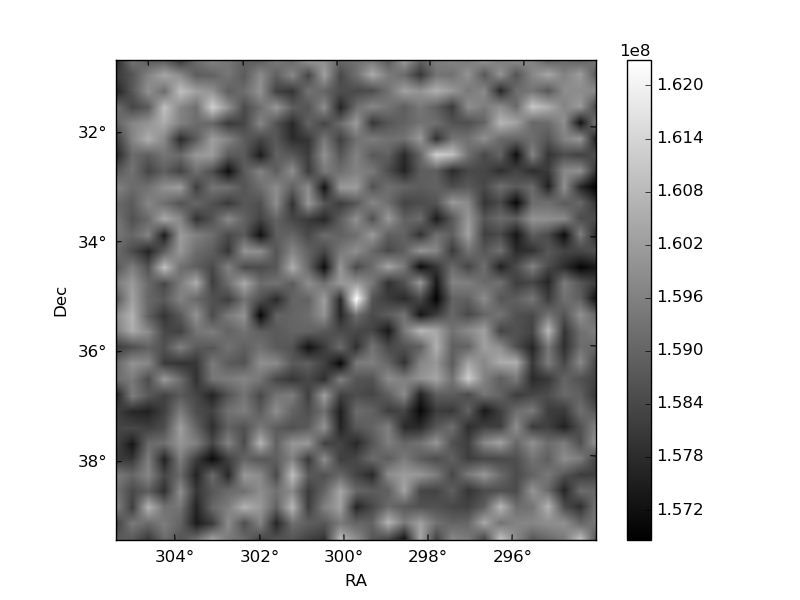
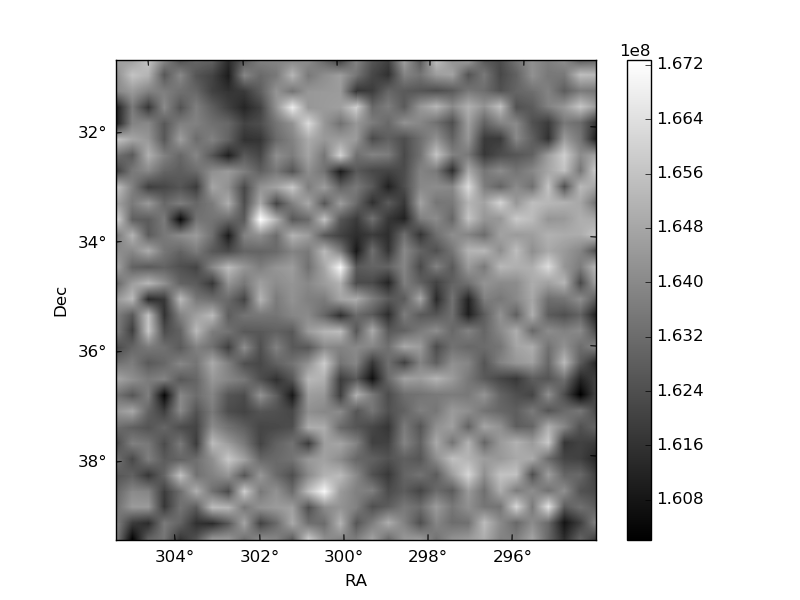
Histogram calculated using DETX and DETY for each event in the final _common_clean file
| Quadrant A | 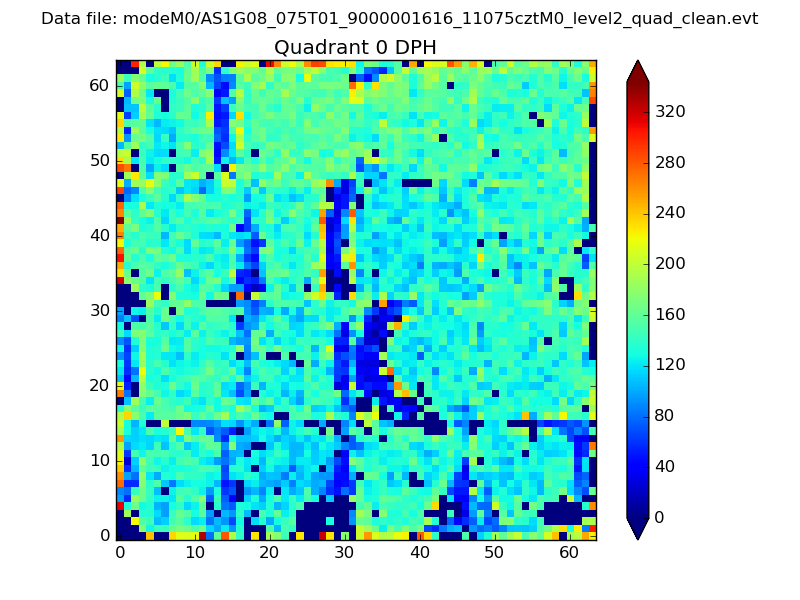 |
 |
Quadrant B |
|---|---|---|---|
| Quadrant D | 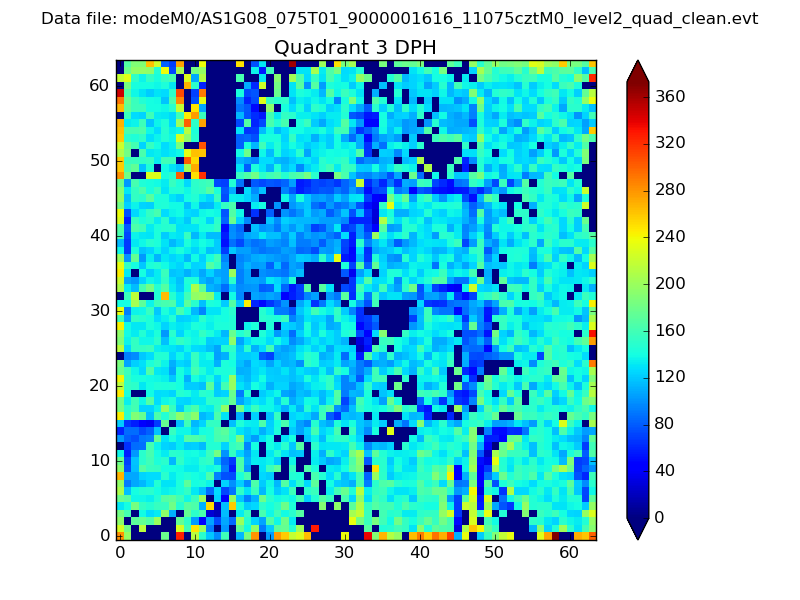 |
 |
Quadrant C |
| Plot type | Count rate plots | Images |
|---|---|---|
| Comparison with Poisson distribution Blue bars denote a histogram of data divided into 1 sec bins. Red curve is a Poisson curve with rate = median count rate of data. |
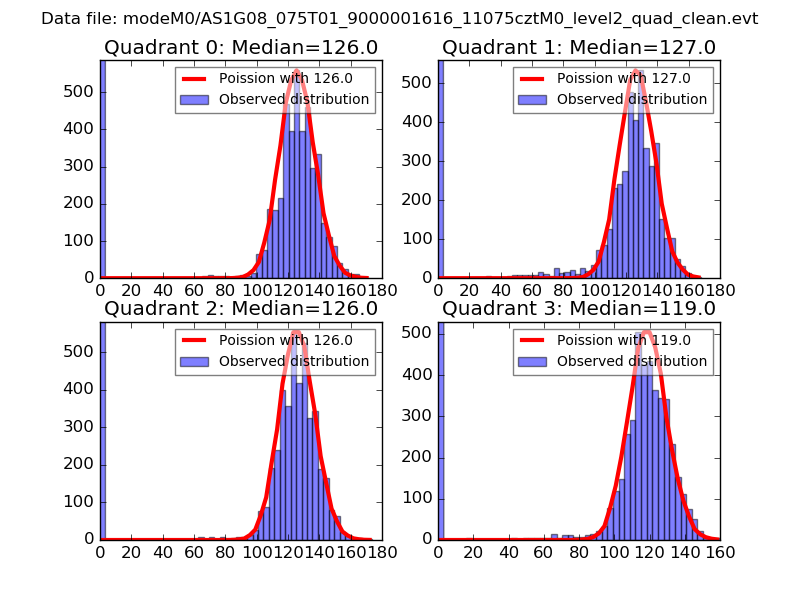 |
 |
| Quadrant-wise count rates Data is divided into 100 sec bins |
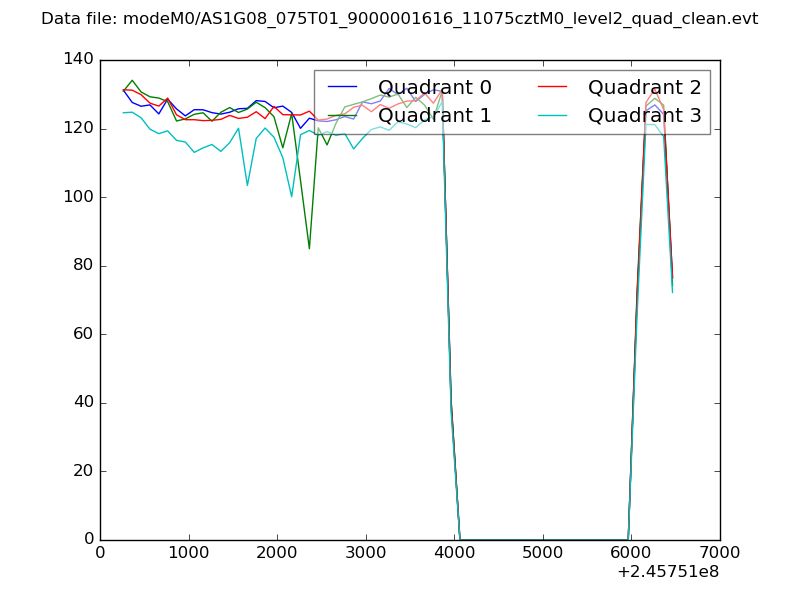 |
|
| Module-wise count rates for Quadrant A Data is divided into 100 sec bins |
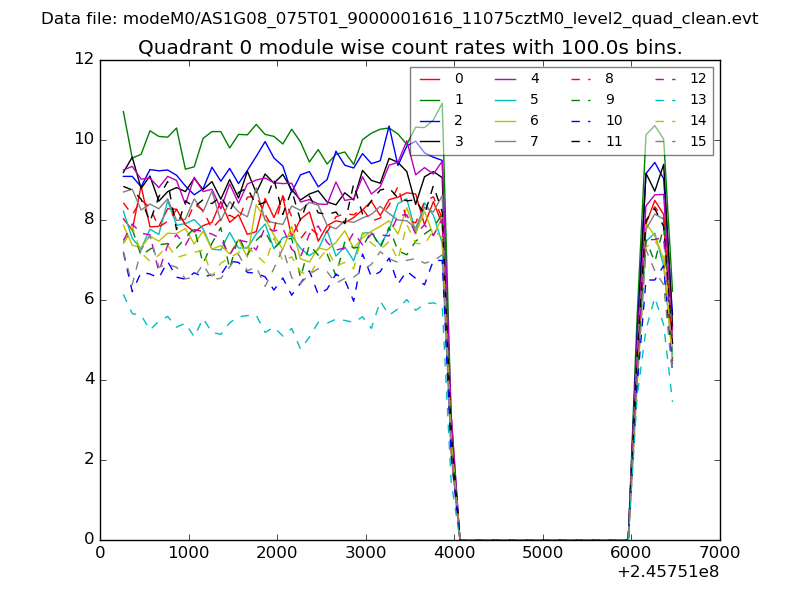 |
 |
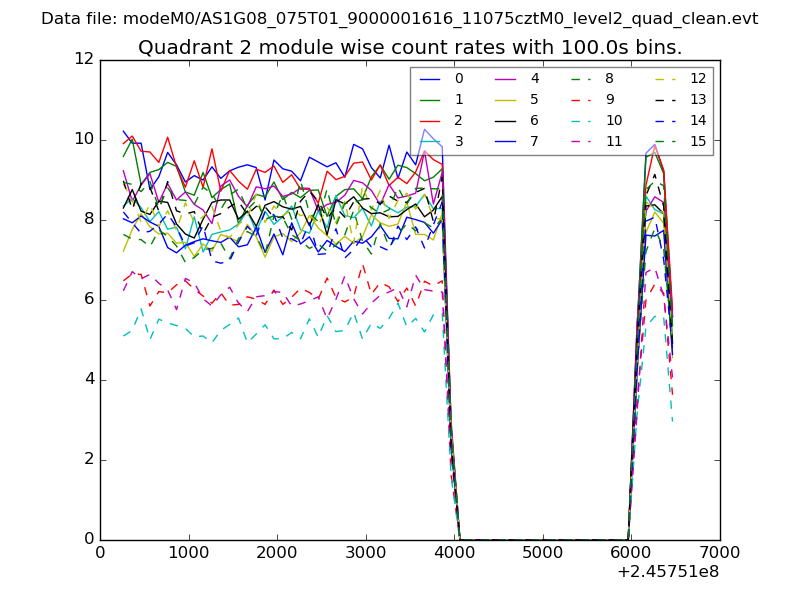
| Module-wise count rates for Quadrant B Data is divided into 100 sec bins |
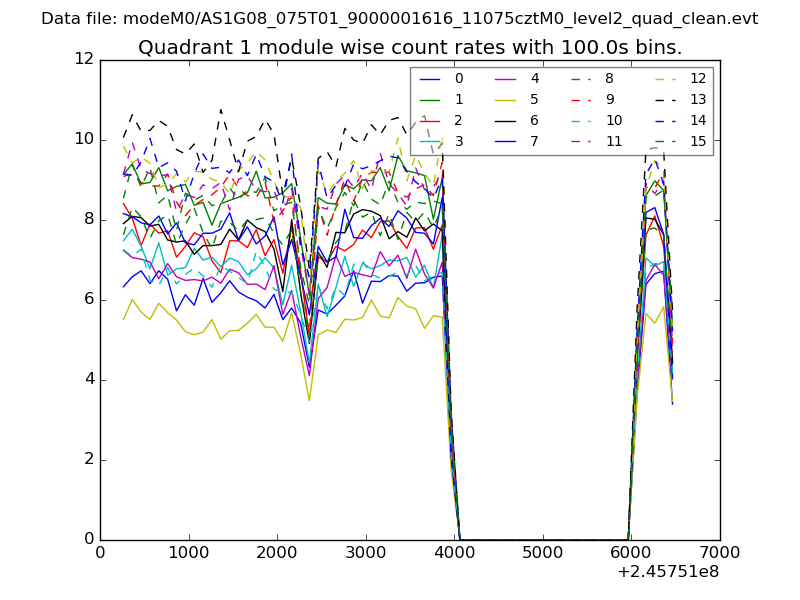 |
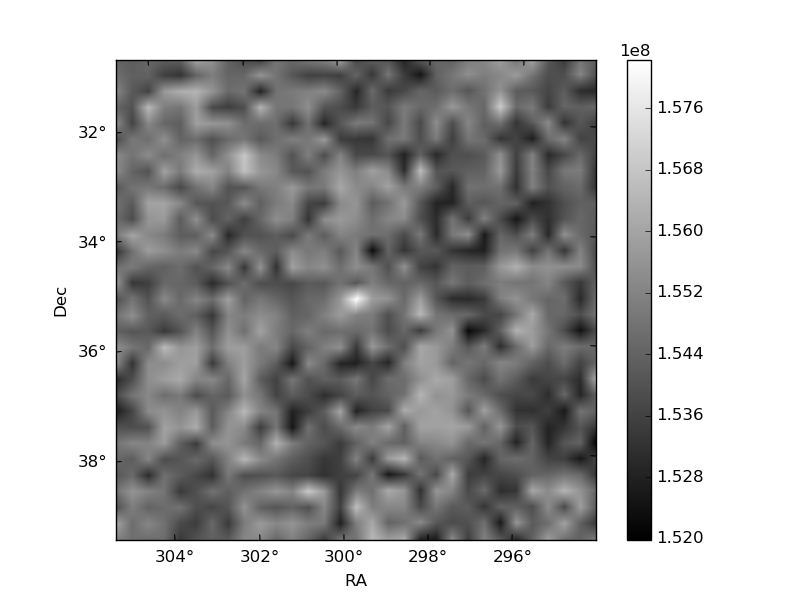 |
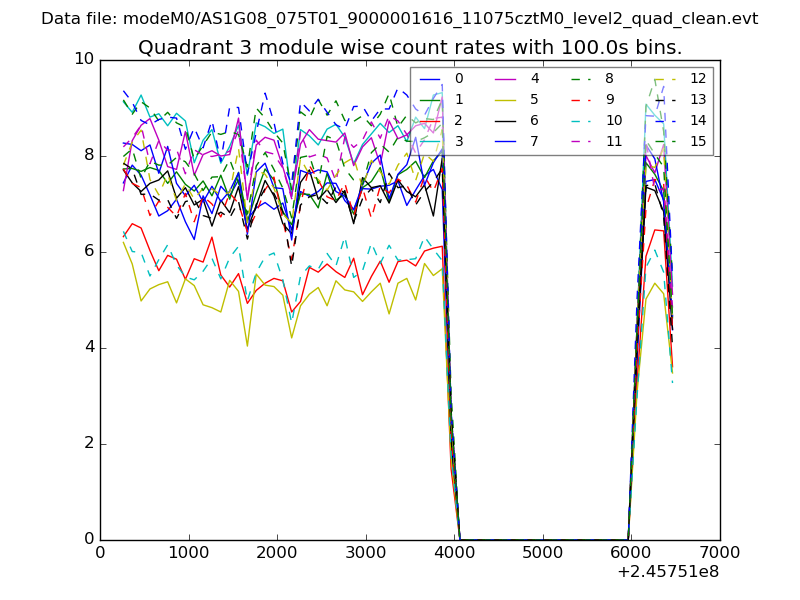
| Module-wise count rates for Quadrant C Data is divided into 100 sec bins |
 |
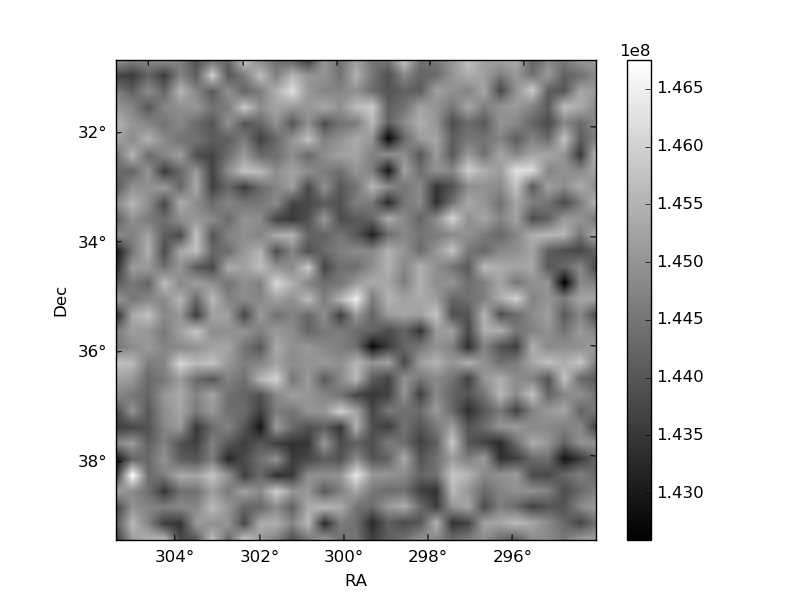 |
| Module-wise count rates for Quadrant D Data is divided into 100 sec bins |
 |
 |
| Parameter | Plot |
|---|---|
| CZT HV Monitor | 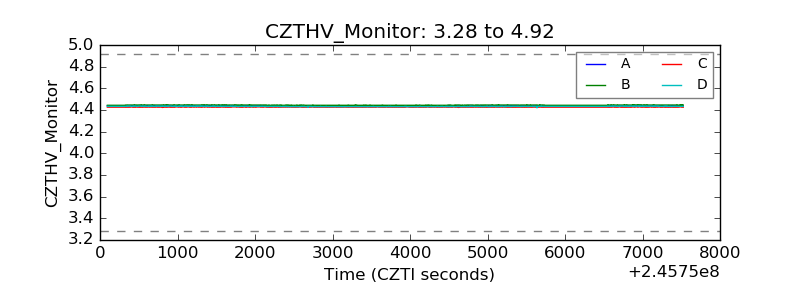 |
| D_VDD | 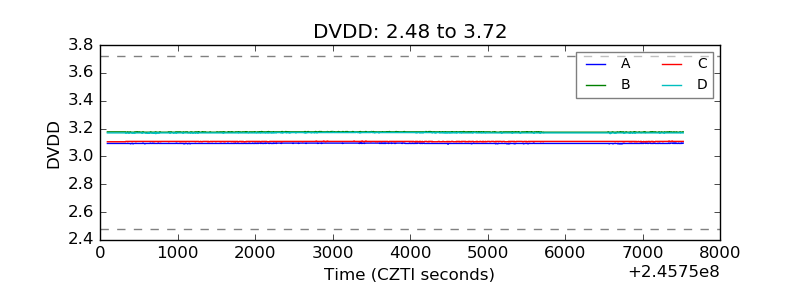 |
| Temperature 1 | 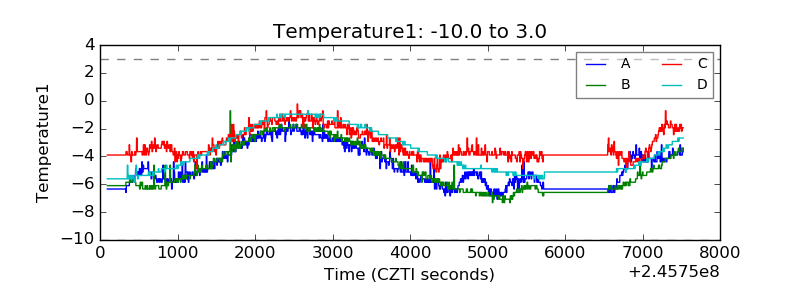 |
| Veto HV Monitor |  |
| Veto LLD | 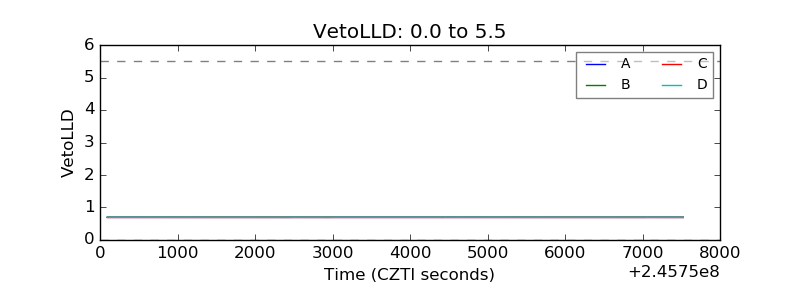 |
| Alpha Counter | 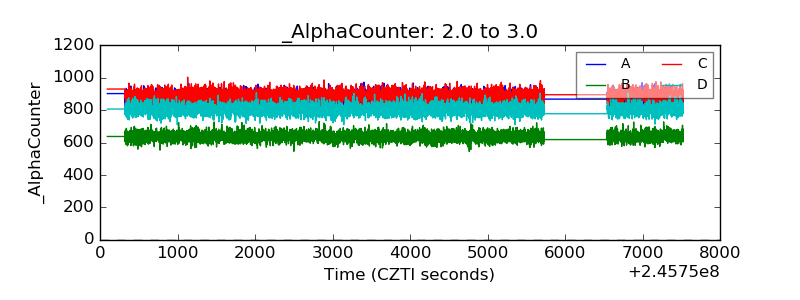 |
| _CPM_Rate | 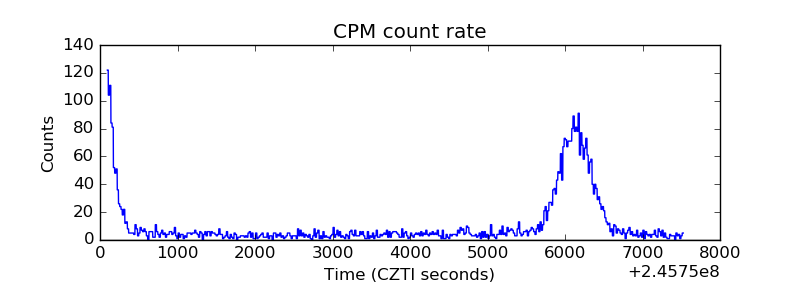 |
| CZT Counter |  |
| +2.5 Volts monitor |  |
| +5 Volts monitor | 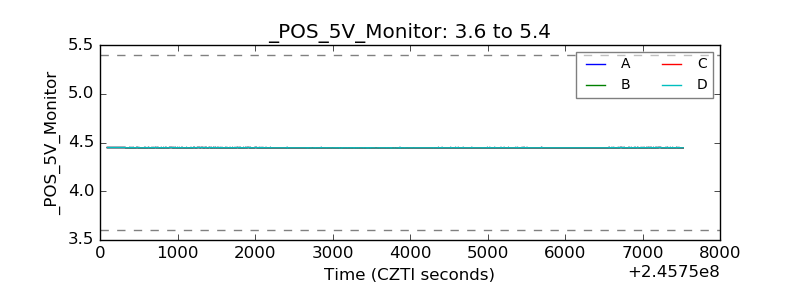 |
| _ROLL_ROT | 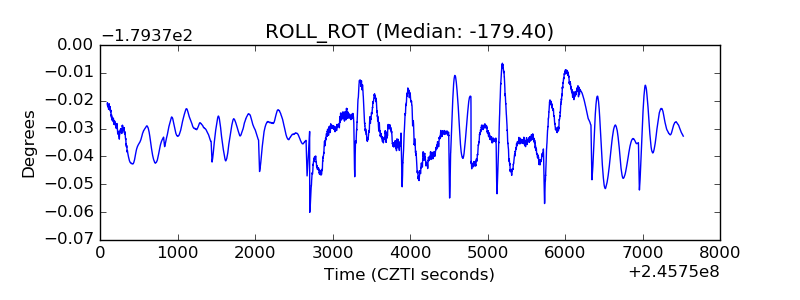 |
| _Roll_DEC | 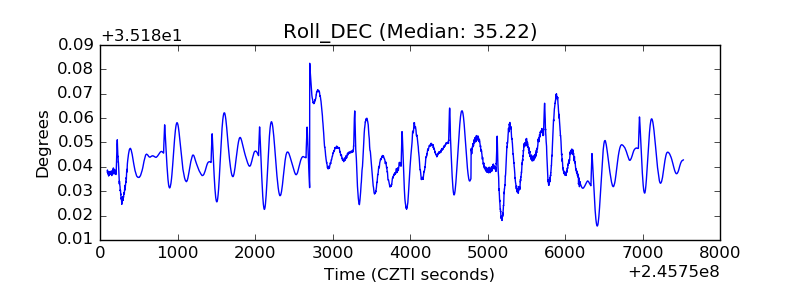 |
| _Roll_RA | 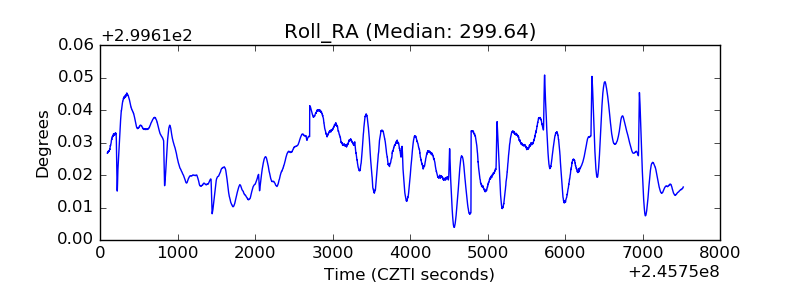 |
| Veto Counter | 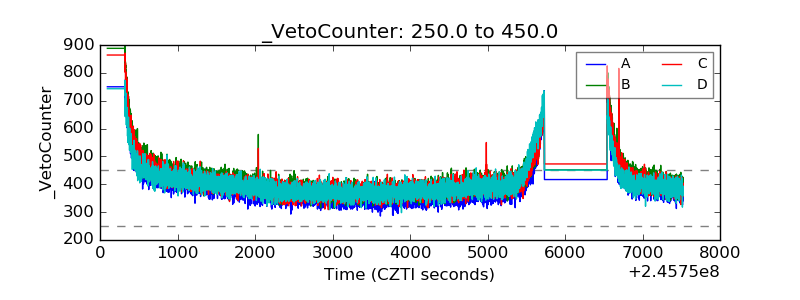 |