| Param | Original file | Final file |
|---|---|---|
| Filename | modeM0/AS1G08_028T01_9000001618_11076cztM0_level2.evt | modeM0/AS1G08_028T01_9000001618_11076cztM0_level2_quad_clean.evt |
| Size (bytes) | 439,211,520 | 76,518,720 |
| Size | 418.9 MB | 73.0 MB |
| Events in quadrant A | 3,269,673 | 484,310 |
| Events in quadrant B | 3,728,830 | 482,814 |
| Events in quadrant C | 2,698,437 | 480,529 |
| Events in quadrant D | 3,203,046 | 456,774 |
| Mode M9 | |||
|---|---|---|---|
| Quadrant | BADHDUFLAG | Total packets | Discarded packets |
| A | 0 | 3 | 0 |
| B | 0 | 3 | 0 |
| C | 0 | 3 | 0 |
| D | 0 | 3 | 0 |
| Mode M0 | |||
|---|---|---|---|
| Quadrant | BADHDUFLAG | Total packets | Discarded packets |
| A | 0 | 13467 | 2 |
| B | 0 | 15027 | 1 |
| C | 0 | 12198 | 1 |
| D | 0 | 13464 | 1 |
| Mode SS | |||
|---|---|---|---|
| Quadrant | BADHDUFLAG | Total packets | Discarded packets |
| A | 0 | 120 | 0 |
| B | 0 | 120 | 0 |
| C | 0 | 120 | 0 |
| D | 0 | 120 | 0 |
| Quadrant | Total seconds | Saturated seconds | Saturation percentage |
|---|---|---|---|
| A | 5905 | 182 | 3.082134% |
| B | 5905 | 309 | 5.232854% |
| C | 5905 | 47 | 0.795936% |
| D | 5905 | 121 | 2.049111% |
Noise dominated data is calculated using 1-second bins in cleaned event files. If a bin has >2000 counts, and if more than 50% of those come from <1% of pixels, then it is considered to be noise-dominated and hence unusable.
| Quadrant | # 1 sec bins | Bins with >0 counts | Bins with >2000 counts | High rate bins dominated by noise | Noise dominated (total time) | Noise dominated (detector-on time) | Marked lightcurve |
|---|---|---|---|---|---|---|---|
| A | 6260 | 5906 | 34 | 34 | 0.54% | 0.58% | 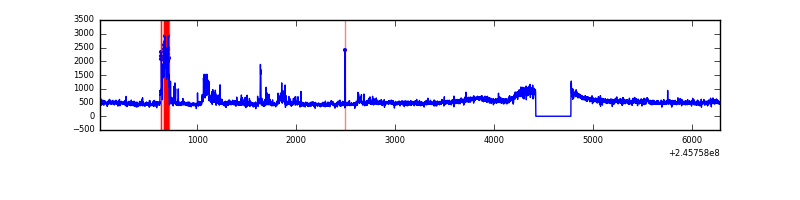 |
| B | 6260 | 5906 | 120 | 120 | 1.92% | 2.03% | 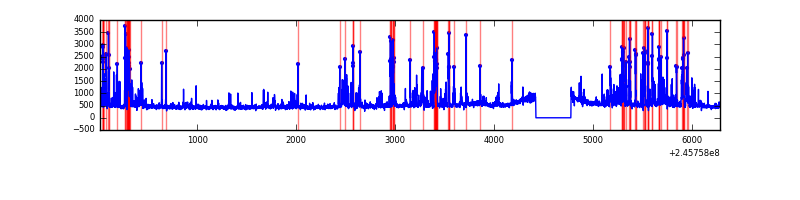 |
| C | 6260 | 5906 | 0 | 0 | 0.00% | 0.00% | 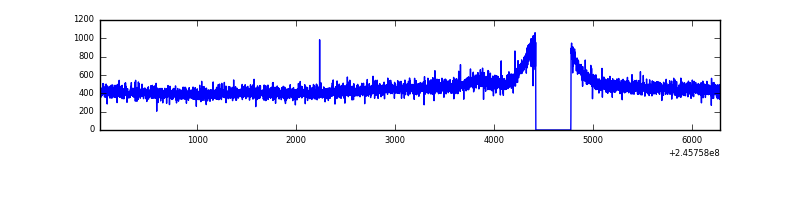 |
| D | 6260 | 5906 | 60 | 60 | 0.96% | 1.02% | 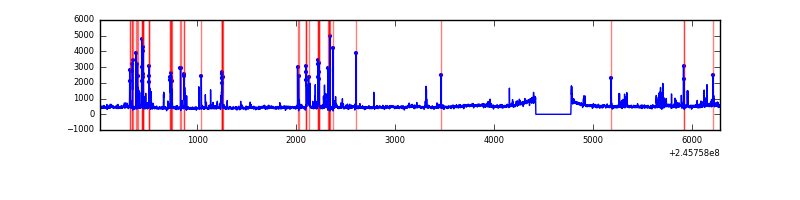 |
Top three noisy pixels from each quadrant. If the there are fewer than three noisy pixels in the level2.evt file, extra rows are filled as -1
| Pixel properties | Quadrant properties | ||||||
|---|---|---|---|---|---|---|---|
| Quadrant | DetID | PixID | Counts | Sigma | Mean | Median | Sigma |
| A | 8 | 15 | 477481 | 3204.36 | 719 | 701 | 148.8 |
| A | 14 | 238 | 9879 | 61.68 | 719 | 701 | 148.8 |
| A | 0 | 226 | 6509 | 39.03 | 719 | 701 | 148.8 |
| B | 4 | 239 | 818198 | 5920.56 | 708 | 691 | 138.1 |
| B | 0 | 214 | 42151 | 300.26 | 708 | 691 | 138.1 |
| B | 15 | 204 | 24578 | 172.99 | 708 | 691 | 138.1 |
| C | 13 | 61 | 5175 | 27.63 | 691 | 695 | 162.1 |
| C | 14 | 234 | 2184 | 9.18 | 691 | 695 | 162.1 |
| C | 12 | 4 | 2045 | 8.33 | 691 | 695 | 162.1 |
| D | 10 | 253 | 215892 | 1278.95 | 690 | 670 | 168.3 |
| D | 1 | 52 | 151059 | 893.68 | 690 | 670 | 168.3 |
| D | 8 | 195 | 121471 | 717.86 | 690 | 670 | 168.3 |
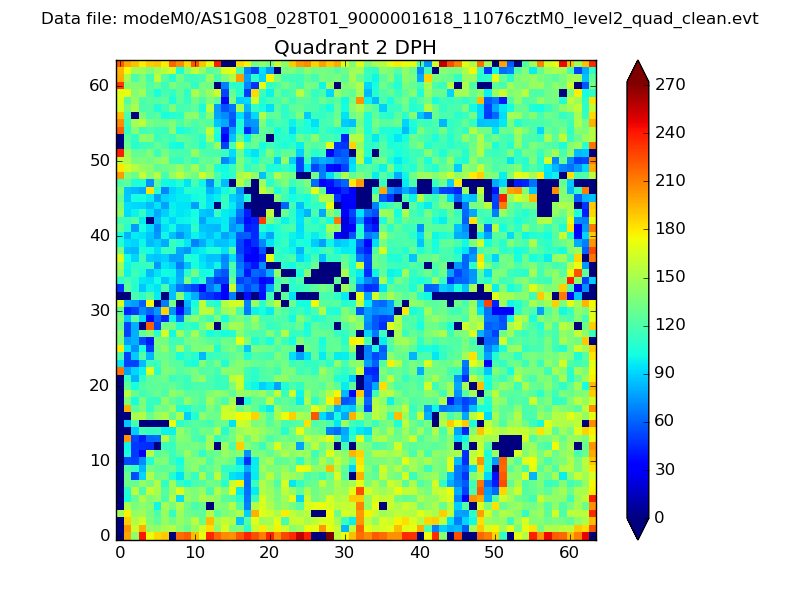
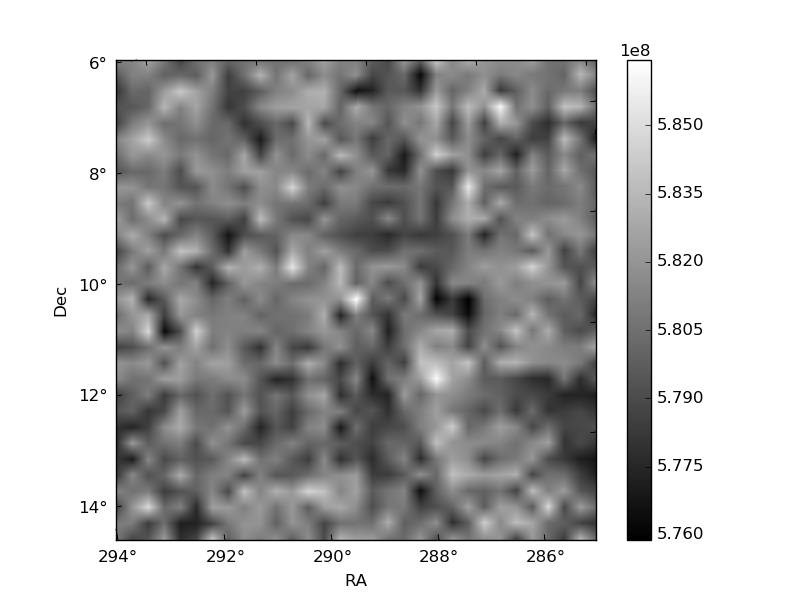
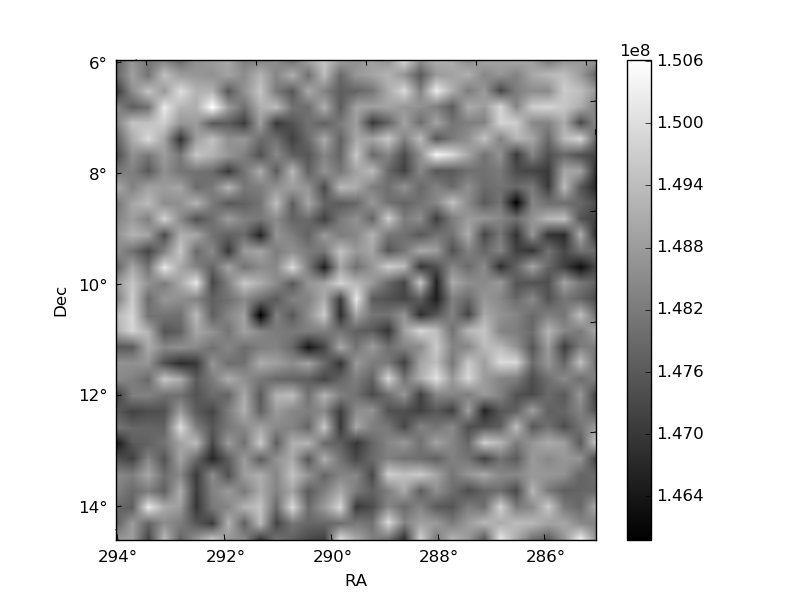
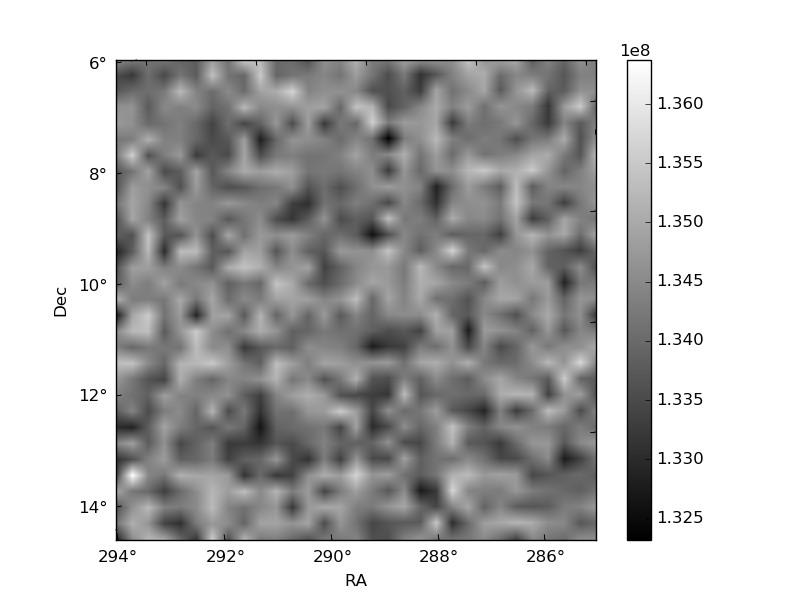
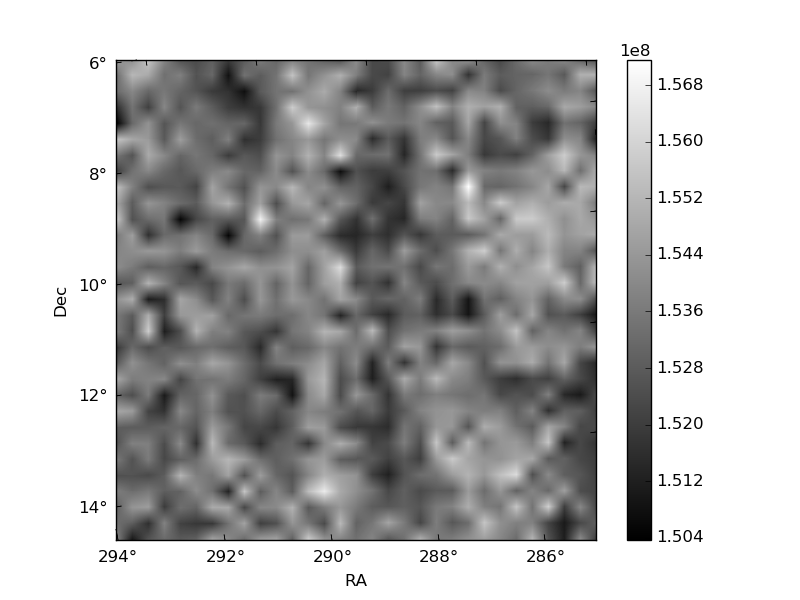
Histogram calculated using DETX and DETY for each event in the final _common_clean file
| Quadrant A | 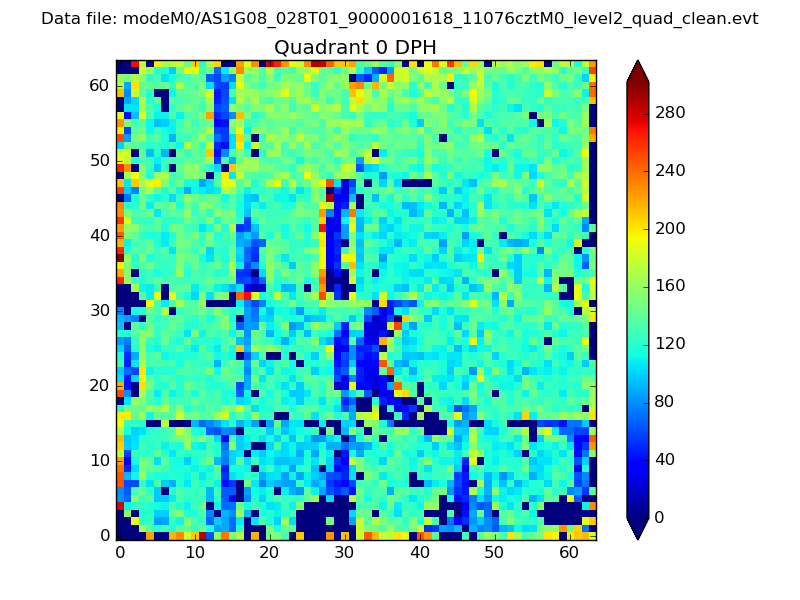 |
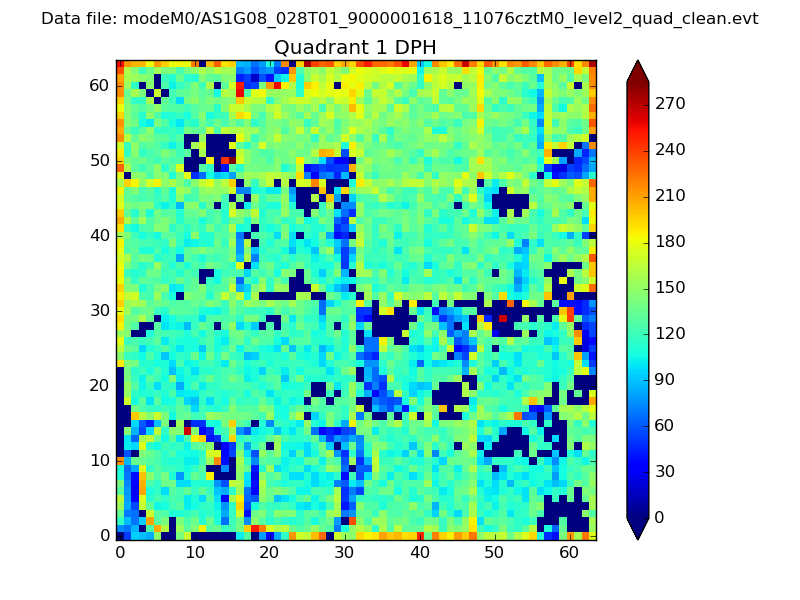 |
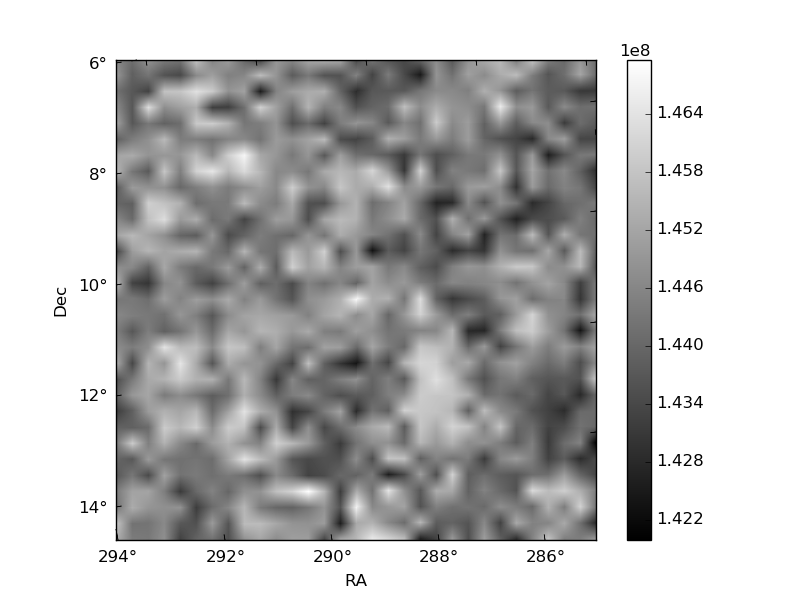
Quadrant B |
|---|---|---|---|
| Quadrant D | 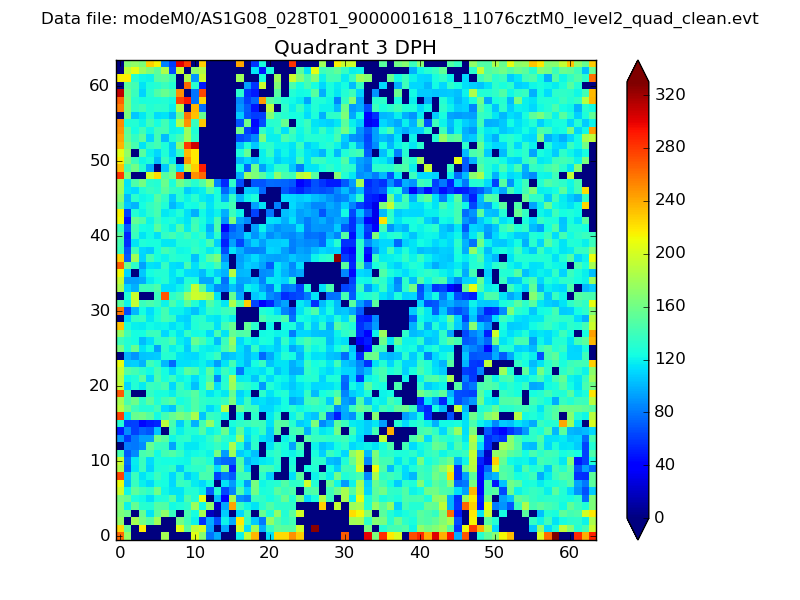 |
 |
Quadrant C |
| Plot type | Count rate plots | Images |
|---|---|---|
| Comparison with Poisson distribution Blue bars denote a histogram of data divided into 1 sec bins. Red curve is a Poisson curve with rate = median count rate of data. |
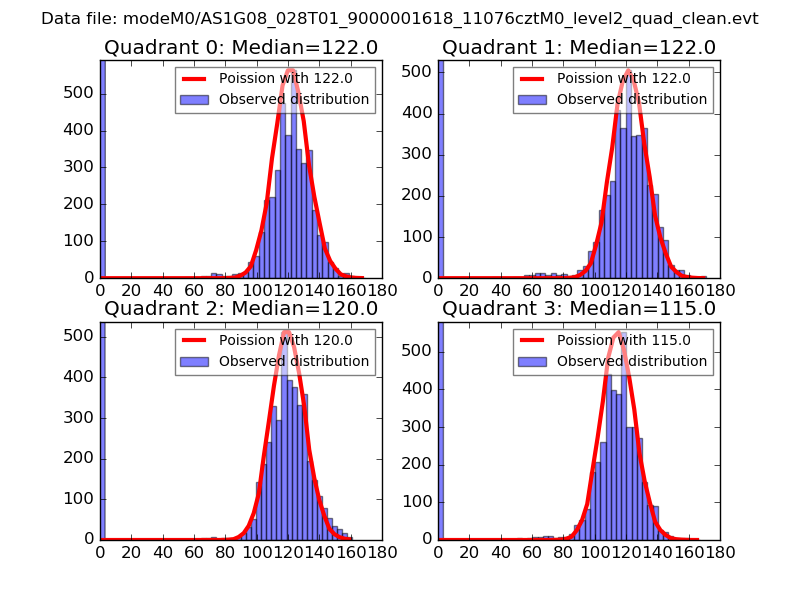 |
 |
| Quadrant-wise count rates Data is divided into 100 sec bins |
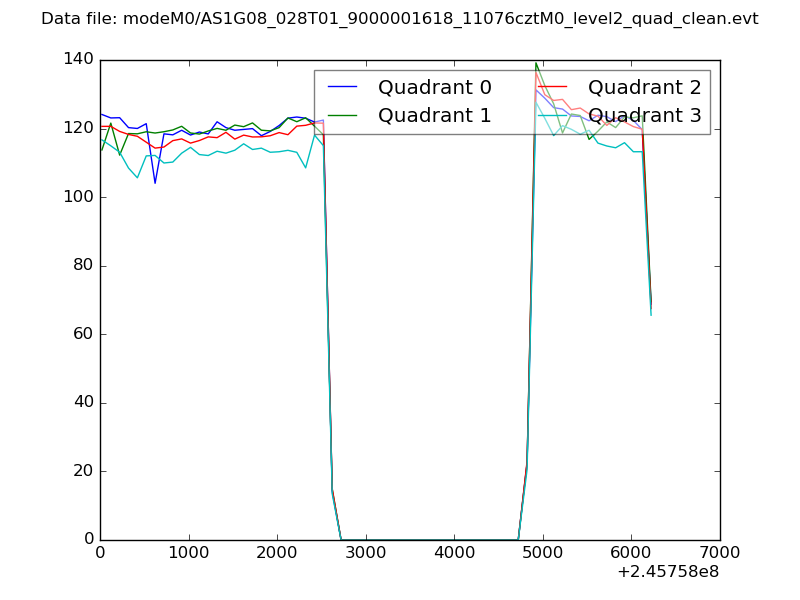 |
|
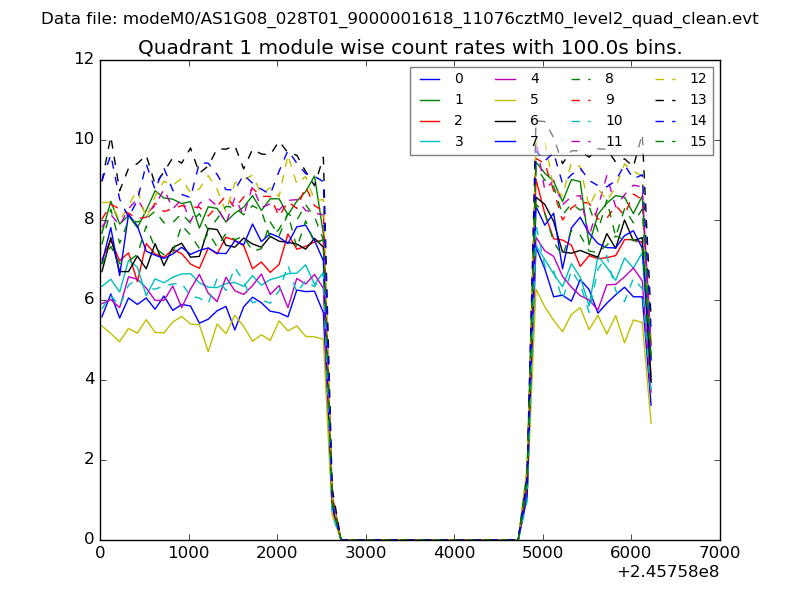
| Module-wise count rates for Quadrant A Data is divided into 100 sec bins |
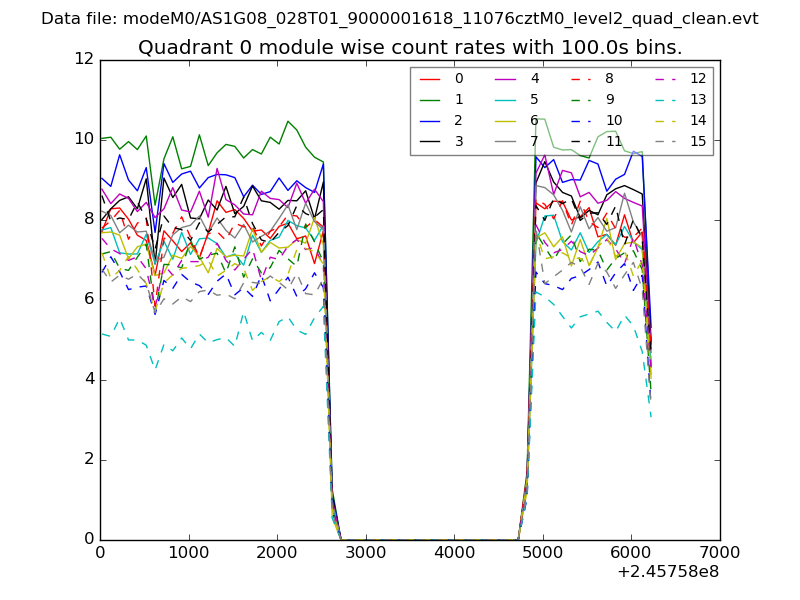 |
 |
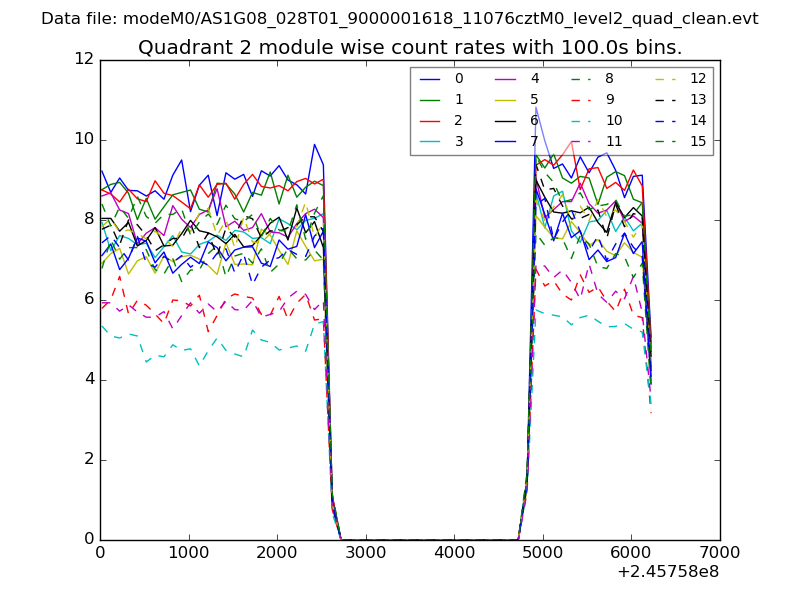
| Module-wise count rates for Quadrant B Data is divided into 100 sec bins |
 |
 |
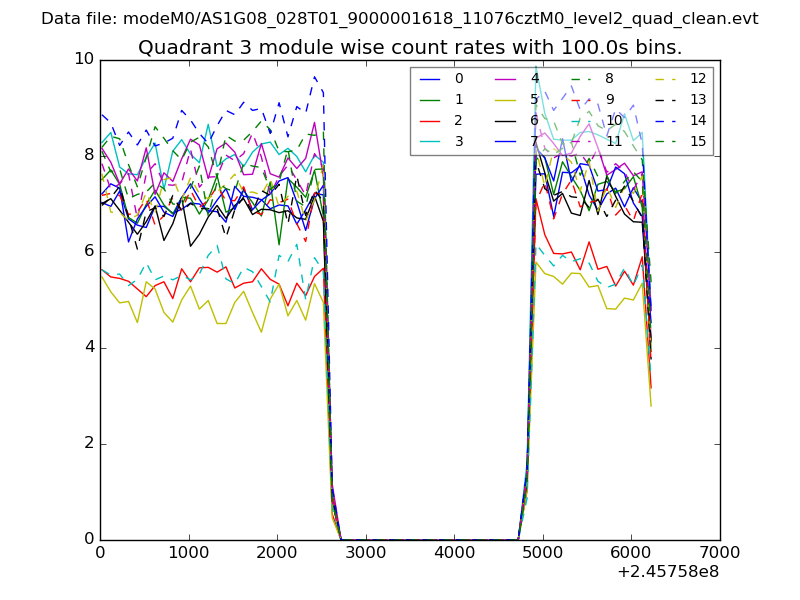
| Module-wise count rates for Quadrant C Data is divided into 100 sec bins |
 |
 |
| Module-wise count rates for Quadrant D Data is divided into 100 sec bins |
 |
 |
| Parameter | Plot |
|---|---|
| CZT HV Monitor | 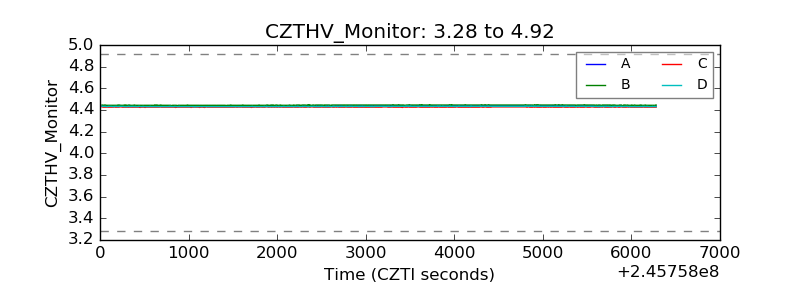 |
| D_VDD |  |
| Temperature 1 | 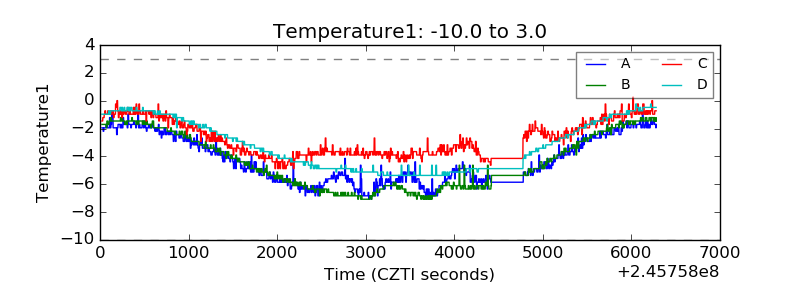 |
| Veto HV Monitor | 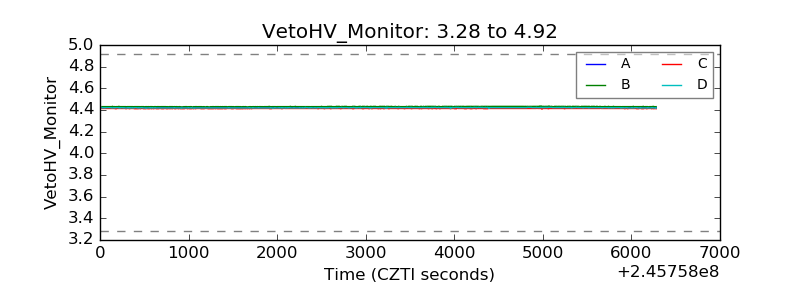 |
| Veto LLD | 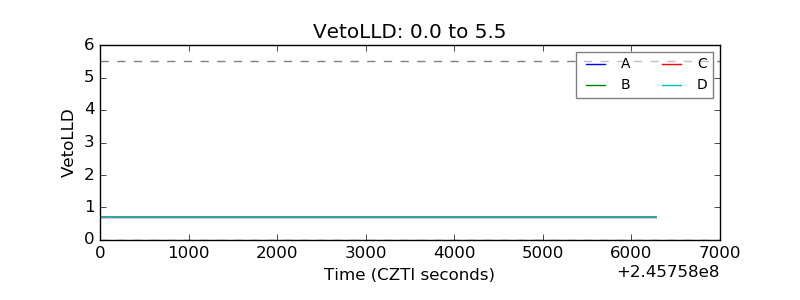 |
| Alpha Counter | 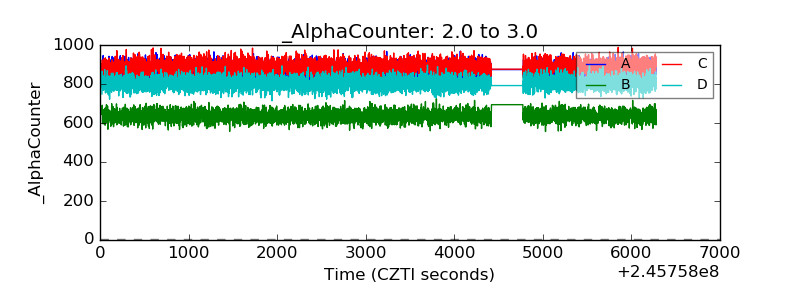 |
| _CPM_Rate | 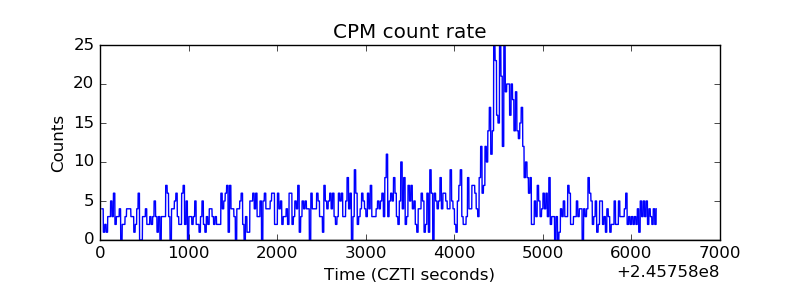 |
| CZT Counter | 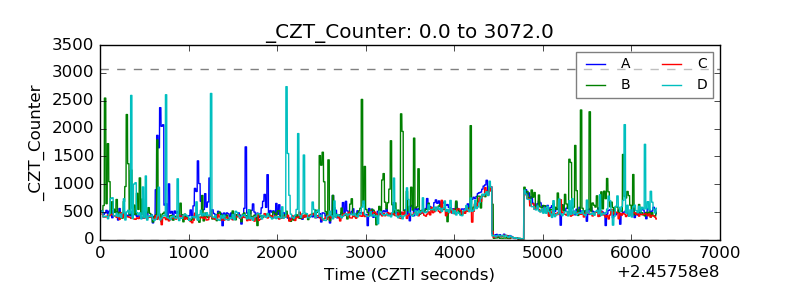 |
| +2.5 Volts monitor |  |
| +5 Volts monitor | 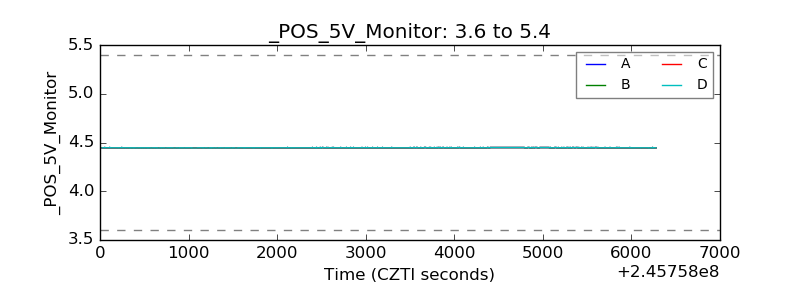 |
| _ROLL_ROT | 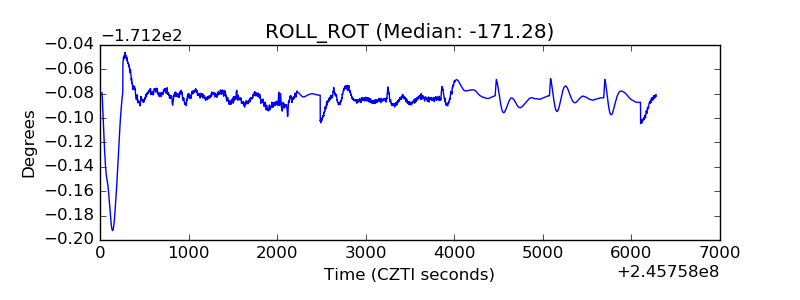 |
| _Roll_DEC |  |
| _Roll_RA | 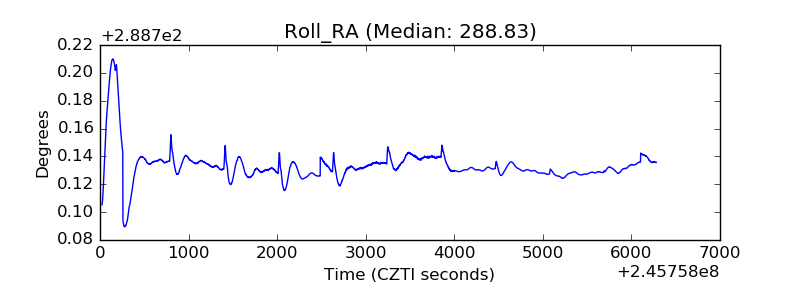 |
| Veto Counter | 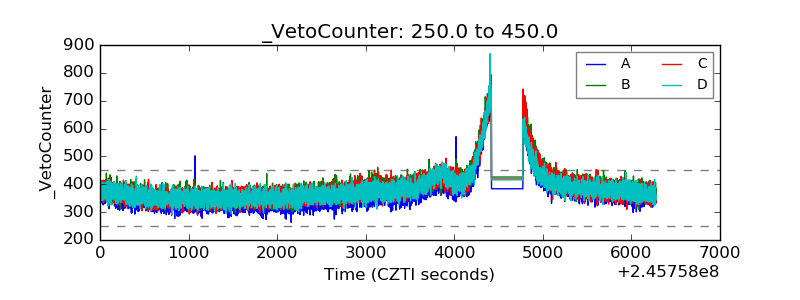 |