| Param | Original file | Final file |
|---|---|---|
| Filename | modeM0/AS1G08_028T01_9000001618_11080cztM0_level2.evt | modeM0/AS1G08_028T01_9000001618_11080cztM0_level2_quad_clean.evt |
| Size (bytes) | 798,111,360 | 113,693,760 |
| Size | 761.1 MB | 108.4 MB |
| Events in quadrant A | 5,643,752 | 693,555 |
| Events in quadrant B | 6,035,562 | 696,627 |
| Events in quadrant C | 4,495,638 | 689,941 |
| Events in quadrant D | 7,298,571 | 648,841 |
| Mode M9 | |||
|---|---|---|---|
| Quadrant | BADHDUFLAG | Total packets | Discarded packets |
| A | 0 | 5 | 0 |
| B | 0 | 5 | 0 |
| C | 0 | 5 | 0 |
| D | 0 | 5 | 0 |
| Mode M0 | |||
|---|---|---|---|
| Quadrant | BADHDUFLAG | Total packets | Discarded packets |
| A | 0 | 23651 | 2 |
| B | 0 | 24719 | 1 |
| C | 0 | 20836 | 1 |
| D | 0 | 28589 | 1 |
| Mode SS | |||
|---|---|---|---|
| Quadrant | BADHDUFLAG | Total packets | Discarded packets |
| A | 0 | 208 | 0 |
| B | 0 | 208 | 0 |
| C | 0 | 208 | 0 |
| D | 0 | 208 | 0 |
| Quadrant | Total seconds | Saturated seconds | Saturation percentage |
|---|---|---|---|
| A | 10306 | 54 | 0.523967% |
| B | 10306 | 265 | 2.571318% |
| C | 10306 | 18 | 0.174656% |
| D | 10306 | 676 | 6.559286% |
Noise dominated data is calculated using 1-second bins in cleaned event files. If a bin has >2000 counts, and if more than 50% of those come from <1% of pixels, then it is considered to be noise-dominated and hence unusable.
| Quadrant | # 1 sec bins | Bins with >0 counts | Bins with >2000 counts | High rate bins dominated by noise | Noise dominated (total time) | Noise dominated (detector-on time) | Marked lightcurve |
|---|---|---|---|---|---|---|---|
| A | 10761 | 10307 | 0 | 0 | 0.00% | 0.00% | 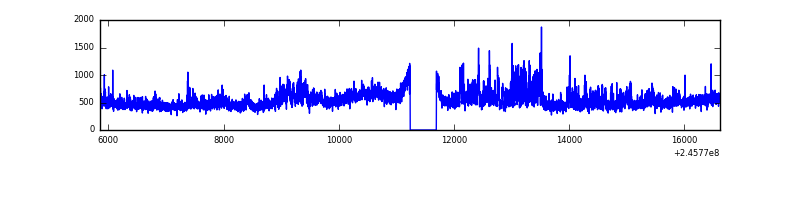 |
| B | 10761 | 10307 | 139 | 139 | 1.29% | 1.35% | 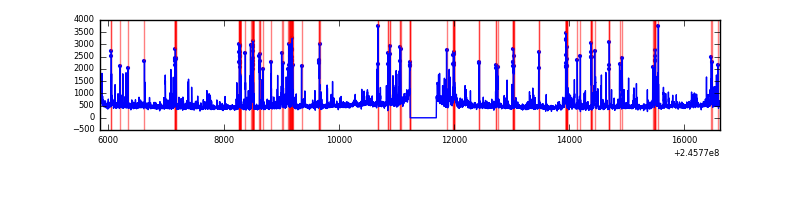 |
| C | 10761 | 10307 | 0 | 0 | 0.00% | 0.00% | 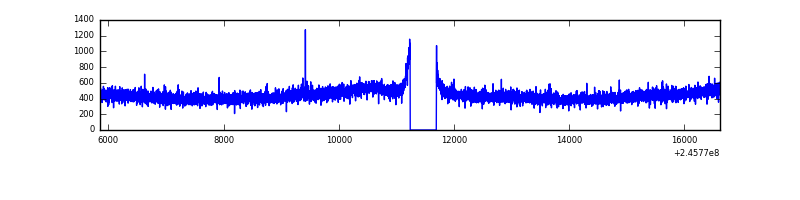 |
| D | 10761 | 10307 | 605 | 605 | 5.62% | 5.87% | 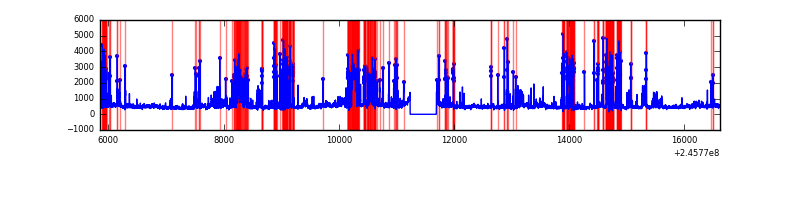 |
Top three noisy pixels from each quadrant. If the there are fewer than three noisy pixels in the level2.evt file, extra rows are filled as -1
| Pixel properties | Quadrant properties | ||||||
|---|---|---|---|---|---|---|---|
| Quadrant | DetID | PixID | Counts | Sigma | Mean | Median | Sigma |
| A | 8 | 15 | 1070496 | 4441.26 | 1181 | 1154 | 240.8 |
| A | 11 | 29 | 26724 | 106.2 | 1181 | 1154 | 240.8 |
| A | 0 | 226 | 10705 | 39.67 | 1181 | 1154 | 240.8 |
| B | 4 | 239 | 1105942 | 4903.91 | 1178 | 1148 | 225.3 |
| B | 15 | 204 | 153350 | 675.59 | 1178 | 1148 | 225.3 |
| B | 0 | 219 | 69861 | 305.0 | 1178 | 1148 | 225.3 |
| C | 8 | 128 | 9591 | 31.62 | 1148 | 1152 | 266.9 |
| C | 13 | 61 | 8441 | 27.31 | 1148 | 1152 | 266.9 |
| C | 8 | 112 | 5998 | 18.16 | 1148 | 1152 | 266.9 |
| D | 10 | 253 | 1753592 | 6573.25 | 1106 | 1074 | 266.6 |
| D | 1 | 52 | 392632 | 1468.63 | 1106 | 1074 | 266.6 |
| D | 8 | 195 | 381192 | 1425.73 | 1106 | 1074 | 266.6 |
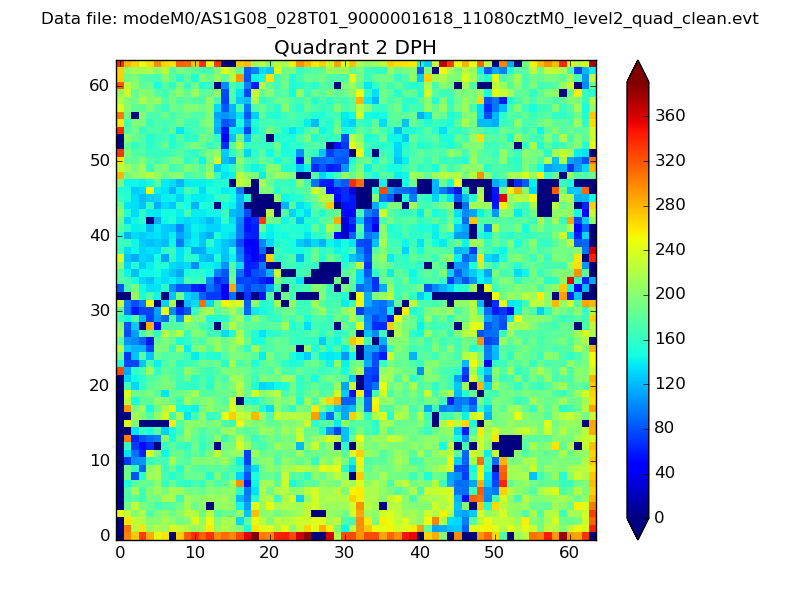
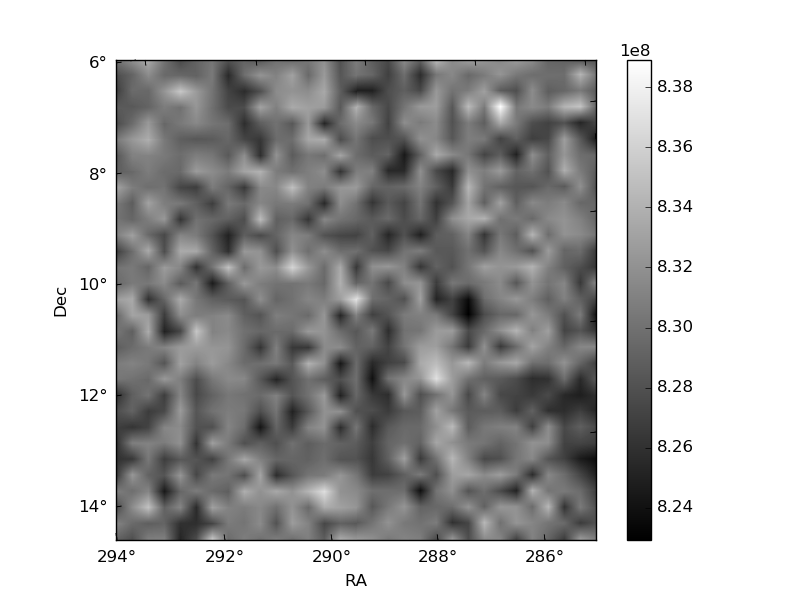
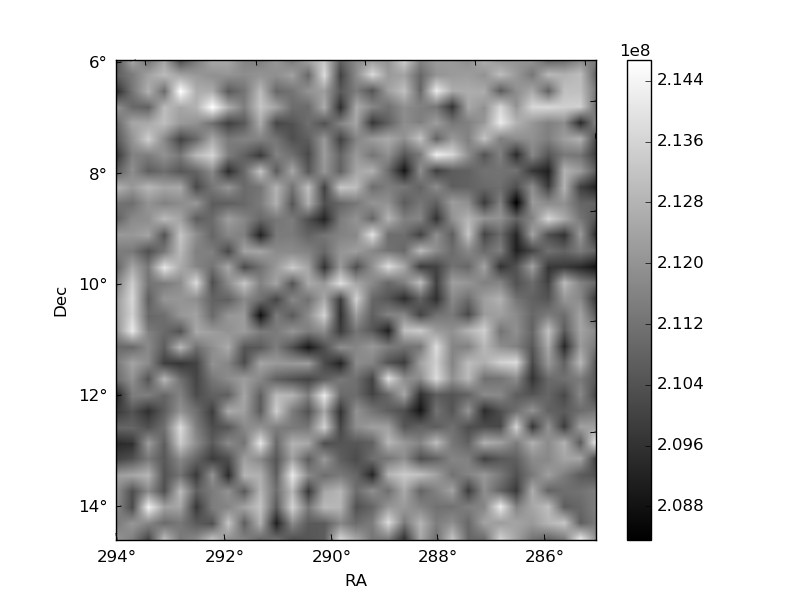
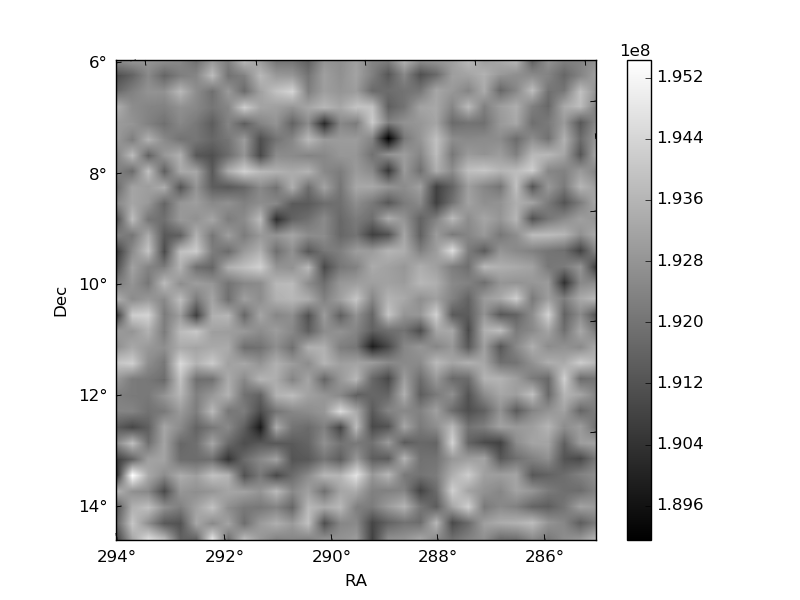
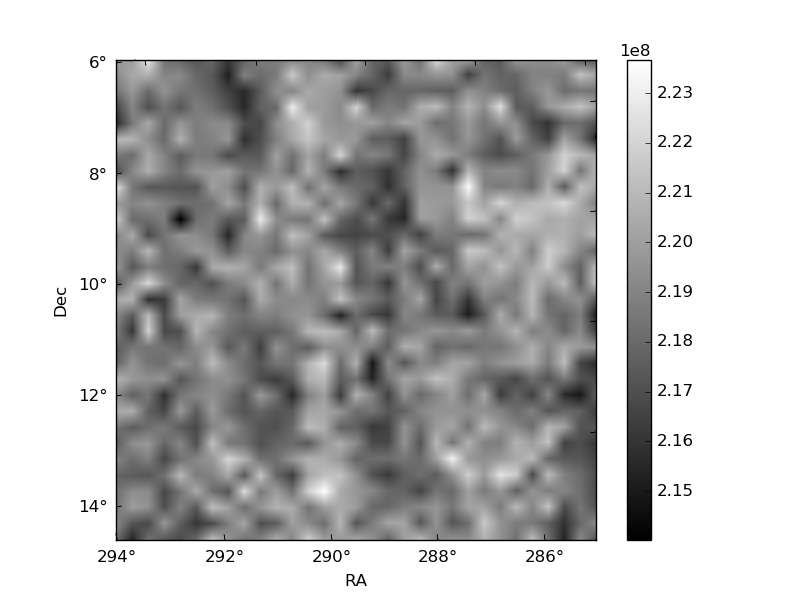
Histogram calculated using DETX and DETY for each event in the final _common_clean file
| Quadrant A | 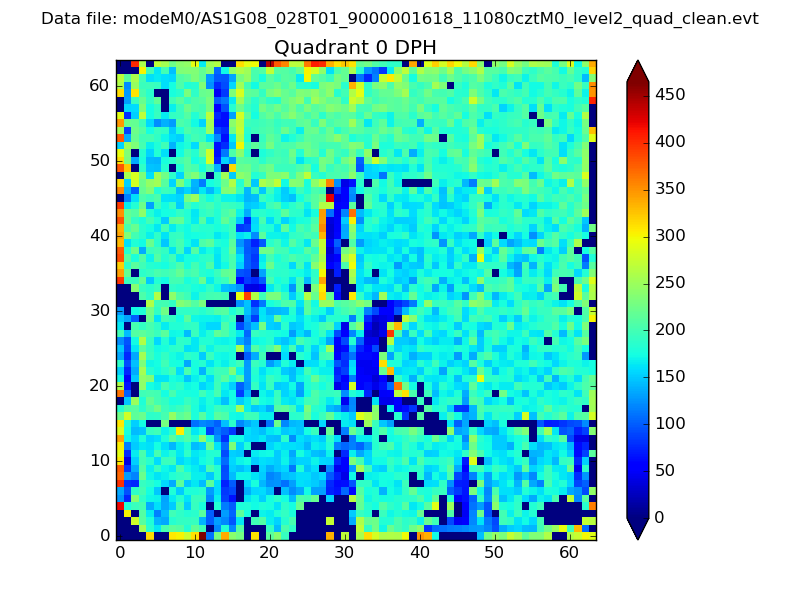 |
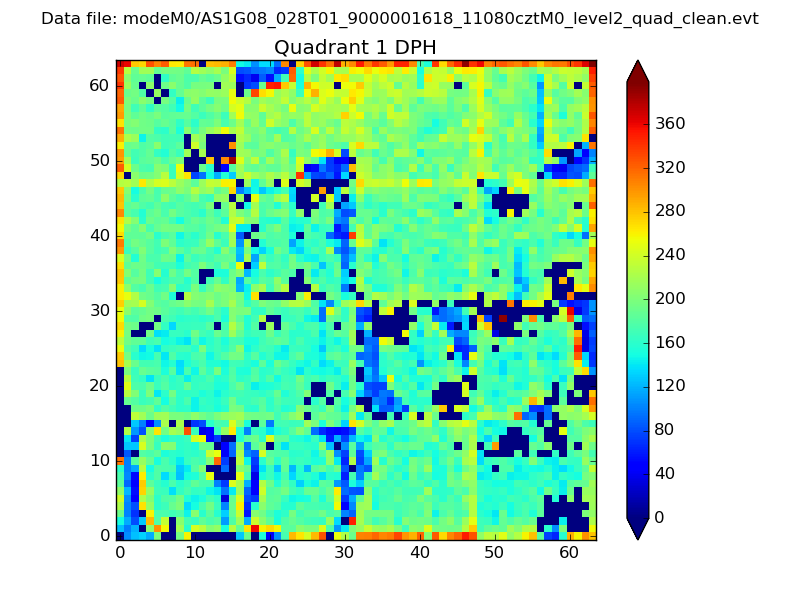 |
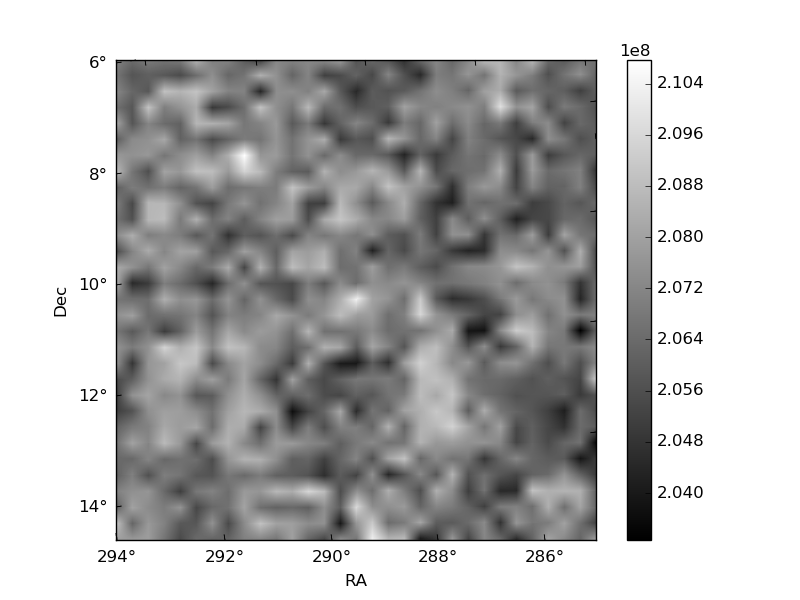
Quadrant B |
|---|---|---|---|
| Quadrant D | 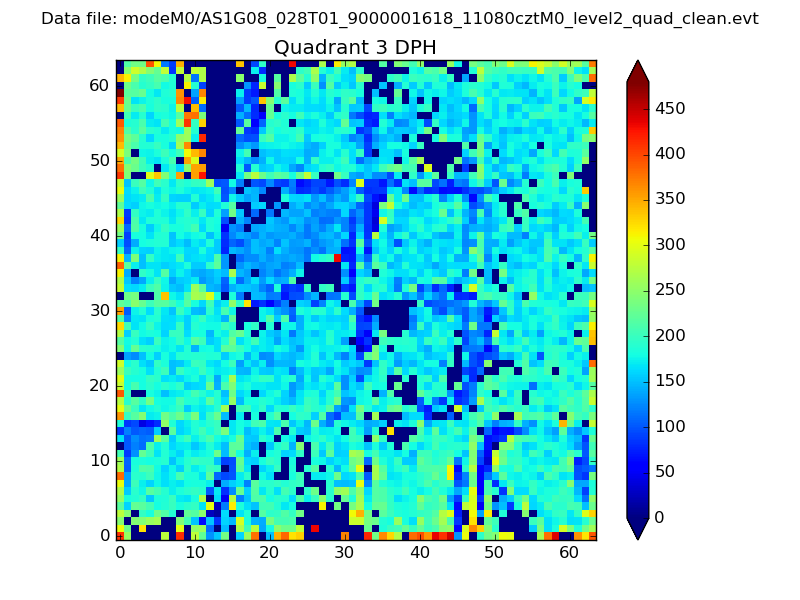 |
 |
Quadrant C |
| Plot type | Count rate plots | Images |
|---|---|---|
| Comparison with Poisson distribution Blue bars denote a histogram of data divided into 1 sec bins. Red curve is a Poisson curve with rate = median count rate of data. |
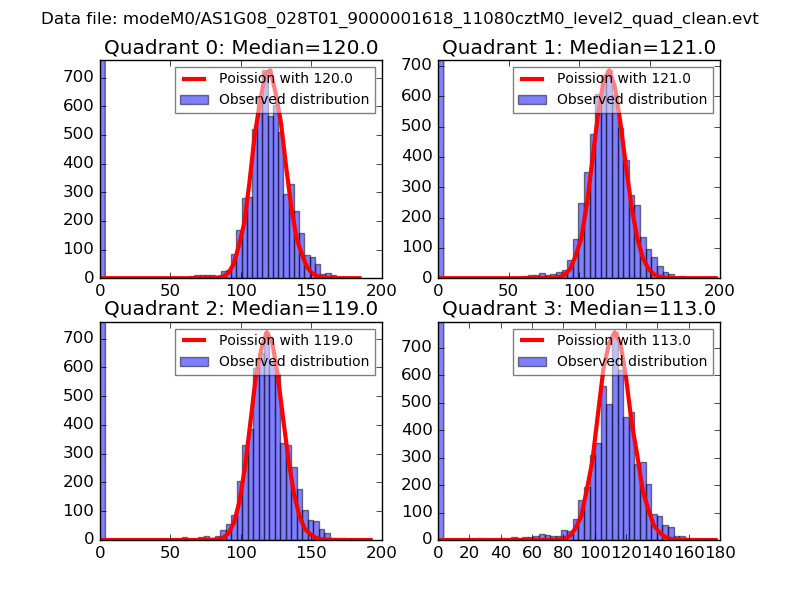 |
 |
| Quadrant-wise count rates Data is divided into 100 sec bins |
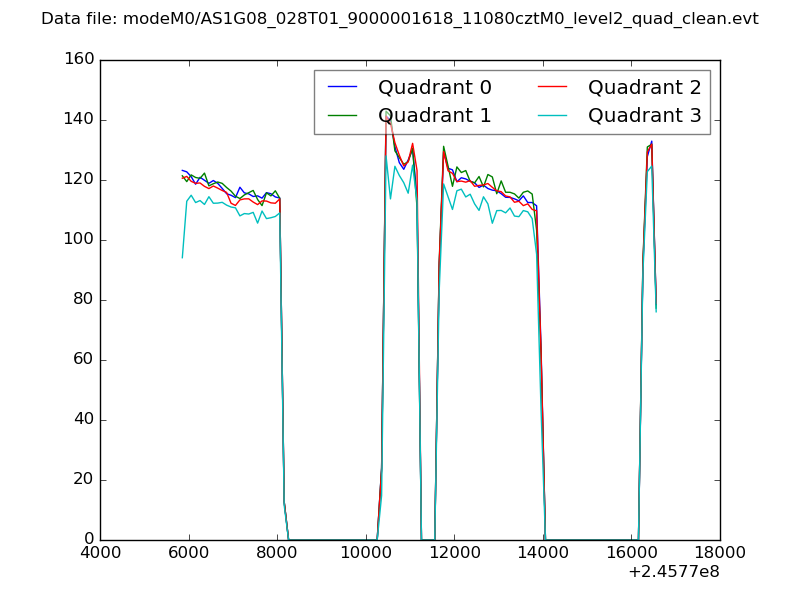 |
|
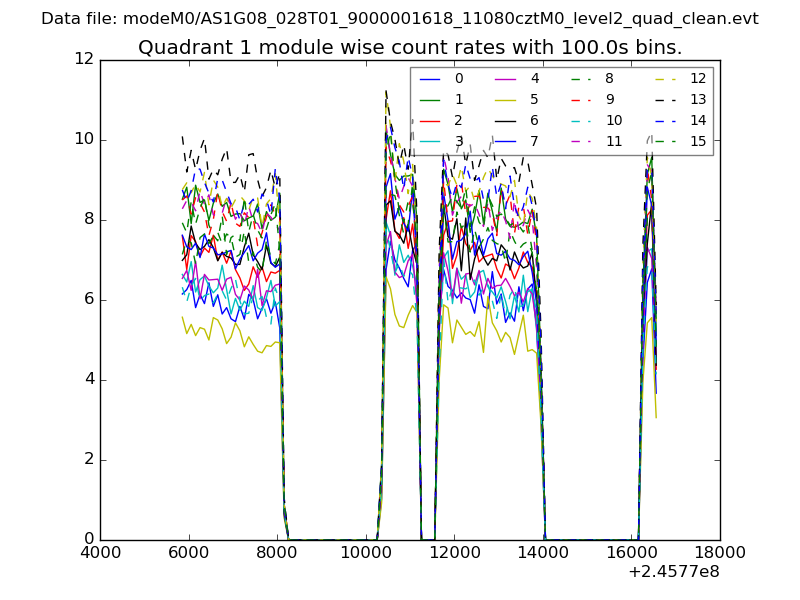
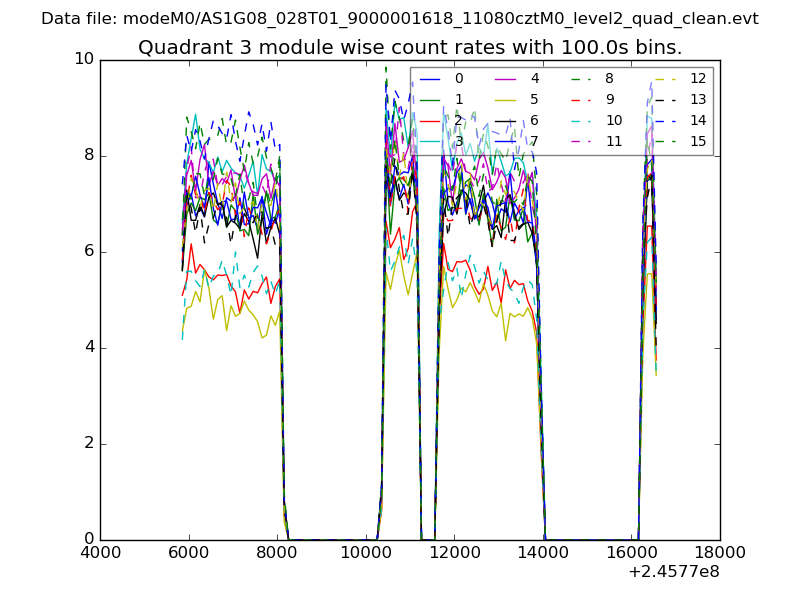
| Module-wise count rates for Quadrant A Data is divided into 100 sec bins |
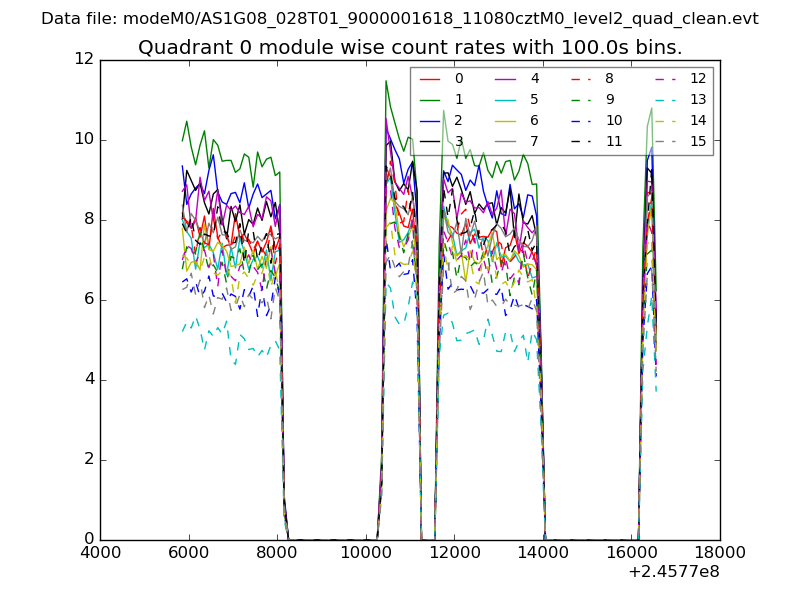 |
 |
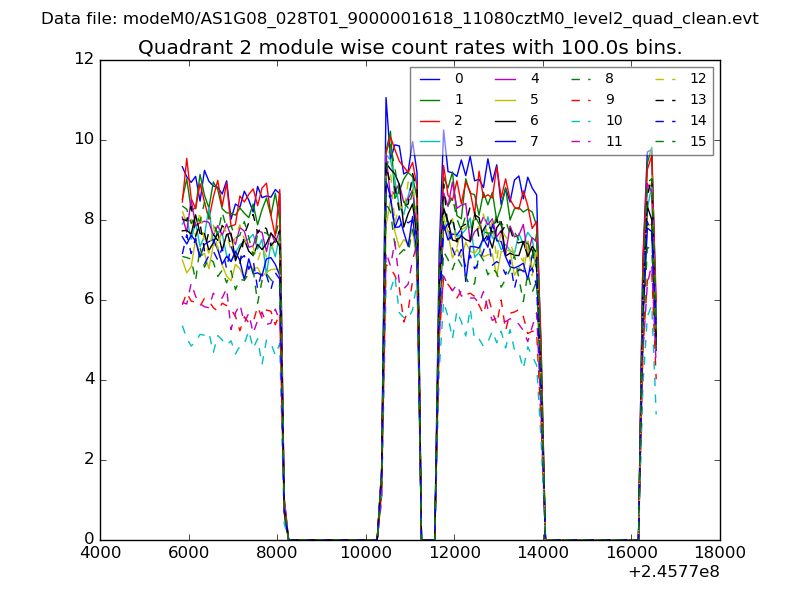
| Module-wise count rates for Quadrant B Data is divided into 100 sec bins |
 |
 |
| Module-wise count rates for Quadrant C Data is divided into 100 sec bins |
 |
 |
| Module-wise count rates for Quadrant D Data is divided into 100 sec bins |
 |
 |
| Parameter | Plot |
|---|---|
| CZT HV Monitor | 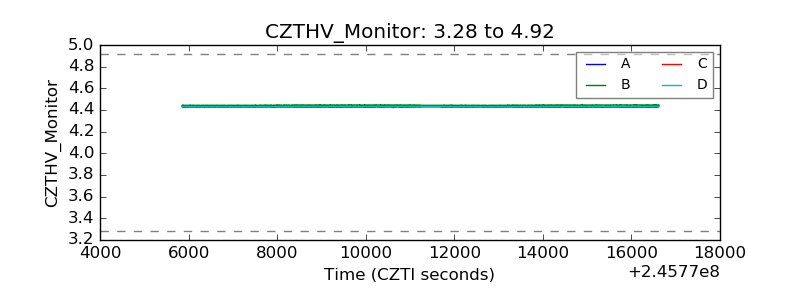 |
| D_VDD |  |
| Temperature 1 | 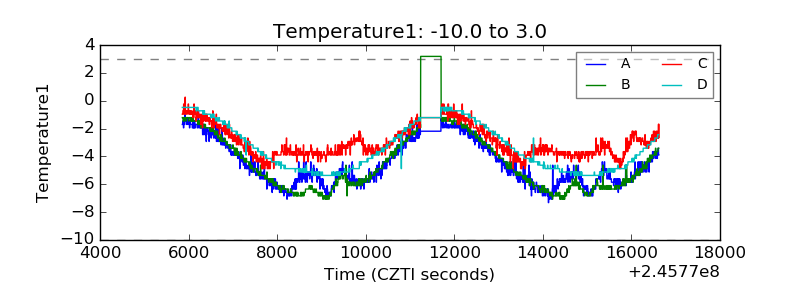 |
| Veto HV Monitor | 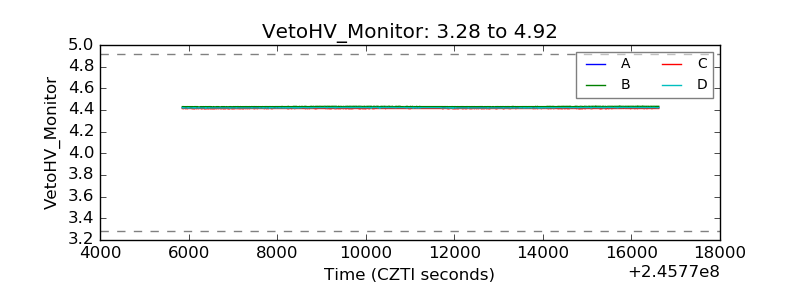 |
| Veto LLD | 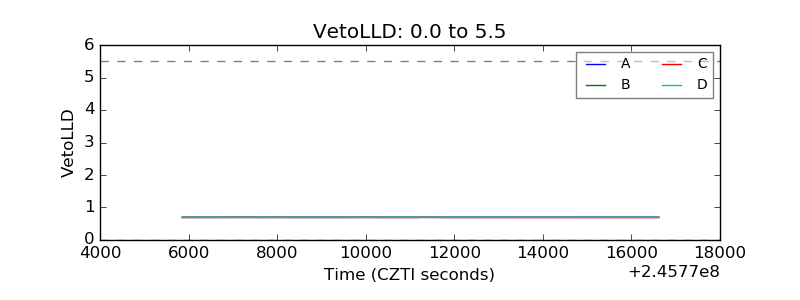 |
| Alpha Counter | 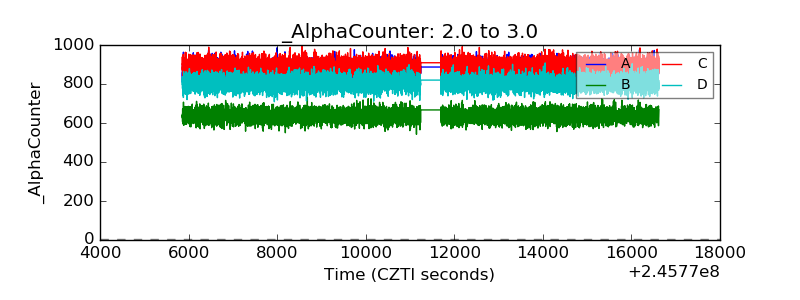 |
| _CPM_Rate | 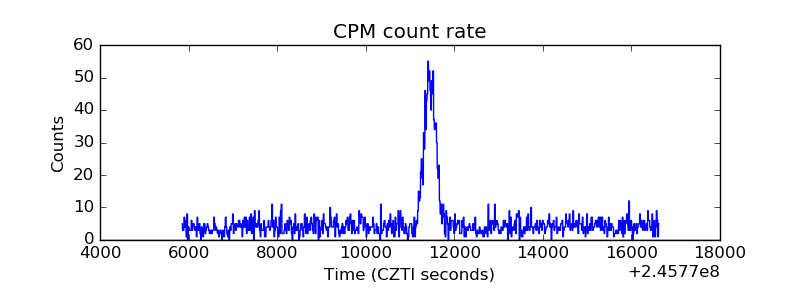 |
| CZT Counter |  |
| +2.5 Volts monitor |  |
| +5 Volts monitor |  |
| _ROLL_ROT | 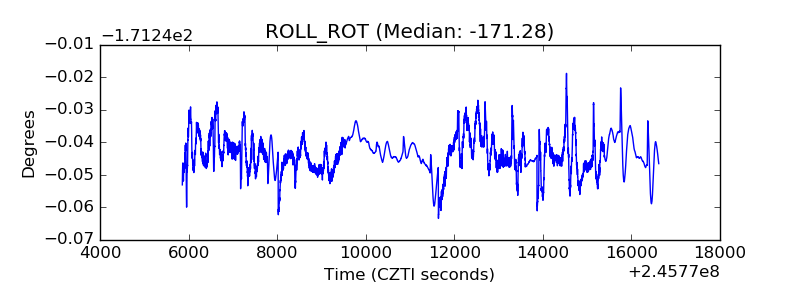 |
| _Roll_DEC | 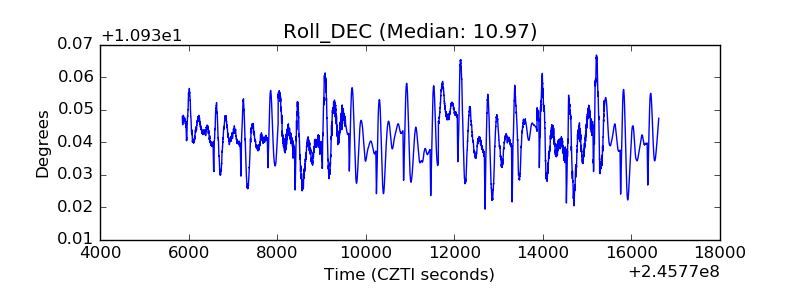 |
| _Roll_RA | 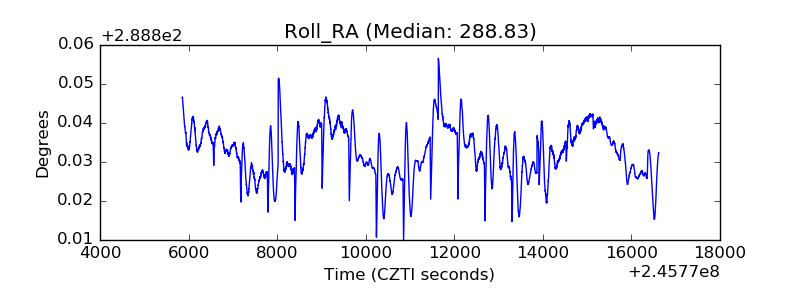 |
| Veto Counter | 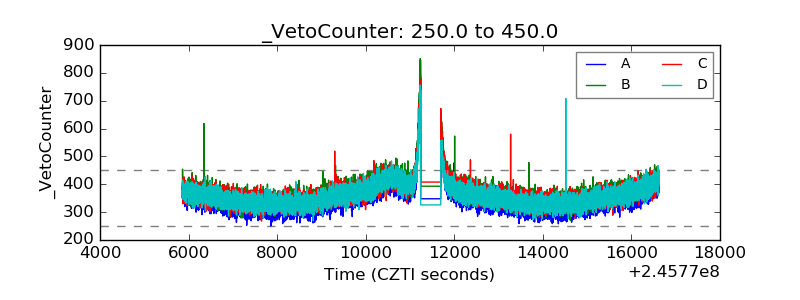 |