| Param | Original file | Final file |
|---|---|---|
| Filename | modeM0/AS1G08_071T02_9000001620cztM0_level2.fits | modeM0/AS1G08_071T02_9000001620cztM0_level2_quad_clean.evt |
| Size (bytes) | 2,737,235,520 | 2,517,719,040 |
| Size | 2.5 GB | 2.3 GB |
| Events in quadrant A | 16,424,764 | 14,432,716 |
| Events in quadrant B | 16,100,800 | 14,557,637 |
| Events in quadrant C | 16,544,566 | 14,427,078 |
| Events in quadrant D | 13,555,696 | 12,580,672 |
| Mode SS | |||
|---|---|---|---|
| Quadrant | BADHDUFLAG | Total packets | Discarded packets |
| A | 0 | 6018 | 0 |
| B | 0 | 6020 | 0 |
| C | 0 | 6024 | 0 |
| D | 0 | 6021 | 0 |
| Mode M9 | |||
|---|---|---|---|
| Quadrant | BADHDUFLAG | Total packets | Discarded packets |
| A | 0 | 455 | 0 |
| B | 0 | 455 | 0 |
| C | 0 | 455 | 0 |
| D | 0 | 455 | 0 |
| Mode M0 | |||
|---|---|---|---|
| Quadrant | BADHDUFLAG | Total packets | Discarded packets |
| A | 0 | 777155 | 0 |
| B | 0 | 735319 | 0 |
| C | 0 | 608882 | 0 |
| D | 0 | 880954 | 0 |
| Quadrant | Total seconds | Saturated seconds | Saturation percentage |
|---|---|---|---|
| A | 295640 | 15367 | 5.197876% |
| B | 295676 | 13335 | 4.510004% |
| C | 295691 | 2905 | 0.982445% |
| D | 295657 | 25620 | 8.665447% |
Noise dominated data is calculated using 1-second bins in cleaned event files. If a bin has >2000 counts, and if more than 50% of those come from <1% of pixels, then it is considered to be noise-dominated and hence unusable.
| Quadrant | # 1 sec bins | Bins with >0 counts | Bins with >2000 counts | High rate bins dominated by noise | Noise dominated (total time) | Noise dominated (detector-on time) | Marked lightcurve |
|---|---|---|---|---|---|---|---|
| A | 351125 | 295456 | 0 | 0 | 0.00% | 0.00% |  |
| B | 351125 | 295534 | 0 | 0 | 0.00% | 0.00% | 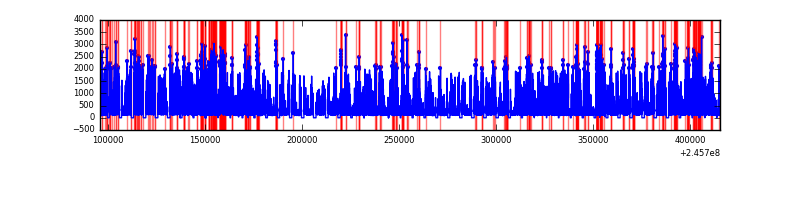 |
| C | 351125 | 295747 | 0 | 0 | 0.00% | 0.00% |  |
| D | 351125 | 294630 | 0 | 0 | 0.00% | 0.00% |  |
Top three noisy pixels from each quadrant. If the there are fewer than three noisy pixels in the level2.evt file, extra rows are filled as -1
| Pixel properties | Quadrant properties | ||||||
|---|---|---|---|---|---|---|---|
| Quadrant | DetID | PixID | Counts | Sigma | Mean | Median | Sigma |
| A | 0 | 29 | 15866 | 11.11 | 4281 | 3995 | 1068.1 |
| A | 7 | 110 | 13512 | 8.91 | 4281 | 3995 | 1068.1 |
| A | 0 | 30 | 12106 | 7.59 | 4281 | 3995 | 1068.1 |
| B | 2 | 9 | 13885 | 11.8 | 4248 | 4030 | 835.2 |
| B | 3 | 17 | 10853 | 8.17 | 4248 | 4030 | 835.2 |
| B | 2 | 8 | 10613 | 7.88 | 4248 | 4030 | 835.2 |
| C | 1 | 80 | 12142 | 7.11 | 4371 | 4039 | 1139.2 |
| C | 1 | 81 | 11799 | 6.81 | 4371 | 4039 | 1139.2 |
| C | 12 | 241 | 11760 | 6.78 | 4371 | 4039 | 1139.2 |
| D | 6 | 231 | 10176 | 6.37 | 3870 | 3498 | 1047.8 |
| D | 3 | 14 | 10103 | 6.3 | 3870 | 3498 | 1047.8 |
| D | 7 | 5 | 9645 | 5.87 | 3870 | 3498 | 1047.8 |
Histogram calculated using DETX and DETY for each event in the final _common_clean file
| Quadrant A |  |
 |
Quadrant B |
|---|---|---|---|
| Quadrant D |  |
 |
Quadrant C |
| Plot type | Count rate plots | Images |
|---|---|---|
| Comparison with Poisson distribution Blue bars denote a histogram of data divided into 1 sec bins. Red curve is a Poisson curve with rate = median count rate of data. |
 |
 |
| Quadrant-wise count rates Data is divided into 100 sec bins |
 |
|
| Module-wise count rates for Quadrant A Data is divided into 100 sec bins |
 |
 |
| Module-wise count rates for Quadrant B Data is divided into 100 sec bins |
 |
 |
| Module-wise count rates for Quadrant C Data is divided into 100 sec bins |
 |
 |
| Module-wise count rates for Quadrant D Data is divided into 100 sec bins |
 |
 |
| Parameter | Plot |
|---|---|
| CZT HV Monitor |  |
| D_VDD |  |
| Temperature 1 |  |
| Veto HV Monitor |  |
| Veto LLD |  |
| Alpha Counter |  |
| _CPM_Rate |  |
| CZT Counter |  |
| +2.5 Volts monitor |  |
| +5 Volts monitor |  |
| _ROLL_ROT |  |
| _Roll_DEC |  |
| _Roll_RA |  |
| Veto Counter |  |