| Param | Original file | Final file |
|---|---|---|
| Filename | modeM0/AS1G08_071T02_9000001620_11082cztM0_level2.evt | modeM0/AS1G08_071T02_9000001620_11082cztM0_level2_quad_clean.evt |
| Size (bytes) | 415,612,800 | 59,699,520 |
| Size | 396.4 MB | 56.9 MB |
| Events in quadrant A | 2,767,854 | 368,309 |
| Events in quadrant B | 3,464,620 | 366,677 |
| Events in quadrant C | 2,285,400 | 367,941 |
| Events in quadrant D | 3,720,272 | 344,826 |
| Mode SS | |||
|---|---|---|---|
| Quadrant | BADHDUFLAG | Total packets | Discarded packets |
| A | 0 | 104 | 0 |
| B | 0 | 104 | 0 |
| C | 0 | 104 | 0 |
| D | 0 | 104 | 0 |
| Mode M9 | |||
|---|---|---|---|
| Quadrant | BADHDUFLAG | Total packets | Discarded packets |
| A | 0 | 10 | 0 |
| B | 0 | 10 | 0 |
| C | 0 | 10 | 0 |
| D | 0 | 10 | 0 |
| Mode M0 | |||
|---|---|---|---|
| Quadrant | BADHDUFLAG | Total packets | Discarded packets |
| A | 0 | 11968 | 2 |
| B | 0 | 13721 | 1 |
| C | 0 | 10446 | 1 |
| D | 0 | 14462 | 1 |
| Quadrant | Total seconds | Saturated seconds | Saturation percentage |
|---|---|---|---|
| A | 5133 | 42 | 0.818235% |
| B | 5133 | 309 | 6.019871% |
| C | 5133 | 18 | 0.350672% |
| D | 5133 | 214 | 4.169102% |
Noise dominated data is calculated using 1-second bins in cleaned event files. If a bin has >2000 counts, and if more than 50% of those come from <1% of pixels, then it is considered to be noise-dominated and hence unusable.
| Quadrant | # 1 sec bins | Bins with >0 counts | Bins with >2000 counts | High rate bins dominated by noise | Noise dominated (total time) | Noise dominated (detector-on time) | Marked lightcurve |
|---|---|---|---|---|---|---|---|
| A | 6113 | 5134 | 0 | 0 | 0.00% | 0.00% | 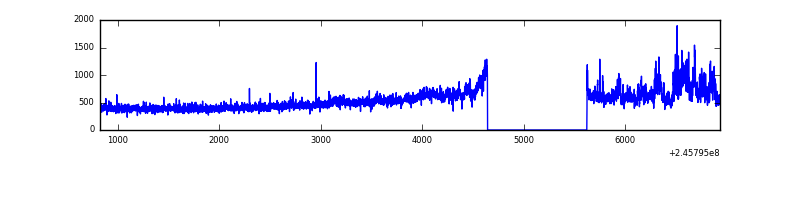 |
| B | 6113 | 5134 | 170 | 170 | 2.78% | 3.31% | 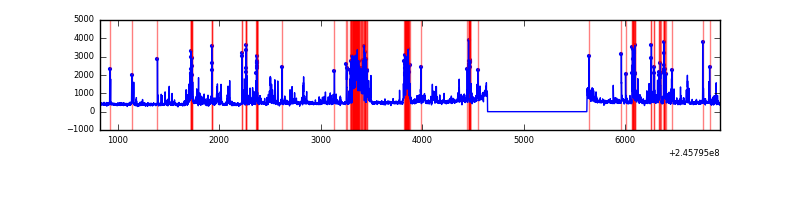 |
| C | 6113 | 5134 | 0 | 0 | 0.00% | 0.00% | 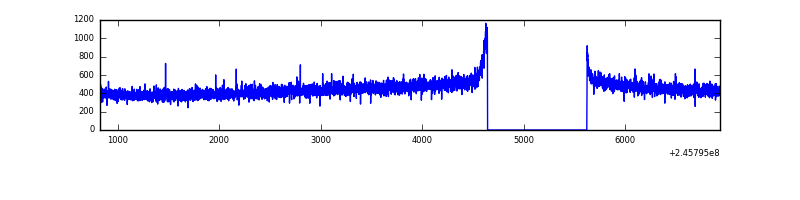 |
| D | 6113 | 5134 | 201 | 201 | 3.29% | 3.92% | 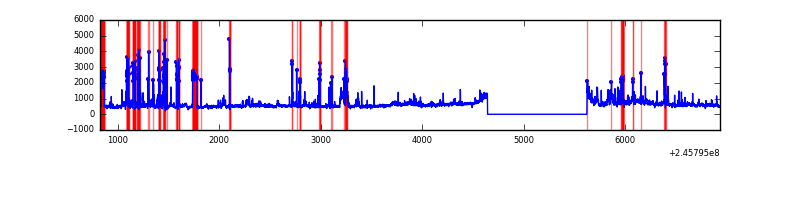 |
Top three noisy pixels from each quadrant. If the there are fewer than three noisy pixels in the level2.evt file, extra rows are filled as -1
| Pixel properties | Quadrant properties | ||||||
|---|---|---|---|---|---|---|---|
| Quadrant | DetID | PixID | Counts | Sigma | Mean | Median | Sigma |
| A | 8 | 15 | 337116 | 2718.84 | 599 | 584 | 123.8 |
| A | 15 | 174 | 106208 | 853.34 | 599 | 584 | 123.8 |
| A | 11 | 29 | 12216 | 93.97 | 599 | 584 | 123.8 |
| B | 4 | 239 | 968419 | 8490.53 | 591 | 577 | 114.0 |
| B | 0 | 214 | 57496 | 499.33 | 591 | 577 | 114.0 |
| B | 15 | 204 | 47166 | 408.71 | 591 | 577 | 114.0 |
| C | 13 | 61 | 4394 | 27.79 | 585 | 588 | 137.0 |
| C | 9 | 204 | 1849 | 9.21 | 585 | 588 | 137.0 |
| C | 14 | 234 | 1640 | 7.68 | 585 | 588 | 137.0 |
| D | 1 | 52 | 834294 | 6020.44 | 573 | 556 | 138.5 |
| D | 10 | 253 | 329715 | 2376.86 | 573 | 556 | 138.5 |
| D | 8 | 195 | 163968 | 1180.0 | 573 | 556 | 138.5 |
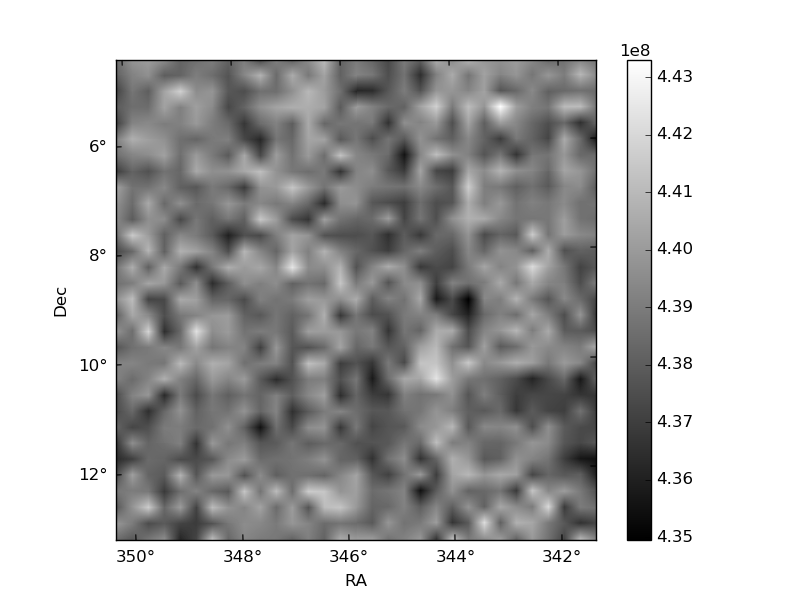
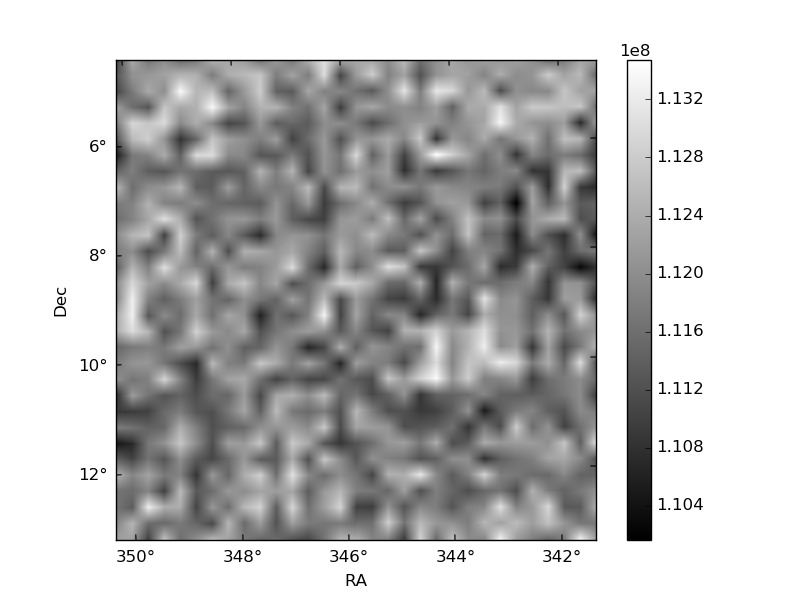
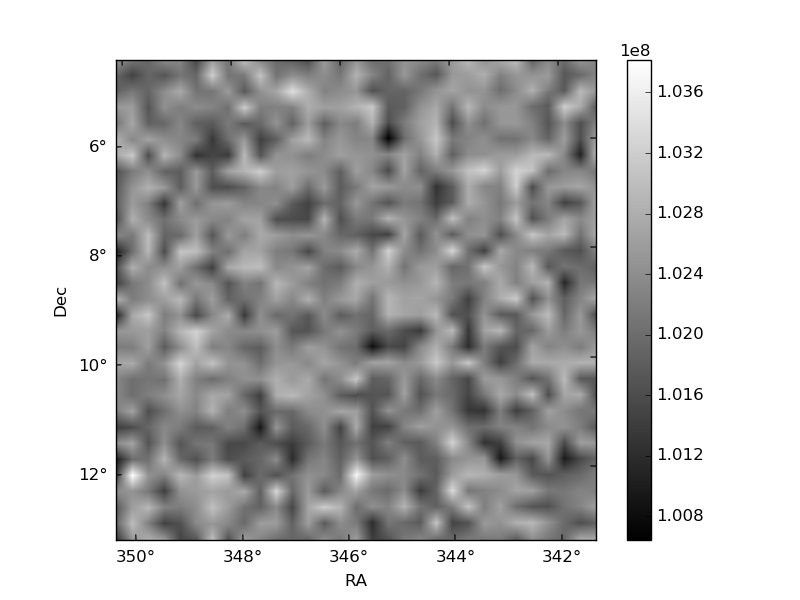
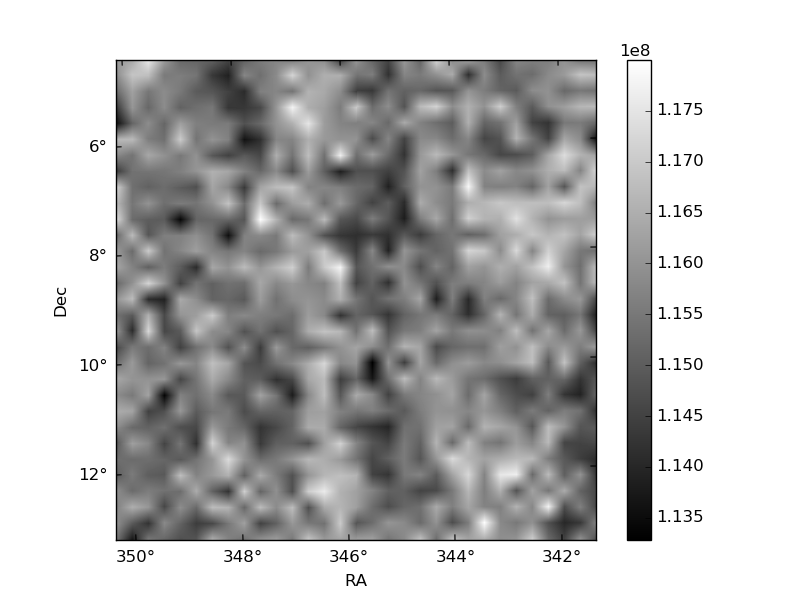
Histogram calculated using DETX and DETY for each event in the final _common_clean file
| Quadrant A | 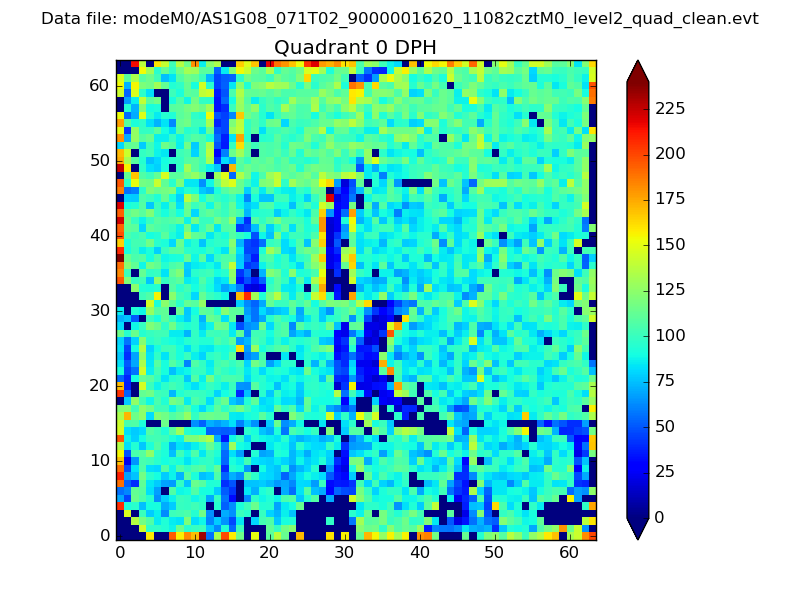 |
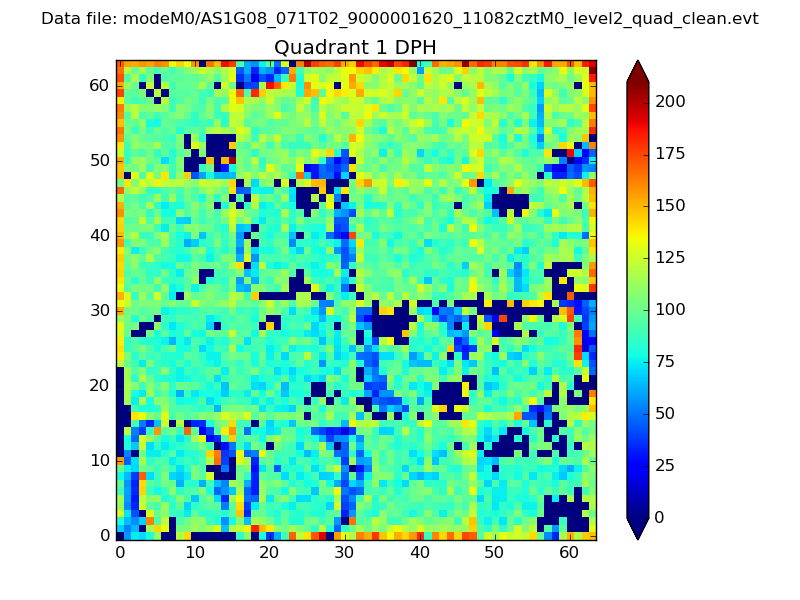 |
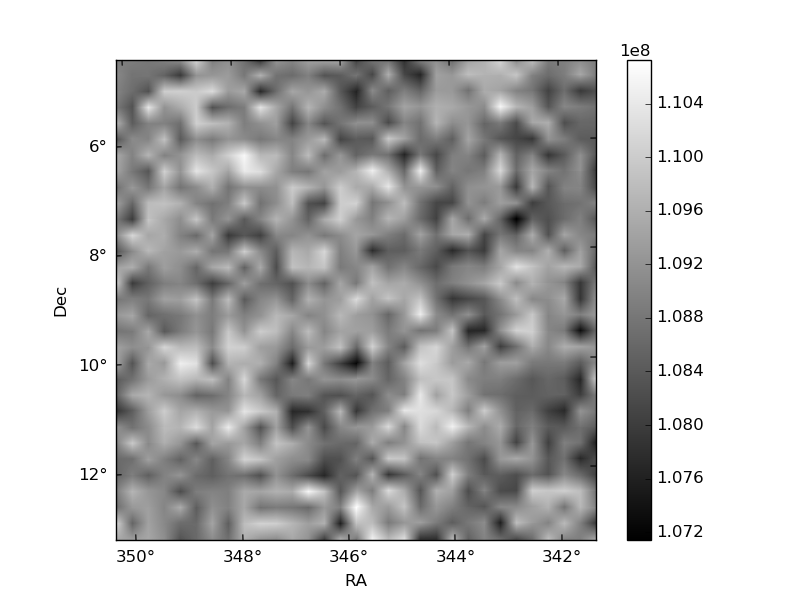
Quadrant B |
|---|---|---|---|
| Quadrant D | 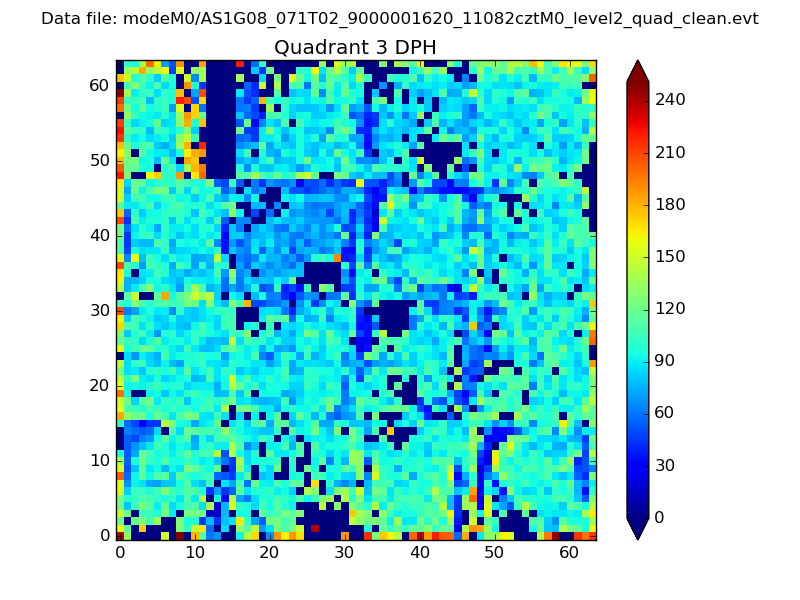 |
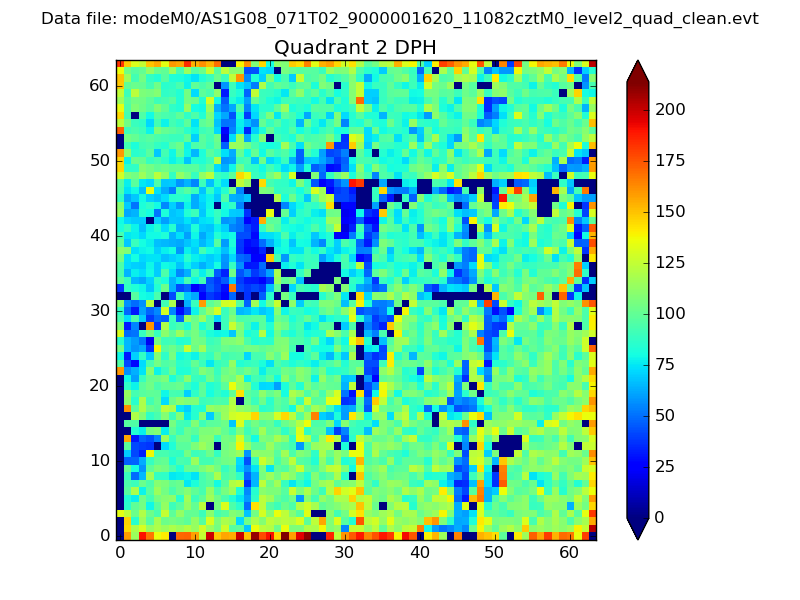 |
Quadrant C |
| Plot type | Count rate plots | Images |
|---|---|---|
| Comparison with Poisson distribution Blue bars denote a histogram of data divided into 1 sec bins. Red curve is a Poisson curve with rate = median count rate of data. |
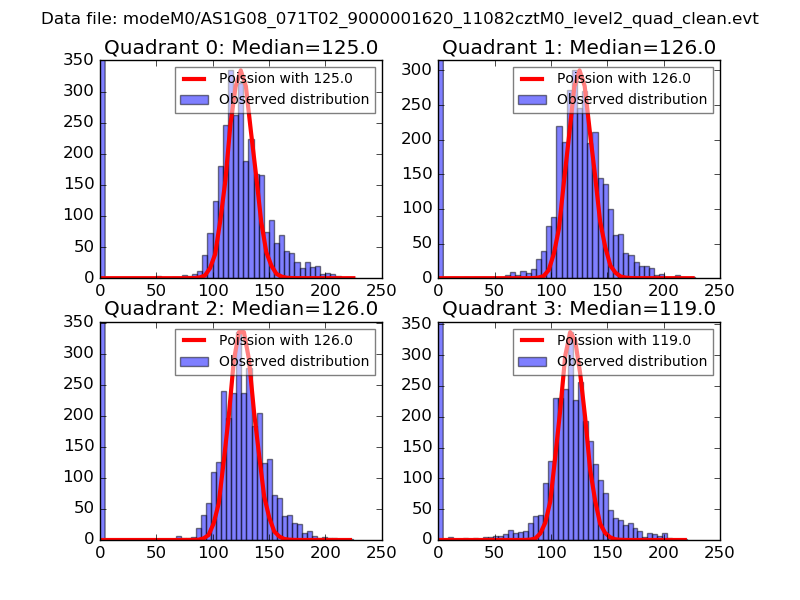 |
 |
| Quadrant-wise count rates Data is divided into 100 sec bins |
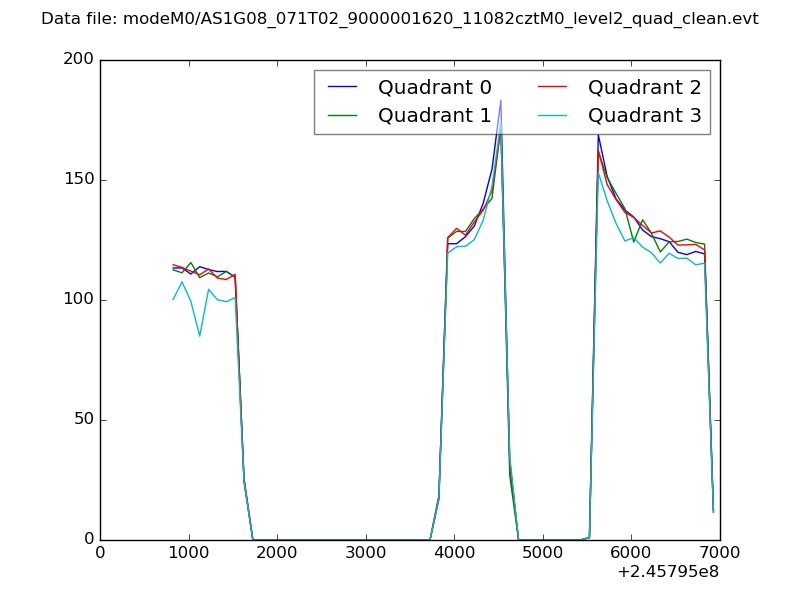 |
|
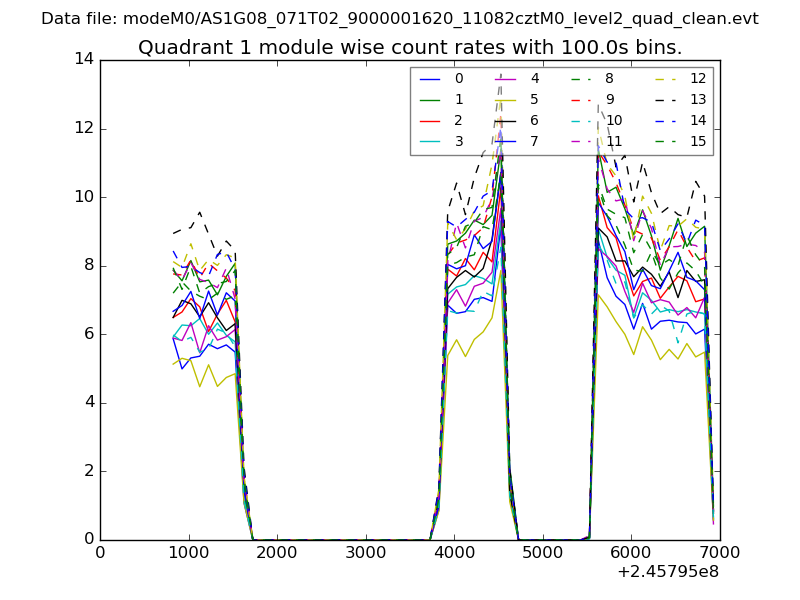
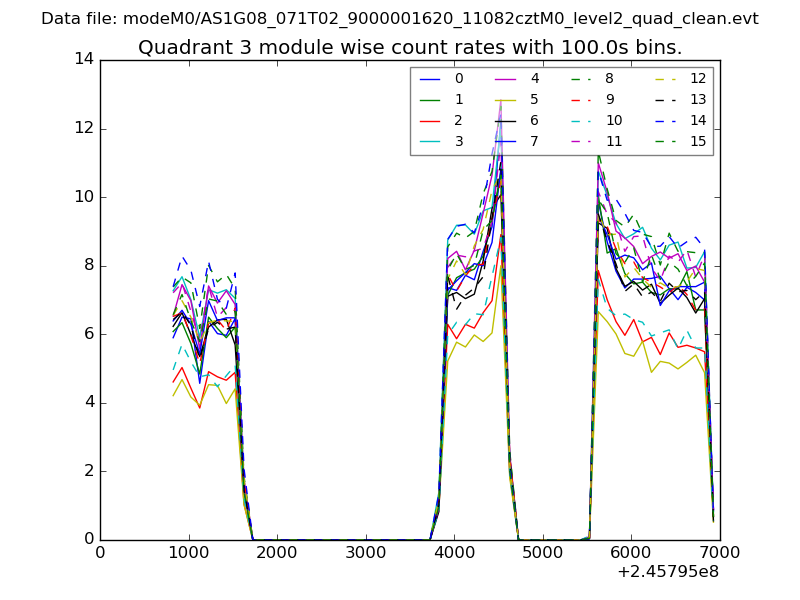
| Module-wise count rates for Quadrant A Data is divided into 100 sec bins |
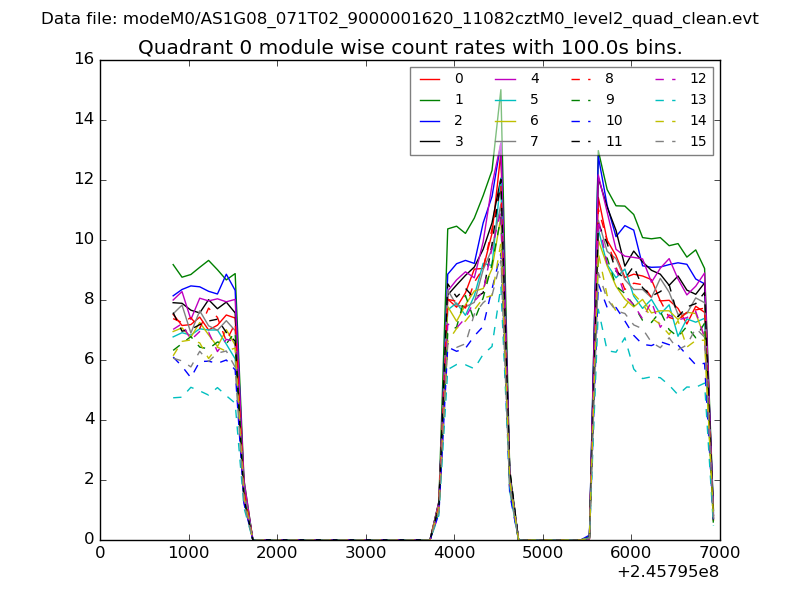 |
 |
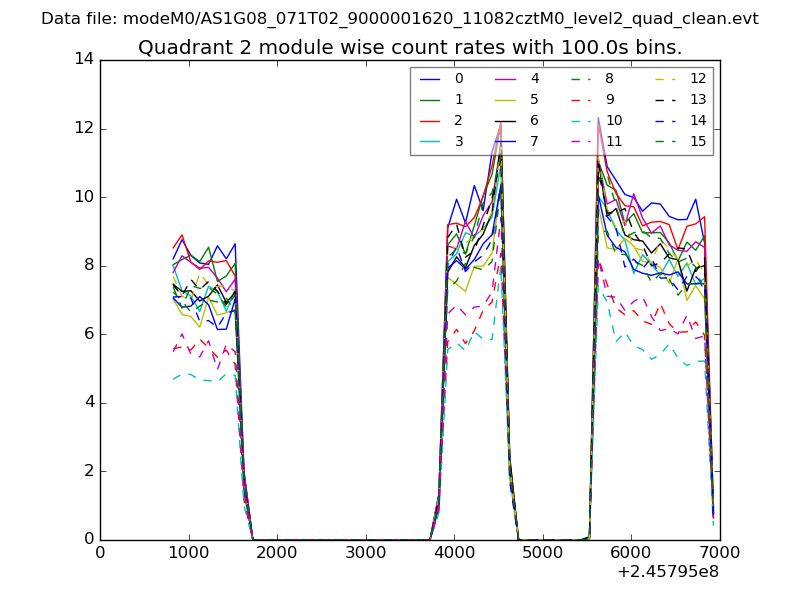
| Module-wise count rates for Quadrant B Data is divided into 100 sec bins |
 |
 |
| Module-wise count rates for Quadrant C Data is divided into 100 sec bins |
 |
 |
| Module-wise count rates for Quadrant D Data is divided into 100 sec bins |
 |
 |
| Parameter | Plot |
|---|---|
| CZT HV Monitor | 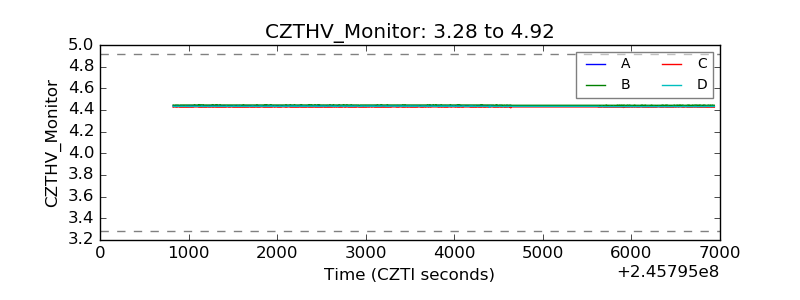 |
| D_VDD | 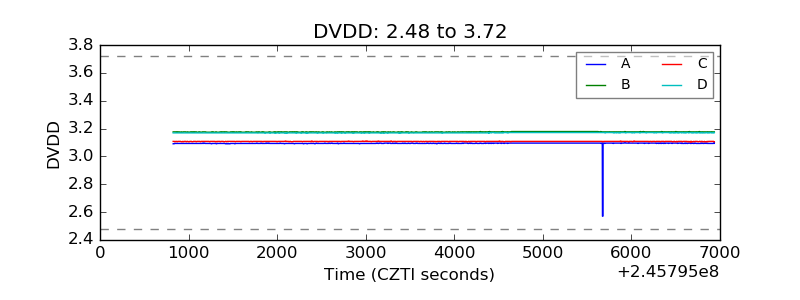 |
| Temperature 1 | 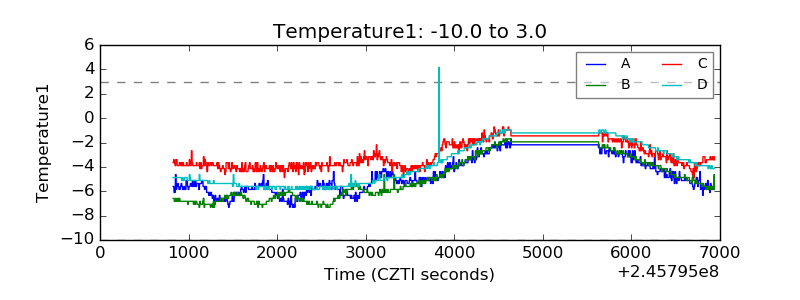 |
| Veto HV Monitor | 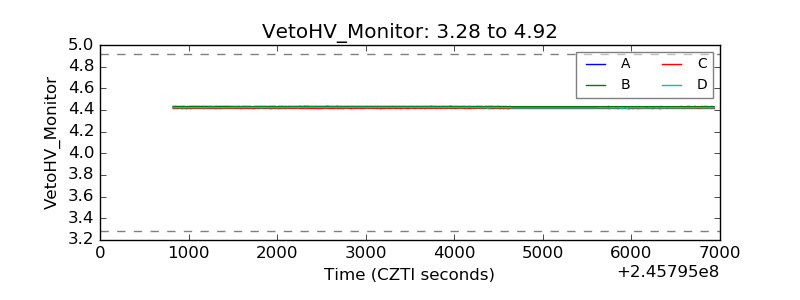 |
| Veto LLD | 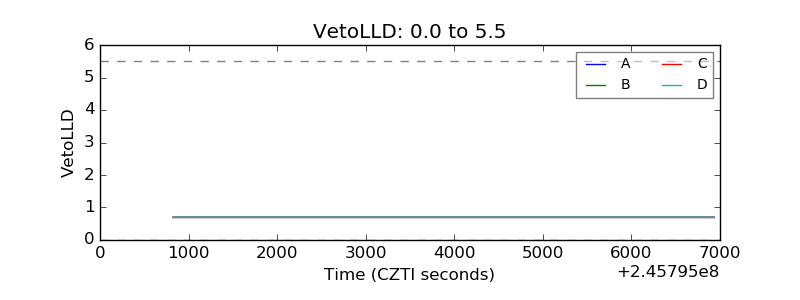 |
| Alpha Counter | 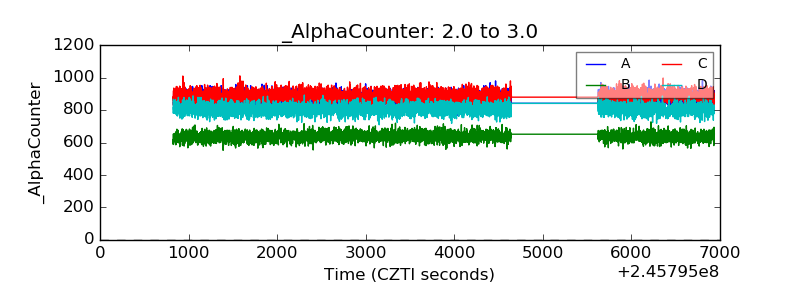 |
| _CPM_Rate | 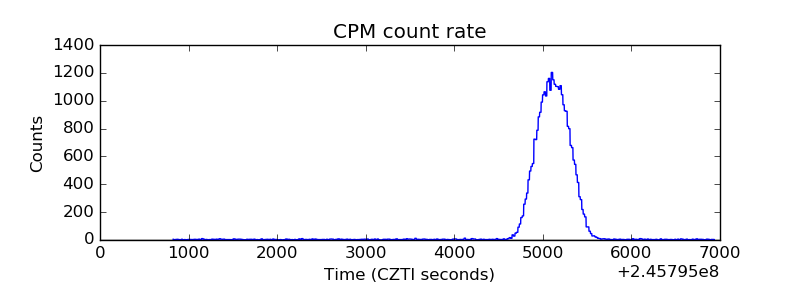 |
| CZT Counter | 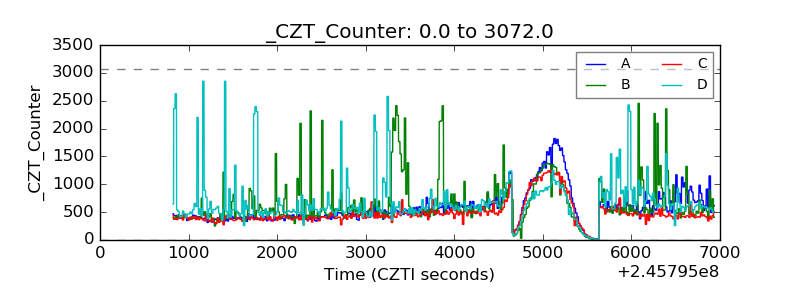 |
| +2.5 Volts monitor | 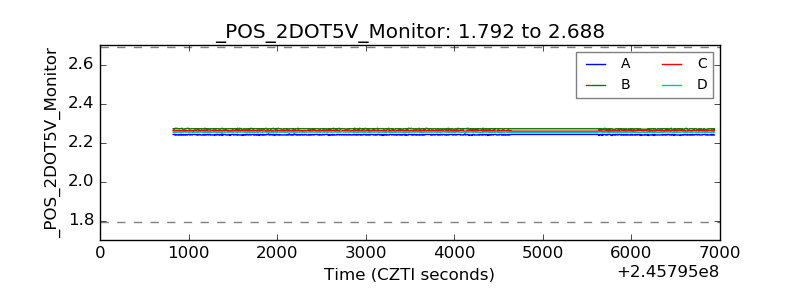 |
| +5 Volts monitor |  |
| _ROLL_ROT | 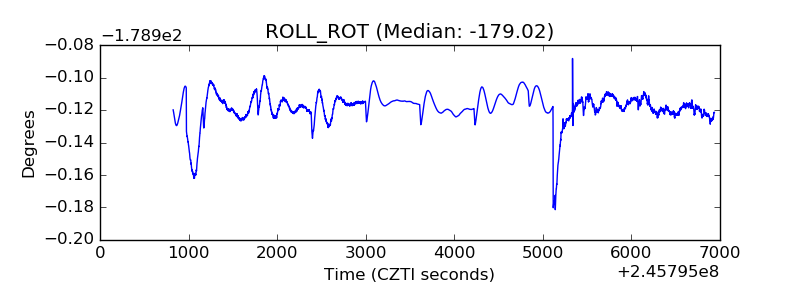 |
| _Roll_DEC | 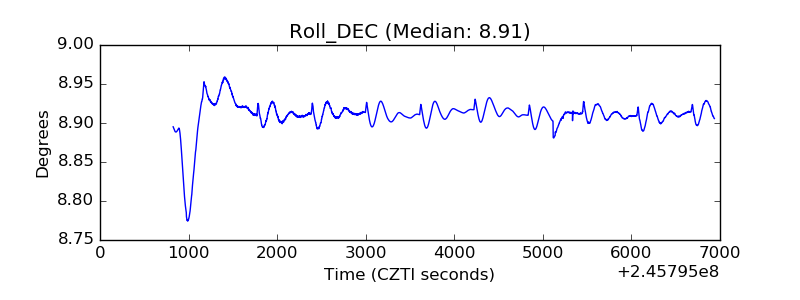 |
| _Roll_RA | 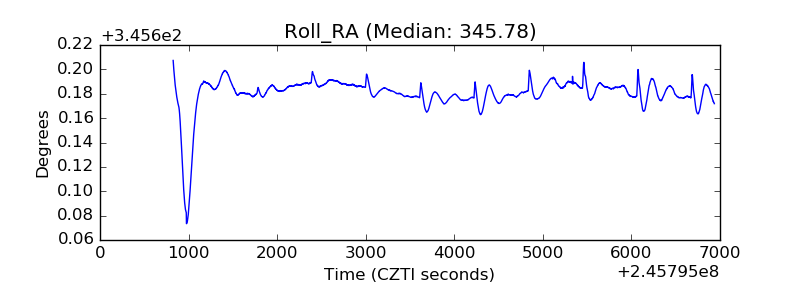 |
| Veto Counter | 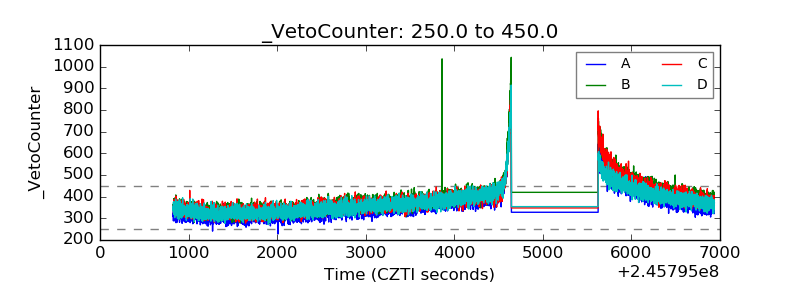 |