| Param | Original file | Final file |
|---|---|---|
| Filename | modeM0/AS1G08_071T02_9000001620_11086cztM0_level2.evt | modeM0/AS1G08_071T02_9000001620_11086cztM0_level2_quad_clean.evt |
| Size (bytes) | 561,401,280 | 74,309,760 |
| Size | 535.4 MB | 70.9 MB |
| Events in quadrant A | 3,167,063 | 469,765 |
| Events in quadrant B | 4,231,163 | 477,890 |
| Events in quadrant C | 2,874,580 | 467,218 |
| Events in quadrant D | 6,319,192 | 412,534 |
| Mode SS | |||
|---|---|---|---|
| Quadrant | BADHDUFLAG | Total packets | Discarded packets |
| A | 0 | 122 | 0 |
| B | 0 | 122 | 0 |
| C | 0 | 122 | 0 |
| D | 0 | 122 | 0 |
| Mode M9 | |||
|---|---|---|---|
| Quadrant | BADHDUFLAG | Total packets | Discarded packets |
| A | 0 | 18 | 0 |
| B | 0 | 18 | 0 |
| C | 0 | 18 | 0 |
| D | 0 | 19 | 0 |
| Mode M0 | |||
|---|---|---|---|
| Quadrant | BADHDUFLAG | Total packets | Discarded packets |
| A | 0 | 13054 | 3 |
| B | 0 | 16413 | 2 |
| C | 0 | 12369 | 2 |
| D | 0 | 22822 | 2 |
| Quadrant | Total seconds | Saturated seconds | Saturation percentage |
|---|---|---|---|
| A | 6055 | 15 | 0.247729% |
| B | 6055 | 248 | 4.095789% |
| C | 6055 | 5 | 0.082576% |
| D | 6055 | 1037 | 17.126342% |
Noise dominated data is calculated using 1-second bins in cleaned event files. If a bin has >2000 counts, and if more than 50% of those come from <1% of pixels, then it is considered to be noise-dominated and hence unusable.
| Quadrant | # 1 sec bins | Bins with >0 counts | Bins with >2000 counts | High rate bins dominated by noise | Noise dominated (total time) | Noise dominated (detector-on time) | Marked lightcurve |
|---|---|---|---|---|---|---|---|
| A | 7405 | 6056 | 0 | 0 | 0.00% | 0.00% | 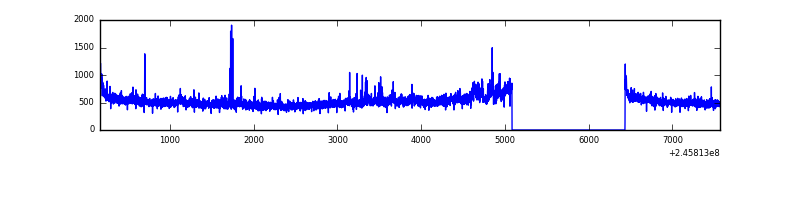 |
| B | 7405 | 6056 | 155 | 155 | 2.09% | 2.56% | 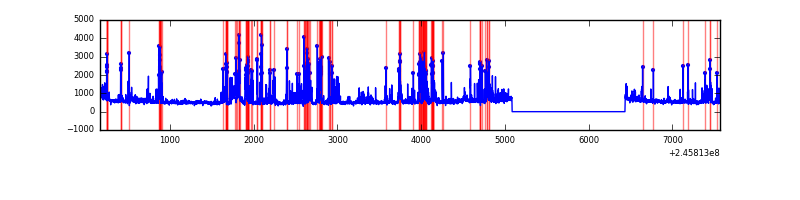 |
| C | 7405 | 6056 | 0 | 0 | 0.00% | 0.00% | 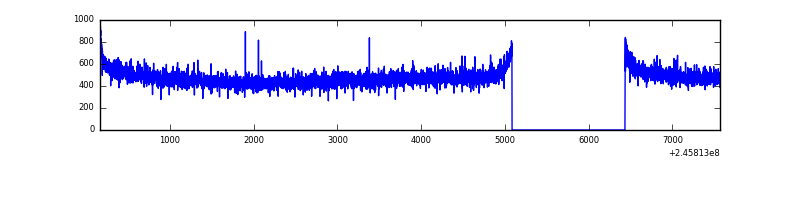 |
| D | 7404 | 6055 | 916 | 916 | 12.37% | 15.13% |  |
Top three noisy pixels from each quadrant. If the there are fewer than three noisy pixels in the level2.evt file, extra rows are filled as -1
| Pixel properties | Quadrant properties | ||||||
|---|---|---|---|---|---|---|---|
| Quadrant | DetID | PixID | Counts | Sigma | Mean | Median | Sigma |
| A | 8 | 15 | 163105 | 1048.96 | 762 | 748 | 154.8 |
| A | 14 | 238 | 31306 | 197.43 | 762 | 748 | 154.8 |
| A | 15 | 174 | 26758 | 168.05 | 762 | 748 | 154.8 |
| B | 4 | 239 | 908358 | 6359.31 | 763 | 746 | 142.7 |
| B | 10 | 16 | 210362 | 1468.7 | 763 | 746 | 142.7 |
| B | 0 | 214 | 50176 | 346.34 | 763 | 746 | 142.7 |
| C | 13 | 61 | 5545 | 28.13 | 736 | 743 | 170.7 |
| C | 8 | 222 | 2590 | 10.82 | 736 | 743 | 170.7 |
| C | 3 | 202 | 1771 | 6.02 | 736 | 743 | 170.7 |
| D | 10 | 253 | 2604980 | 16330.8 | 663 | 646 | 159.5 |
| D | 1 | 52 | 926002 | 5802.56 | 663 | 646 | 159.5 |
| D | 4 | 95 | 151681 | 947.08 | 663 | 646 | 159.5 |
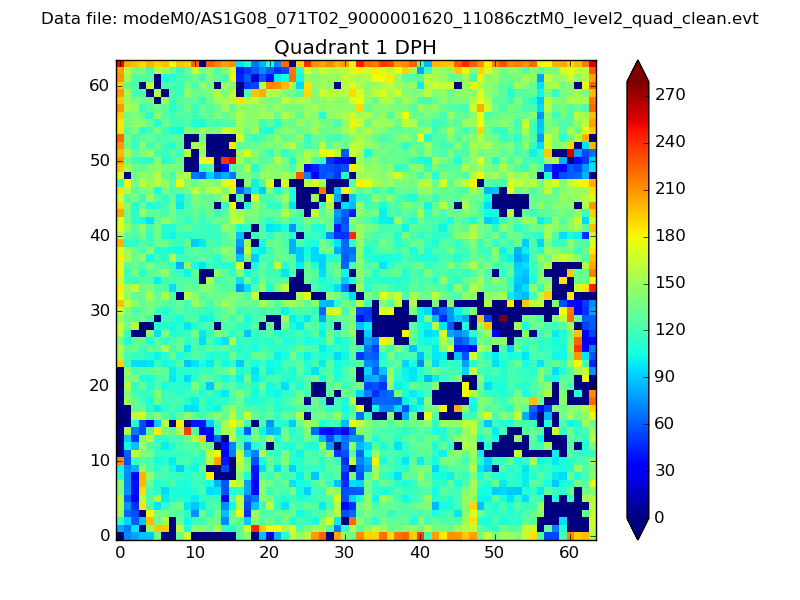
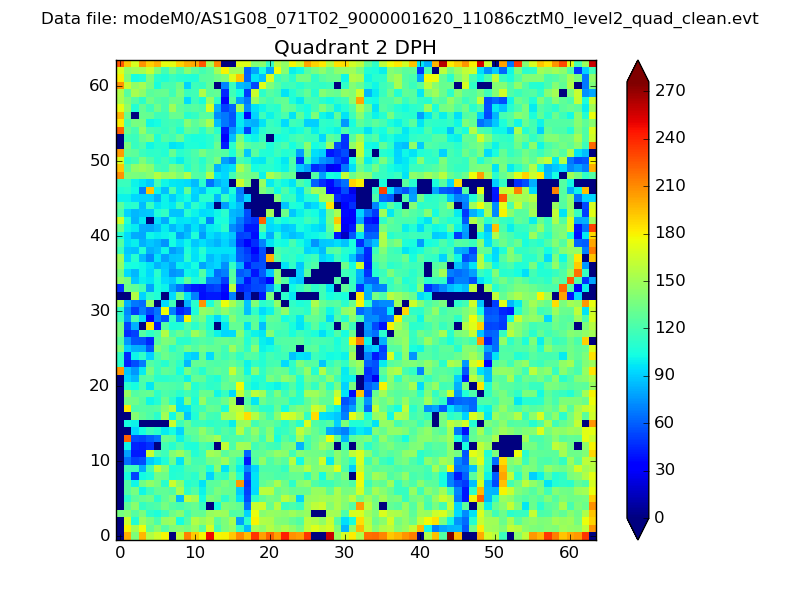
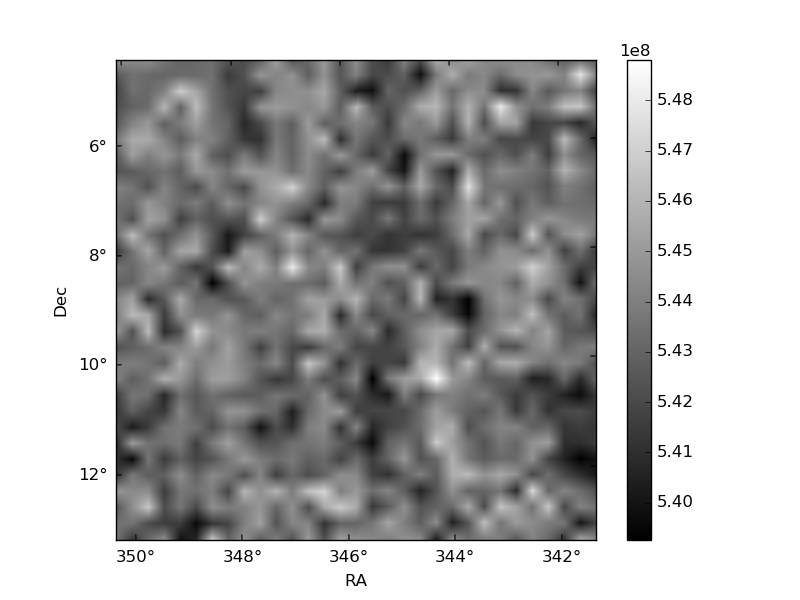
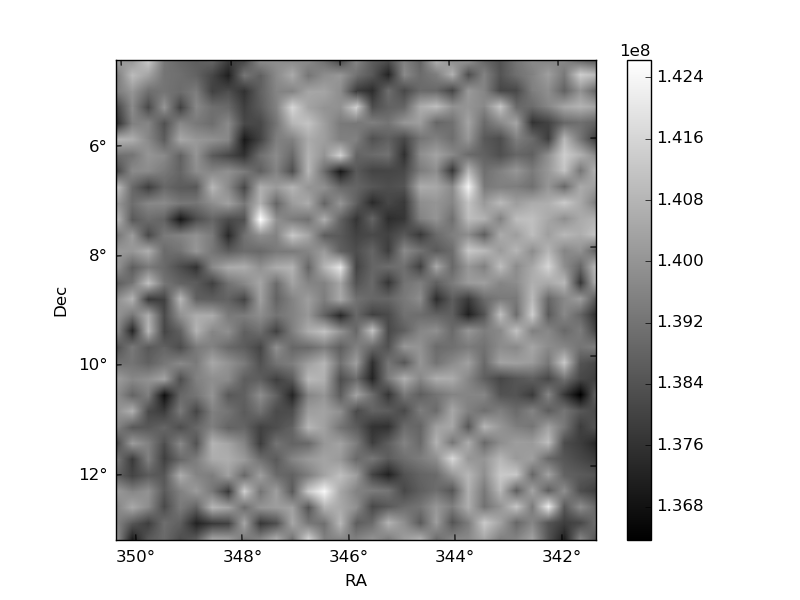
Histogram calculated using DETX and DETY for each event in the final _common_clean file
| Quadrant A | 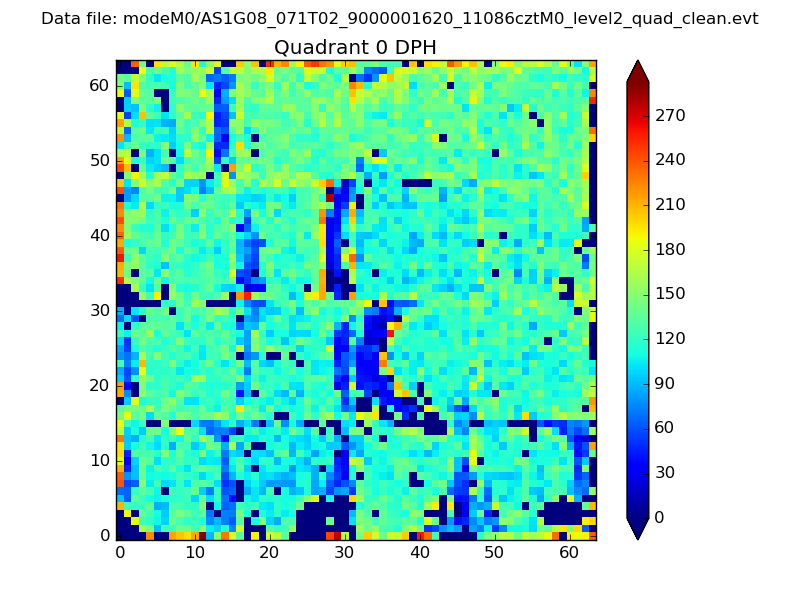 |
 |
Quadrant B |
|---|---|---|---|
| Quadrant D | 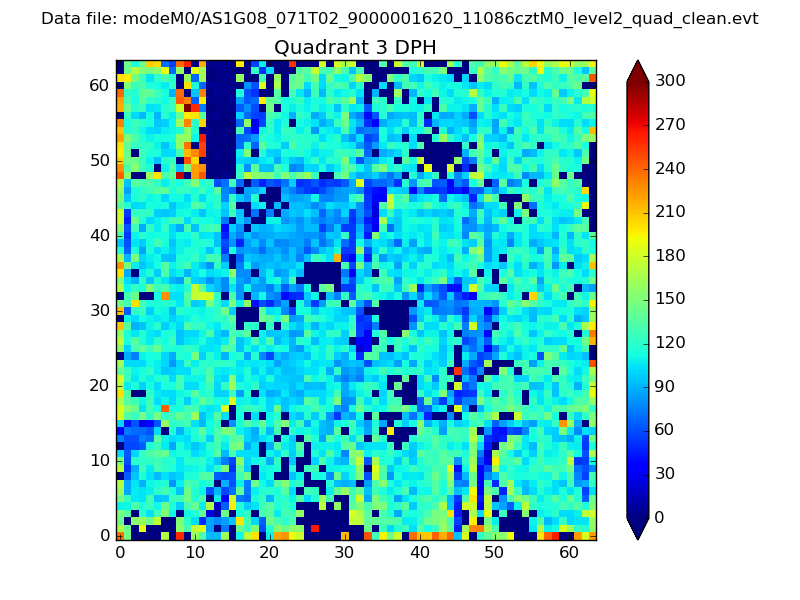 |
 |
Quadrant C |
| Plot type | Count rate plots | Images |
|---|---|---|
| Comparison with Poisson distribution Blue bars denote a histogram of data divided into 1 sec bins. Red curve is a Poisson curve with rate = median count rate of data. |
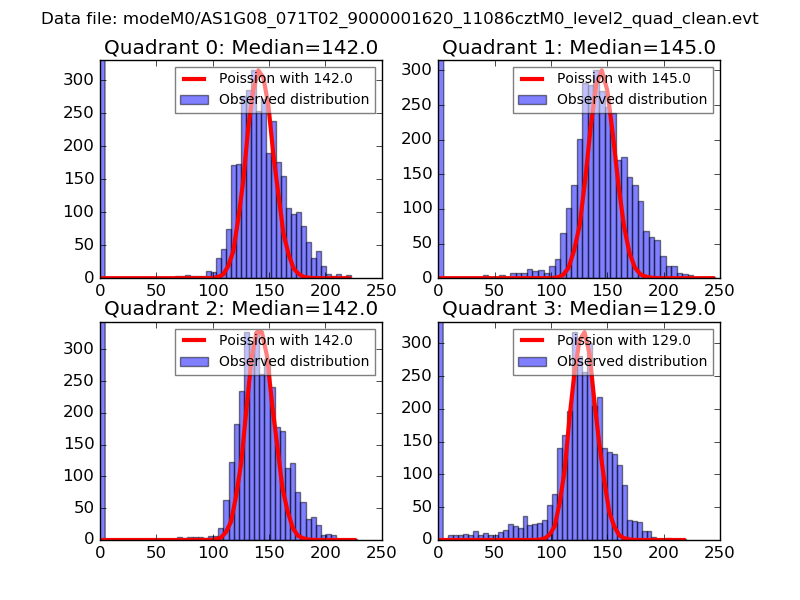 |
 |
| Quadrant-wise count rates Data is divided into 100 sec bins |
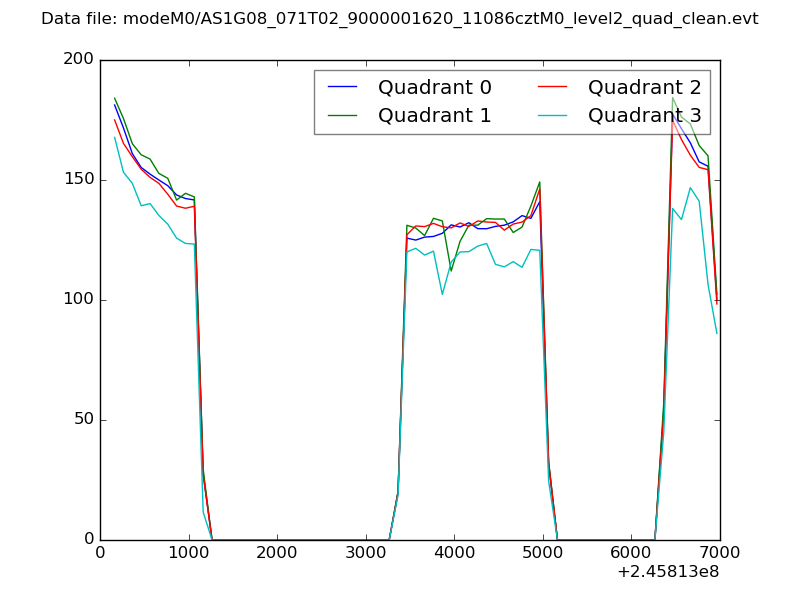 |
|
| Module-wise count rates for Quadrant A Data is divided into 100 sec bins |
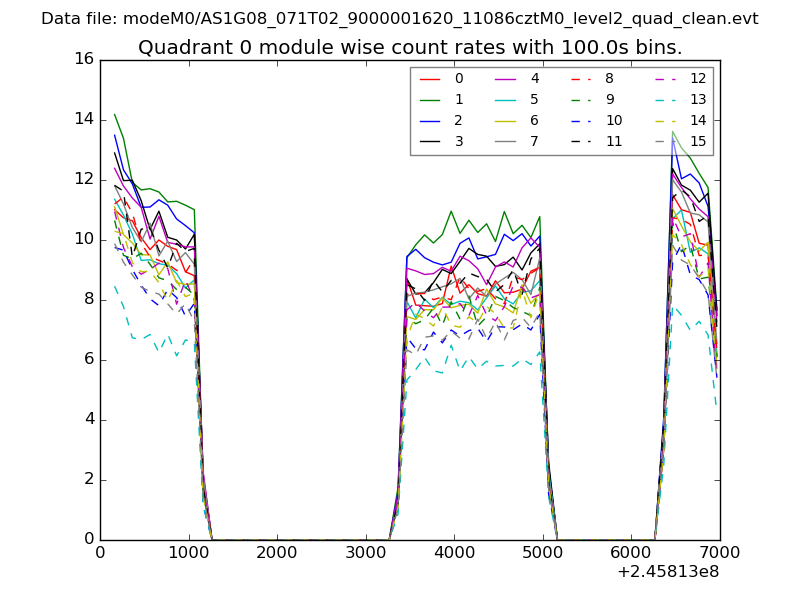 |
 |
| Module-wise count rates for Quadrant B Data is divided into 100 sec bins |
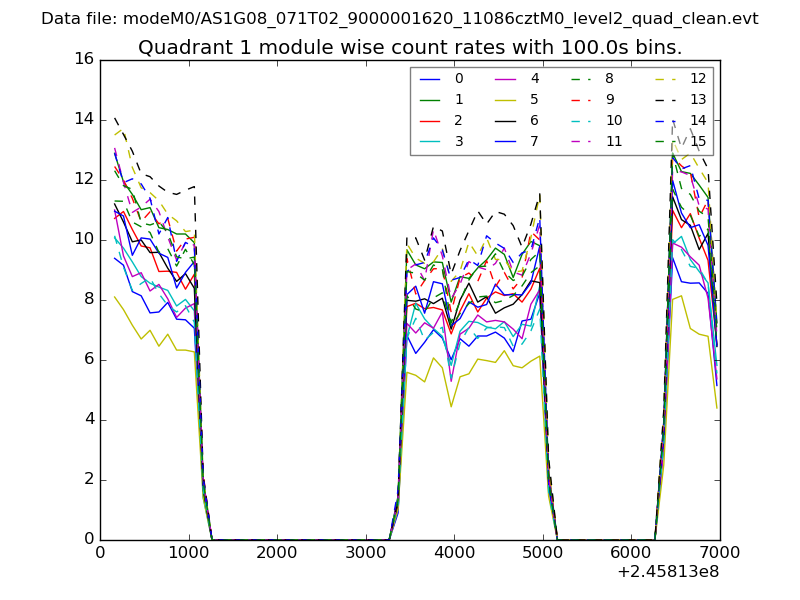 |
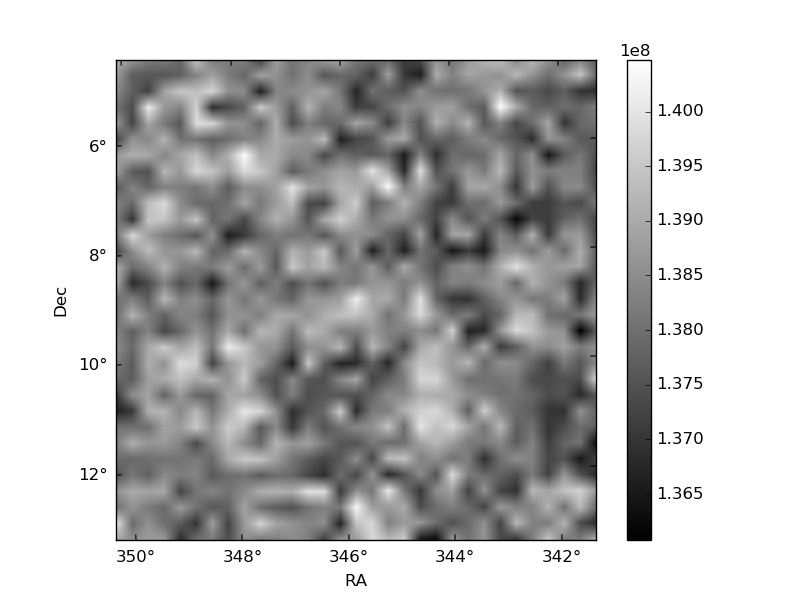 |
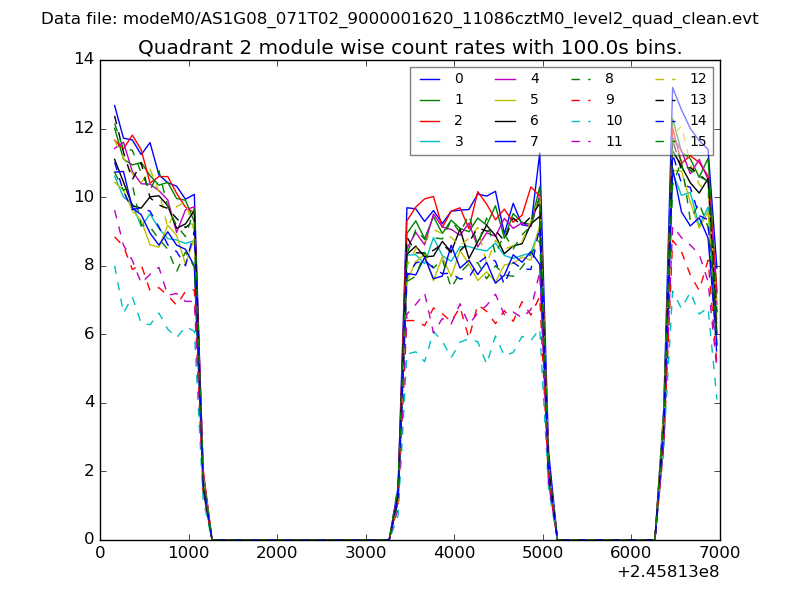
| Module-wise count rates for Quadrant C Data is divided into 100 sec bins |
 |
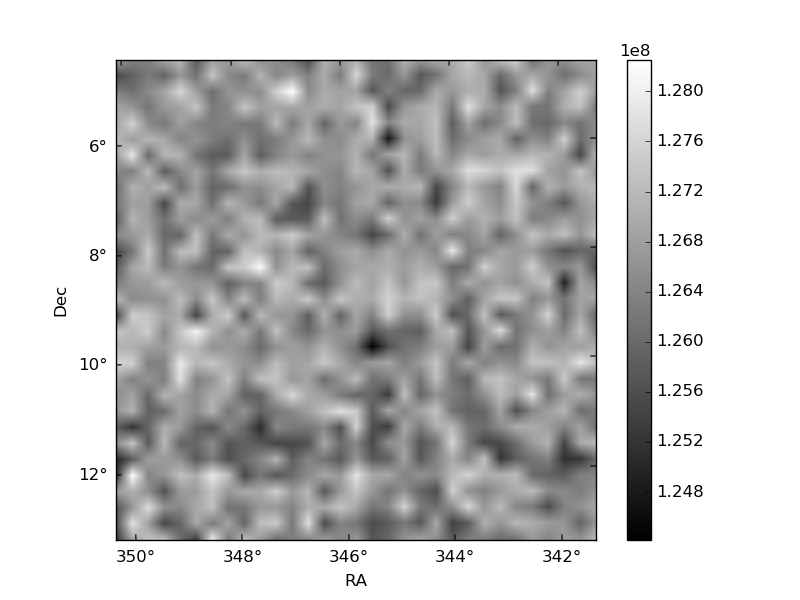 |
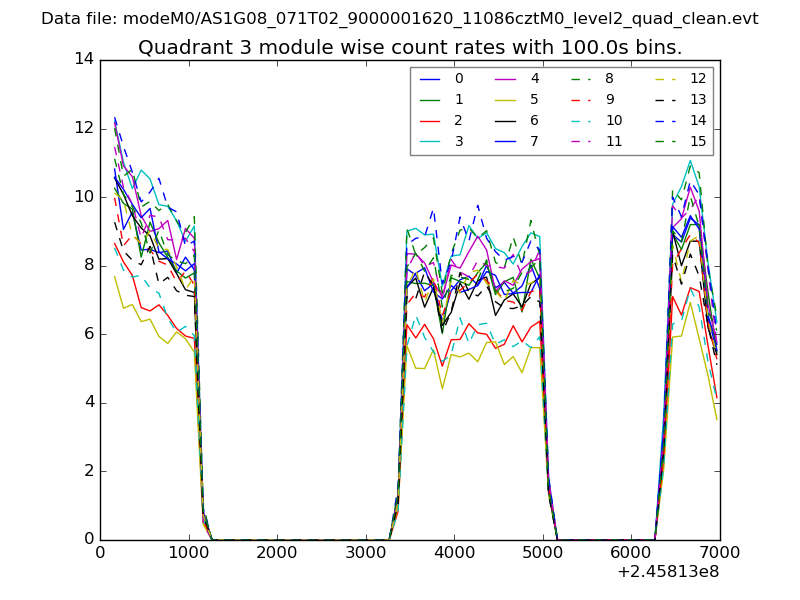
| Module-wise count rates for Quadrant D Data is divided into 100 sec bins |
 |
 |
| Parameter | Plot |
|---|---|
| CZT HV Monitor | 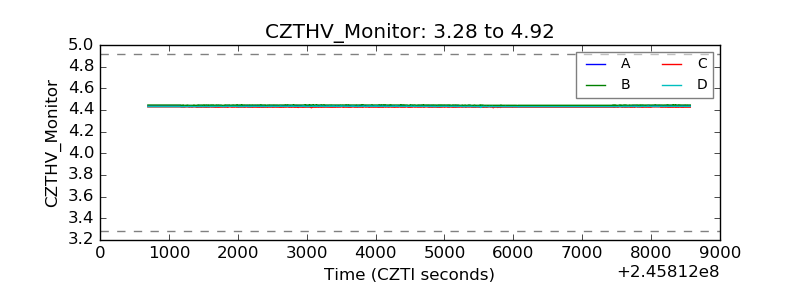 |
| D_VDD | 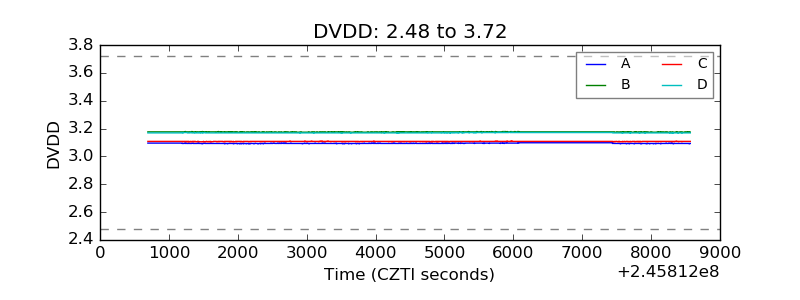 |
| Temperature 1 | 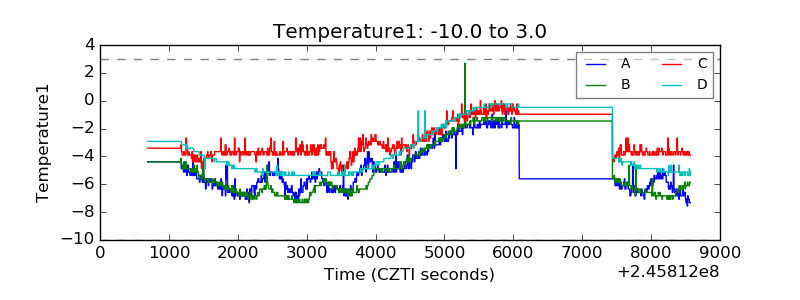 |
| Veto HV Monitor |  |
| Veto LLD | 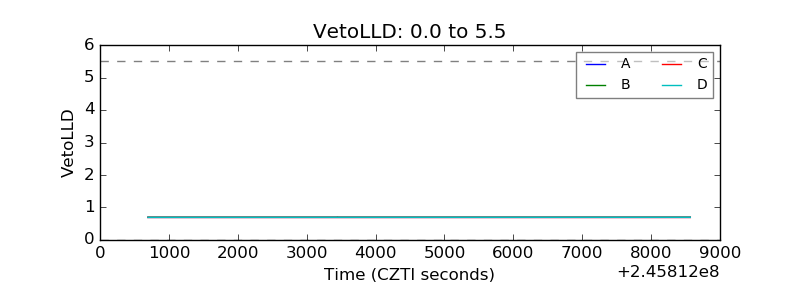 |
| Alpha Counter | 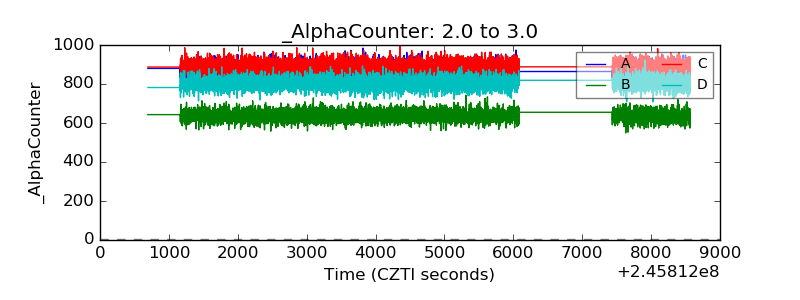 |
| _CPM_Rate | 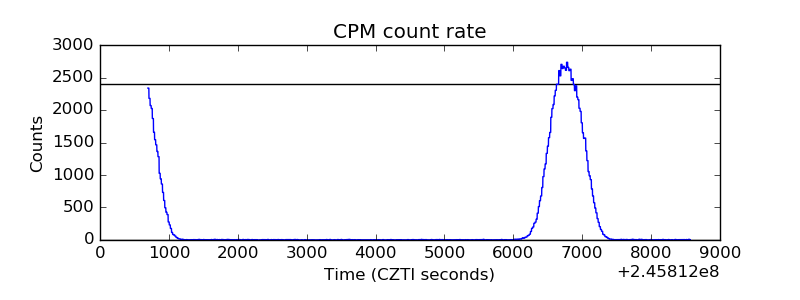 |
| CZT Counter | 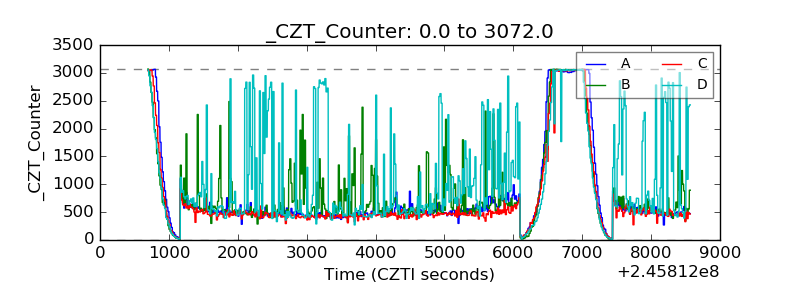 |
| +2.5 Volts monitor |  |
| +5 Volts monitor |  |
| _ROLL_ROT | 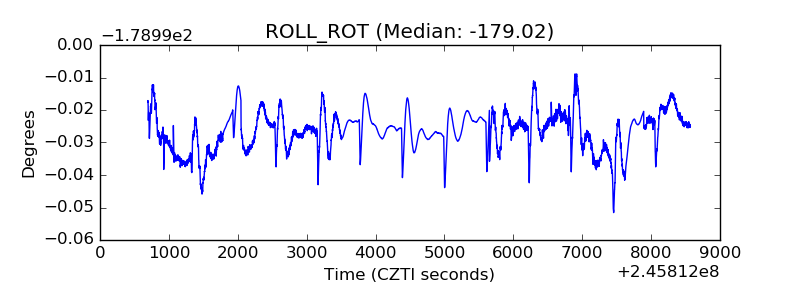 |
| _Roll_DEC | 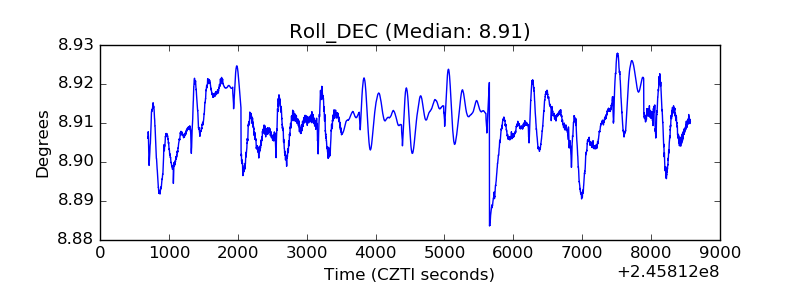 |
| _Roll_RA | 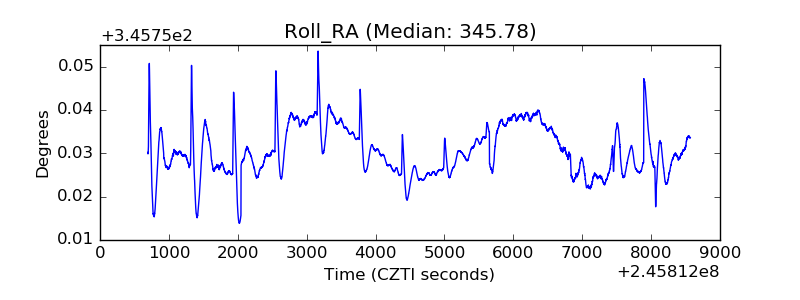 |
| Veto Counter | 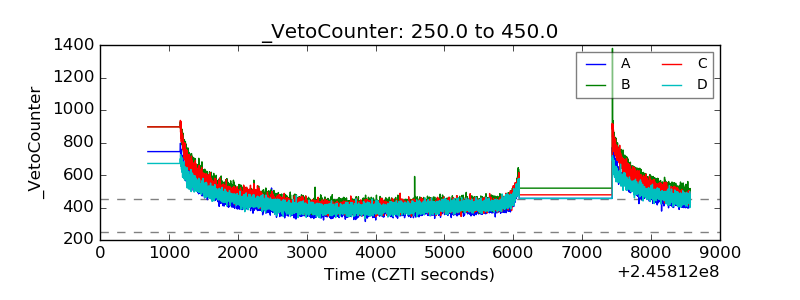 |