| Param | Original file | Final file |
|---|---|---|
| Filename | modeM0/AS1G08_071T02_9000001620_11087cztM0_level2.evt | modeM0/AS1G08_071T02_9000001620_11087cztM0_level2_quad_clean.evt |
| Size (bytes) | 559,612,800 | 66,430,080 |
| Size | 533.7 MB | 63.4 MB |
| Events in quadrant A | 3,189,638 | 405,476 |
| Events in quadrant B | 4,506,598 | 406,496 |
| Events in quadrant C | 3,036,075 | 401,447 |
| Events in quadrant D | 5,788,815 | 358,493 |
| Mode SS | |||
|---|---|---|---|
| Quadrant | BADHDUFLAG | Total packets | Discarded packets |
| A | 0 | 126 | 0 |
| B | 0 | 126 | 0 |
| C | 0 | 126 | 0 |
| D | 0 | 126 | 0 |
| Mode M9 | |||
|---|---|---|---|
| Quadrant | BADHDUFLAG | Total packets | Discarded packets |
| A | 0 | 15 | 0 |
| B | 0 | 15 | 0 |
| C | 0 | 15 | 0 |
| D | 0 | 16 | 0 |
| Mode M0 | |||
|---|---|---|---|
| Quadrant | BADHDUFLAG | Total packets | Discarded packets |
| A | 0 | 13187 | 3 |
| B | 0 | 17421 | 2 |
| C | 0 | 12927 | 2 |
| D | 0 | 21375 | 2 |
| Quadrant | Total seconds | Saturated seconds | Saturation percentage |
|---|---|---|---|
| A | 6302 | 23 | 0.364964% |
| B | 6302 | 292 | 4.633450% |
| C | 6302 | 9 | 0.142812% |
| D | 6302 | 966 | 15.328467% |
Noise dominated data is calculated using 1-second bins in cleaned event files. If a bin has >2000 counts, and if more than 50% of those come from <1% of pixels, then it is considered to be noise-dominated and hence unusable.
| Quadrant | # 1 sec bins | Bins with >0 counts | Bins with >2000 counts | High rate bins dominated by noise | Noise dominated (total time) | Noise dominated (detector-on time) | Marked lightcurve |
|---|---|---|---|---|---|---|---|
| A | 7657 | 6303 | 0 | 0 | 0.00% | 0.00% | 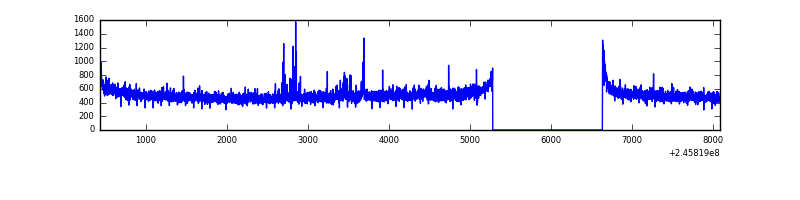 |
| B | 7657 | 6303 | 174 | 174 | 2.27% | 2.76% | 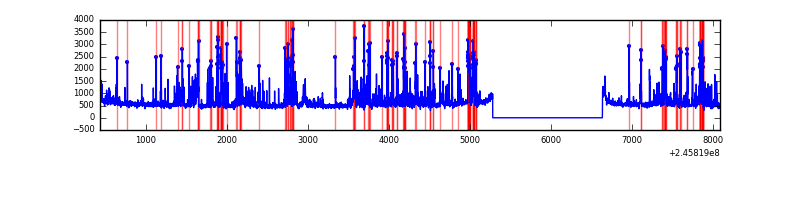 |
| C | 7657 | 6303 | 0 | 0 | 0.00% | 0.00% | 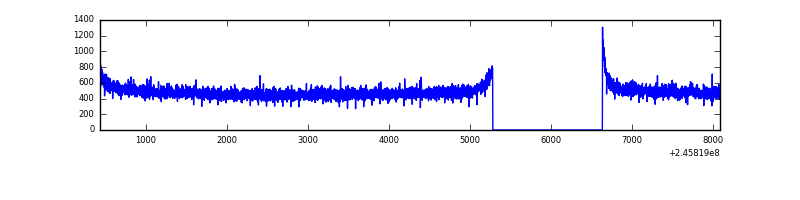 |
| D | 7657 | 6303 | 894 | 894 | 11.68% | 14.18% | 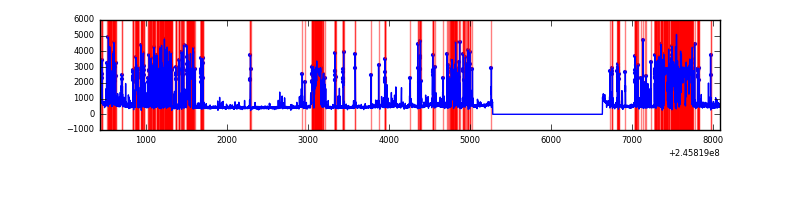 |
Top three noisy pixels from each quadrant. If the there are fewer than three noisy pixels in the level2.evt file, extra rows are filled as -1
| Pixel properties | Quadrant properties | ||||||
|---|---|---|---|---|---|---|---|
| Quadrant | DetID | PixID | Counts | Sigma | Mean | Median | Sigma |
| A | 8 | 15 | 41189 | 249.2 | 806 | 791 | 162.1 |
| A | 14 | 238 | 36243 | 218.69 | 806 | 791 | 162.1 |
| A | 11 | 29 | 11087 | 63.51 | 806 | 791 | 162.1 |
| B | 4 | 239 | 1135003 | 7504.54 | 805 | 788 | 151.1 |
| B | 0 | 214 | 78350 | 513.19 | 805 | 788 | 151.1 |
| B | 15 | 204 | 51171 | 333.36 | 805 | 788 | 151.1 |
| C | 13 | 61 | 5738 | 27.49 | 777 | 783 | 180.3 |
| C | 9 | 54 | 3381 | 14.41 | 777 | 783 | 180.3 |
| C | 12 | 4 | 2408 | 9.01 | 777 | 783 | 180.3 |
| D | 10 | 253 | 2679190 | 15801.05 | 700 | 682 | 169.5 |
| D | 4 | 95 | 177659 | 1044.02 | 700 | 682 | 169.5 |
| D | 1 | 52 | 102543 | 600.9 | 700 | 682 | 169.5 |
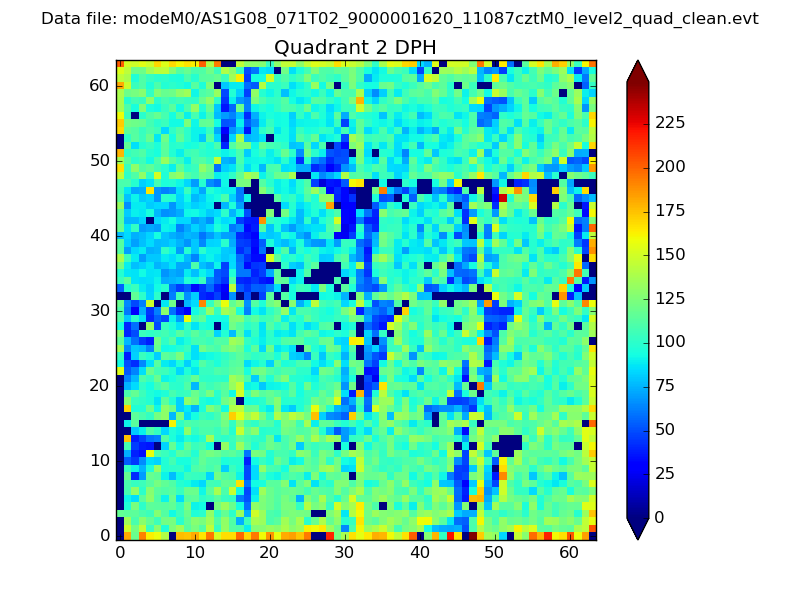
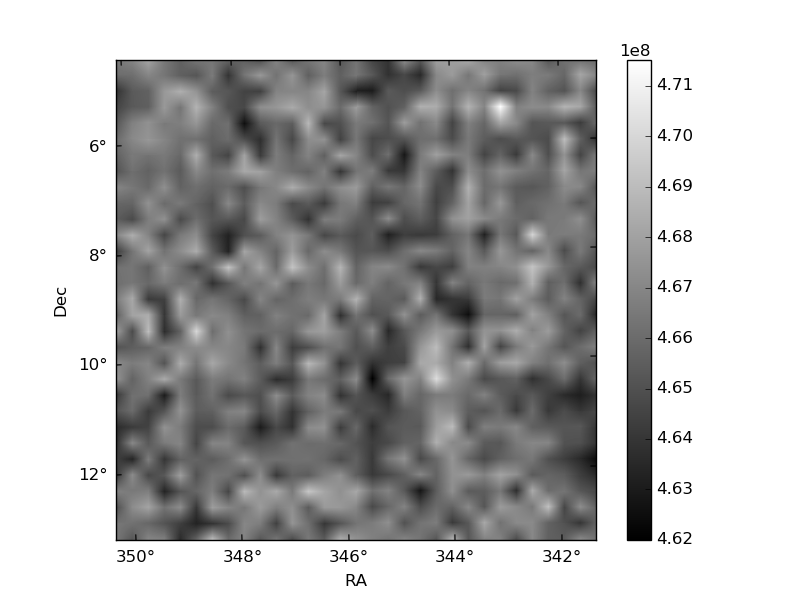
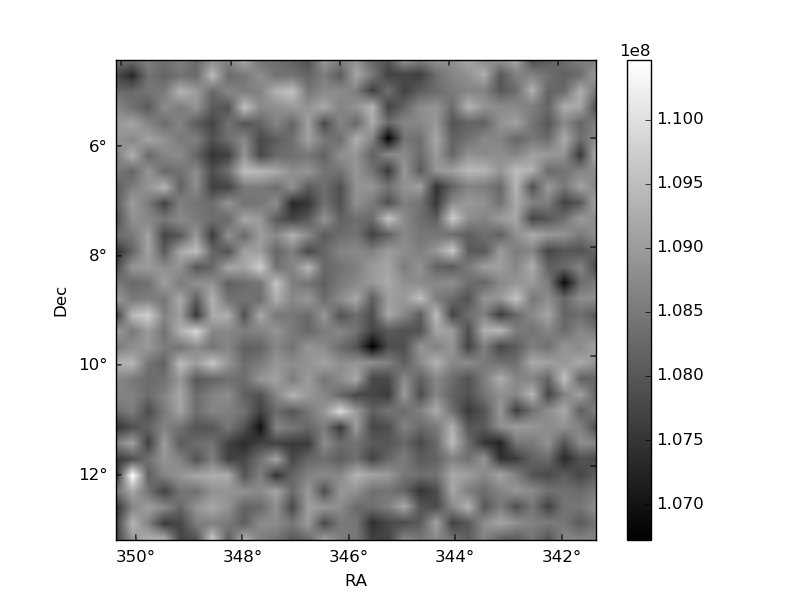
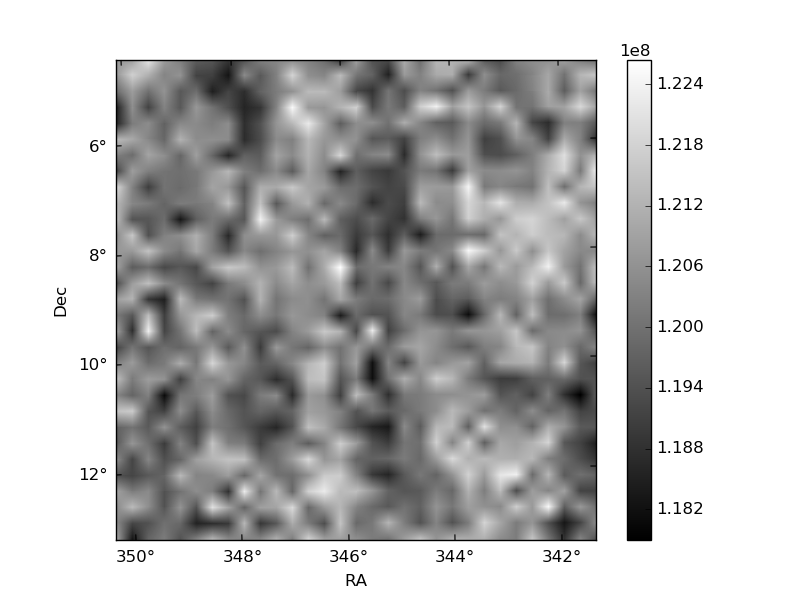
Histogram calculated using DETX and DETY for each event in the final _common_clean file
| Quadrant A | 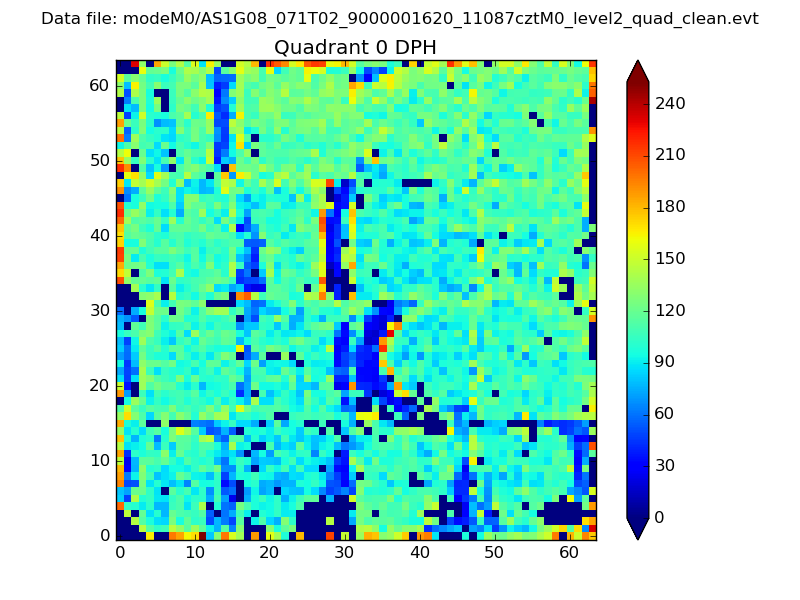 |
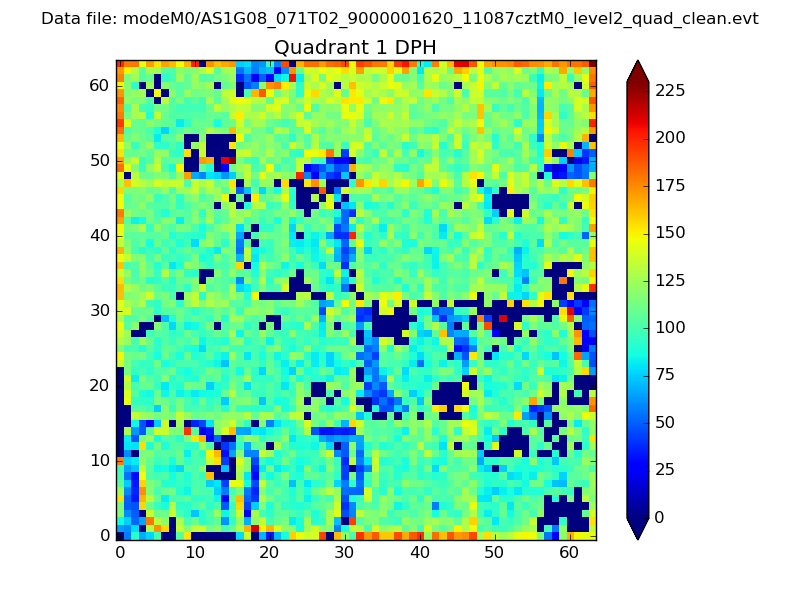 |
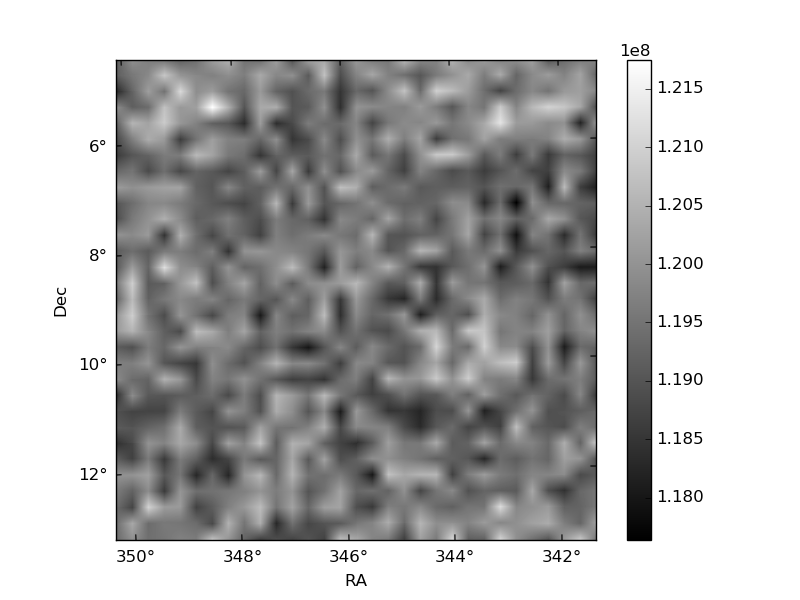
Quadrant B |
|---|---|---|---|
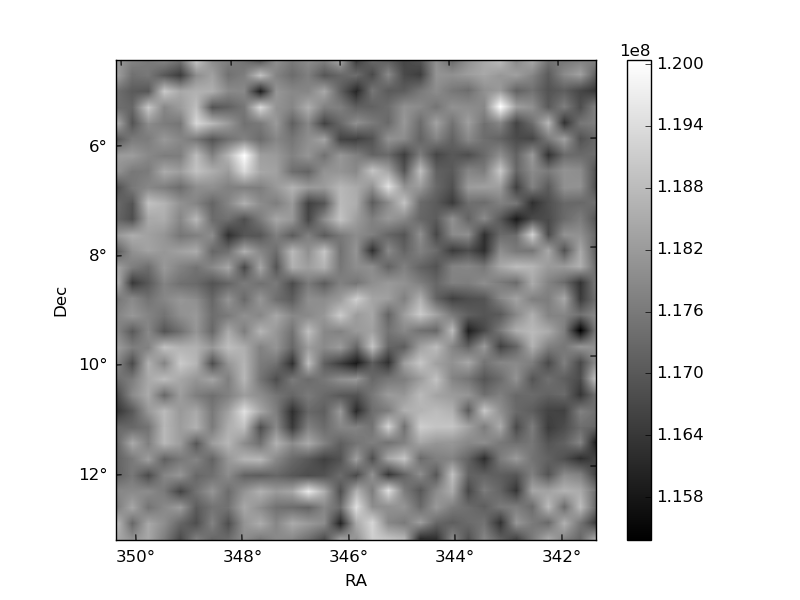
| Quadrant D | 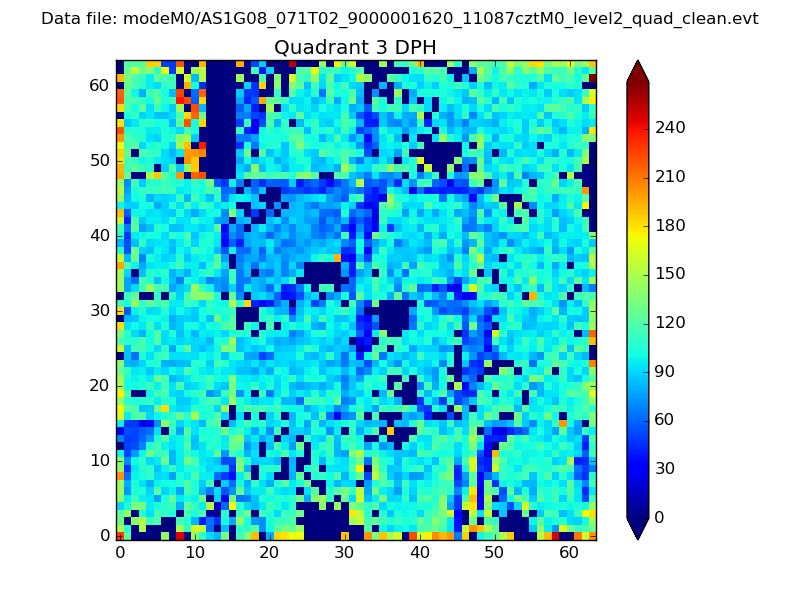 |
 |
Quadrant C |
| Plot type | Count rate plots | Images |
|---|---|---|
| Comparison with Poisson distribution Blue bars denote a histogram of data divided into 1 sec bins. Red curve is a Poisson curve with rate = median count rate of data. |
 |
 |
| Quadrant-wise count rates Data is divided into 100 sec bins |
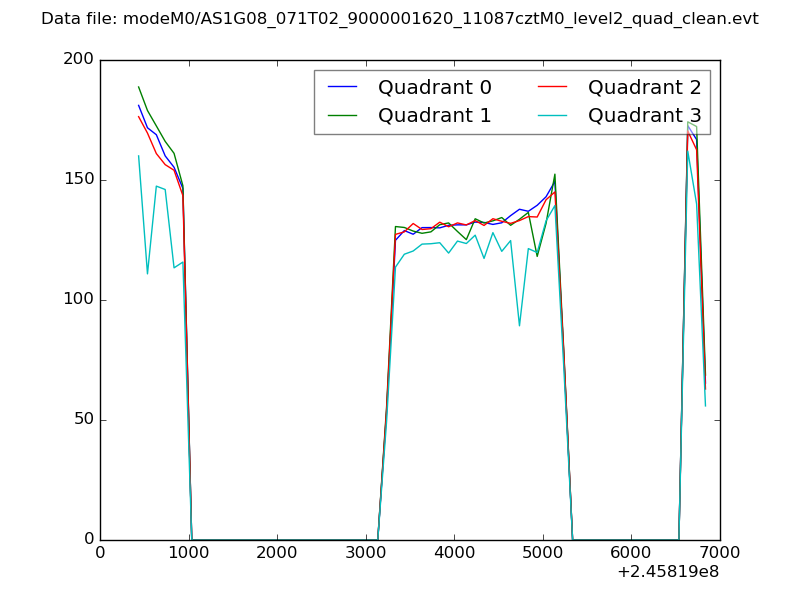 |
|
| Module-wise count rates for Quadrant A Data is divided into 100 sec bins |
 |
 |
| Module-wise count rates for Quadrant B Data is divided into 100 sec bins |
 |
 |
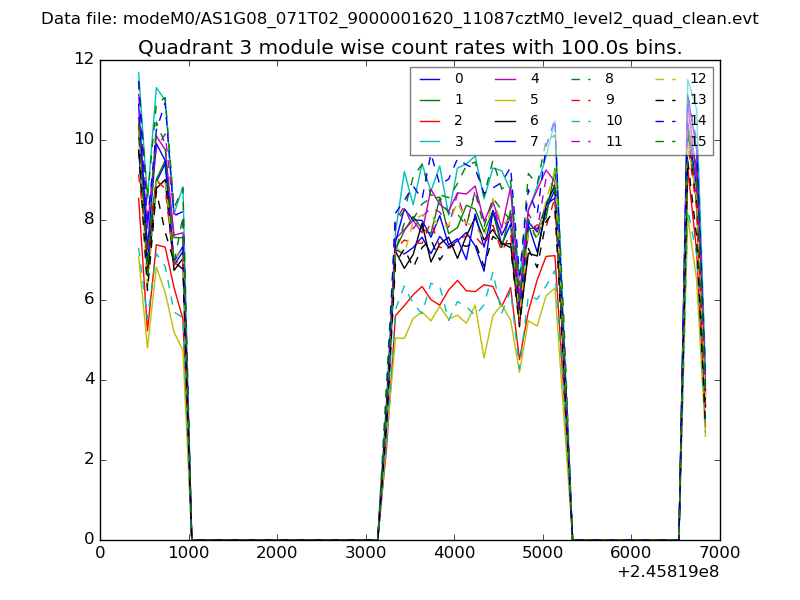
| Module-wise count rates for Quadrant C Data is divided into 100 sec bins |
 |
 |
| Module-wise count rates for Quadrant D Data is divided into 100 sec bins |
 |
 |
| Parameter | Plot |
|---|---|
| CZT HV Monitor | 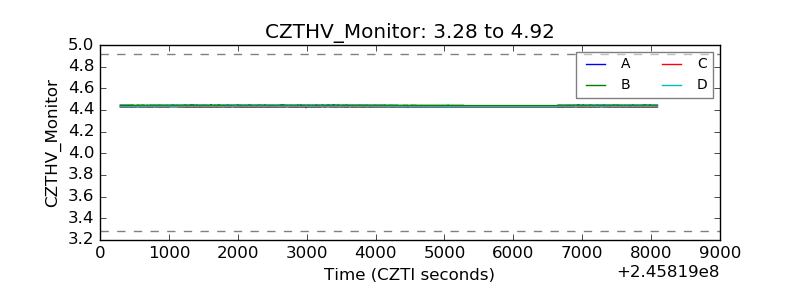 |
| D_VDD | 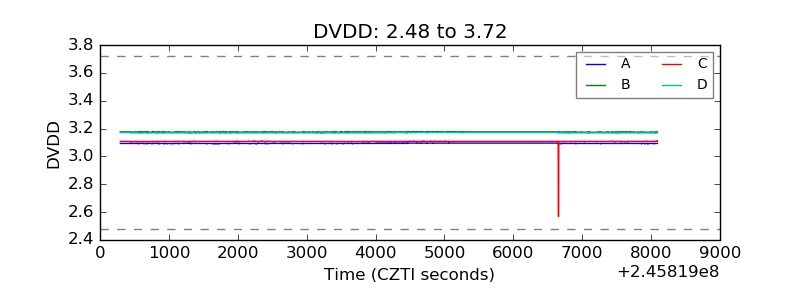 |
| Temperature 1 | 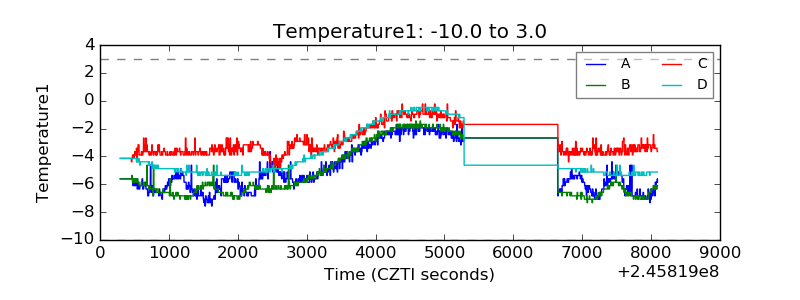 |
| Veto HV Monitor | 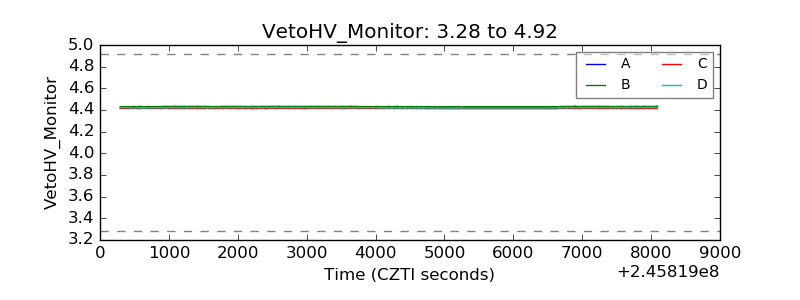 |
| Veto LLD | 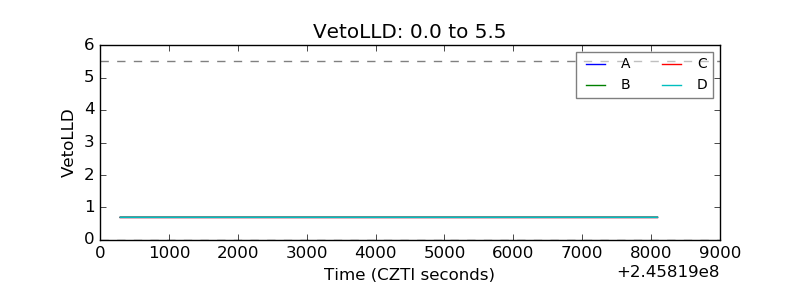 |
| Alpha Counter | 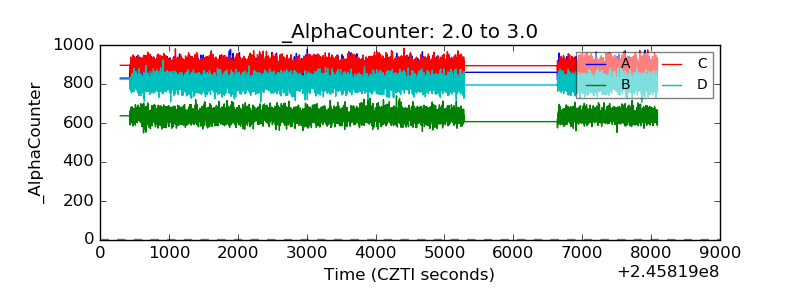 |
| _CPM_Rate | 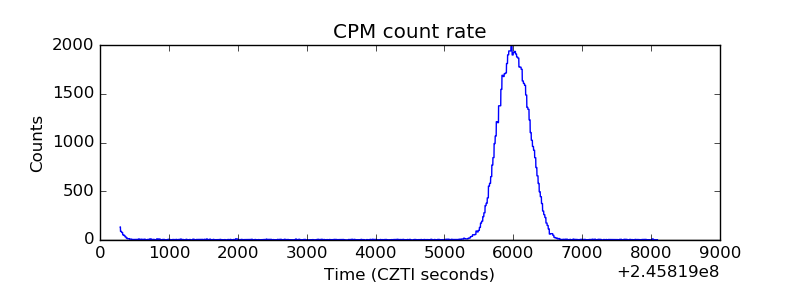 |
| CZT Counter | 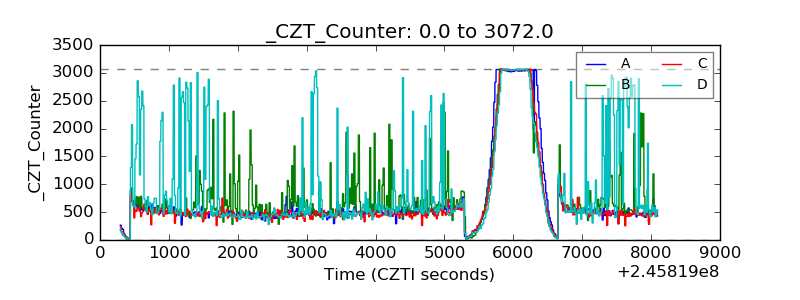 |
| +2.5 Volts monitor |  |
| +5 Volts monitor |  |
| _ROLL_ROT | 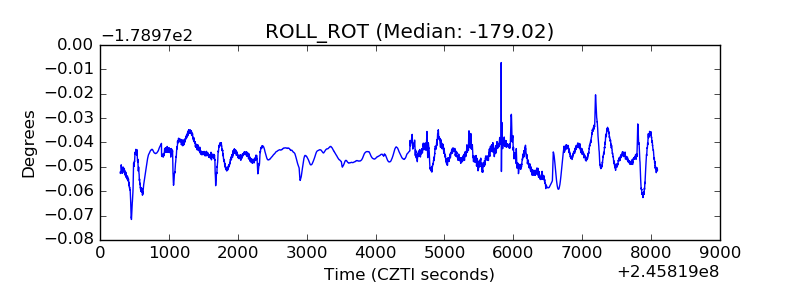 |
| _Roll_DEC | 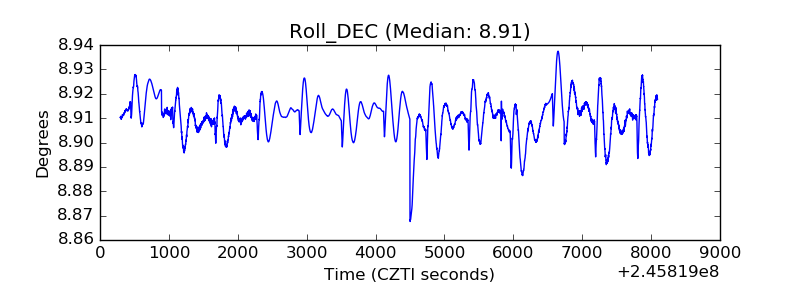 |
| _Roll_RA | 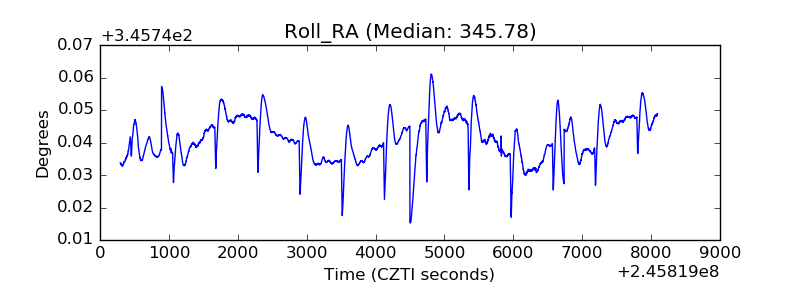 |
| Veto Counter |  |