| Param | Original file | Final file |
|---|---|---|
| Filename | modeM0/AS1G08_071T02_9000001620_11089cztM0_level2.evt | modeM0/AS1G08_071T02_9000001620_11089cztM0_level2_quad_clean.evt |
| Size (bytes) | 539,403,840 | 67,582,080 |
| Size | 514.4 MB | 64.5 MB |
| Events in quadrant A | 3,231,657 | 404,580 |
| Events in quadrant B | 4,979,064 | 397,779 |
| Events in quadrant C | 3,105,623 | 403,357 |
| Events in quadrant D | 4,574,950 | 383,512 |
| Mode SS | |||
|---|---|---|---|
| Quadrant | BADHDUFLAG | Total packets | Discarded packets |
| A | 0 | 132 | 0 |
| B | 0 | 132 | 0 |
| C | 0 | 132 | 0 |
| D | 0 | 132 | 0 |
| Mode M9 | |||
|---|---|---|---|
| Quadrant | BADHDUFLAG | Total packets | Discarded packets |
| A | 0 | 15 | 0 |
| B | 0 | 15 | 0 |
| C | 0 | 15 | 0 |
| D | 0 | 16 | 0 |
| Mode M0 | |||
|---|---|---|---|
| Quadrant | BADHDUFLAG | Total packets | Discarded packets |
| A | 0 | 13665 | 4 |
| B | 0 | 19043 | 3 |
| C | 0 | 13562 | 3 |
| D | 0 | 17901 | 3 |
| Quadrant | Total seconds | Saturated seconds | Saturation percentage |
|---|---|---|---|
| A | 6556 | 83 | 1.266016% |
| B | 6556 | 498 | 7.596095% |
| C | 6556 | 61 | 0.930445% |
| D | 6556 | 504 | 7.687614% |
Noise dominated data is calculated using 1-second bins in cleaned event files. If a bin has >2000 counts, and if more than 50% of those come from <1% of pixels, then it is considered to be noise-dominated and hence unusable.
| Quadrant | # 1 sec bins | Bins with >0 counts | Bins with >2000 counts | High rate bins dominated by noise | Noise dominated (total time) | Noise dominated (detector-on time) | Marked lightcurve |
|---|---|---|---|---|---|---|---|
| A | 7571 | 6557 | 0 | 0 | 0.00% | 0.00% | 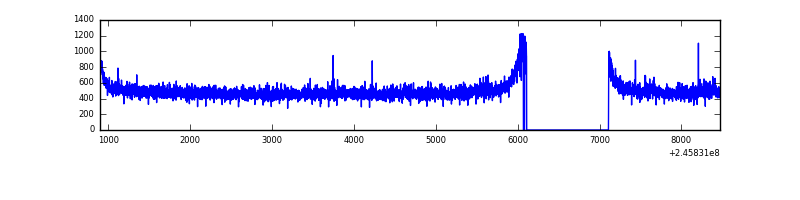 |
| B | 7571 | 6558 | 243 | 243 | 3.21% | 3.71% | 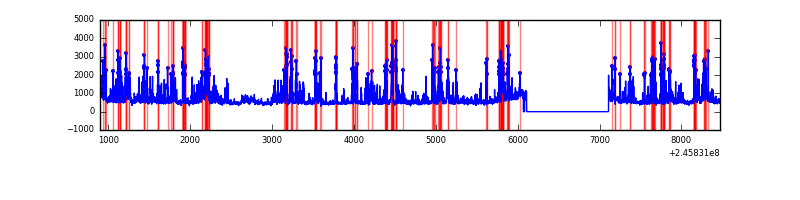 |
| C | 7571 | 6558 | 0 | 0 | 0.00% | 0.00% |  |
| D | 7571 | 6557 | 413 | 413 | 5.46% | 6.30% | 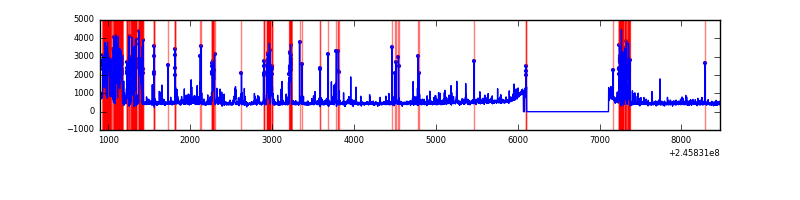 |
Top three noisy pixels from each quadrant. If the there are fewer than three noisy pixels in the level2.evt file, extra rows are filled as -1
| Pixel properties | Quadrant properties | ||||||
|---|---|---|---|---|---|---|---|
| Quadrant | DetID | PixID | Counts | Sigma | Mean | Median | Sigma |
| A | 8 | 15 | 48901 | 286.35 | 820 | 803 | 168.0 |
| A | 15 | 174 | 12369 | 68.86 | 820 | 803 | 168.0 |
| A | 11 | 29 | 9120 | 49.51 | 820 | 803 | 168.0 |
| B | 4 | 239 | 1579764 | 10222.45 | 809 | 789 | 154.5 |
| B | 10 | 16 | 145173 | 934.76 | 809 | 789 | 154.5 |
| B | 15 | 204 | 44011 | 279.82 | 809 | 789 | 154.5 |
| C | 13 | 61 | 5890 | 27.5 | 795 | 800 | 185.1 |
| C | 12 | 4 | 3328 | 13.66 | 795 | 800 | 185.1 |
| C | 8 | 222 | 2058 | 6.8 | 795 | 800 | 185.1 |
| D | 10 | 253 | 1047223 | 5683.06 | 759 | 739 | 184.1 |
| D | 1 | 52 | 218254 | 1181.24 | 759 | 739 | 184.1 |
| D | 4 | 95 | 150038 | 810.79 | 759 | 739 | 184.1 |
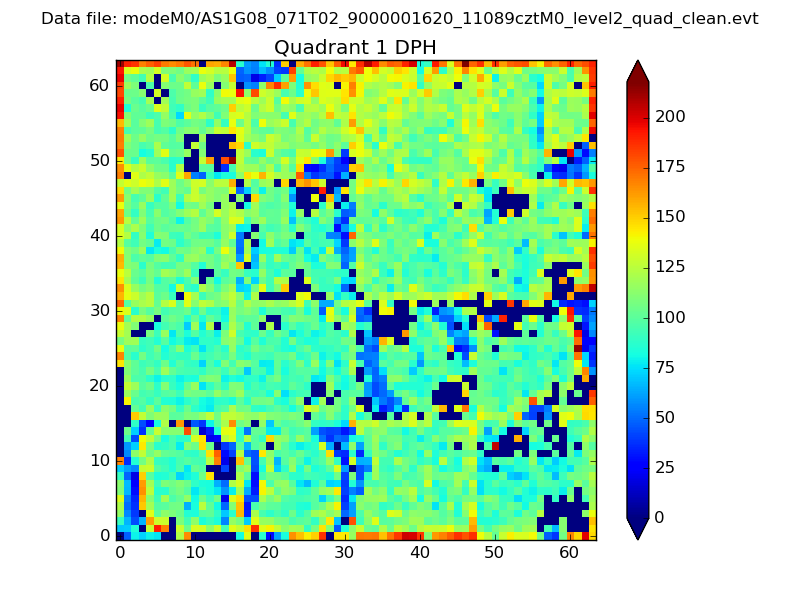
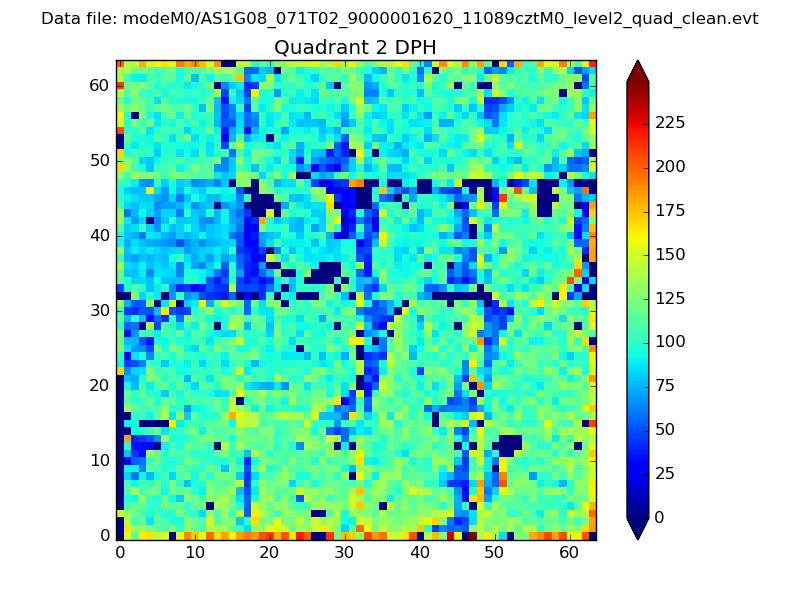
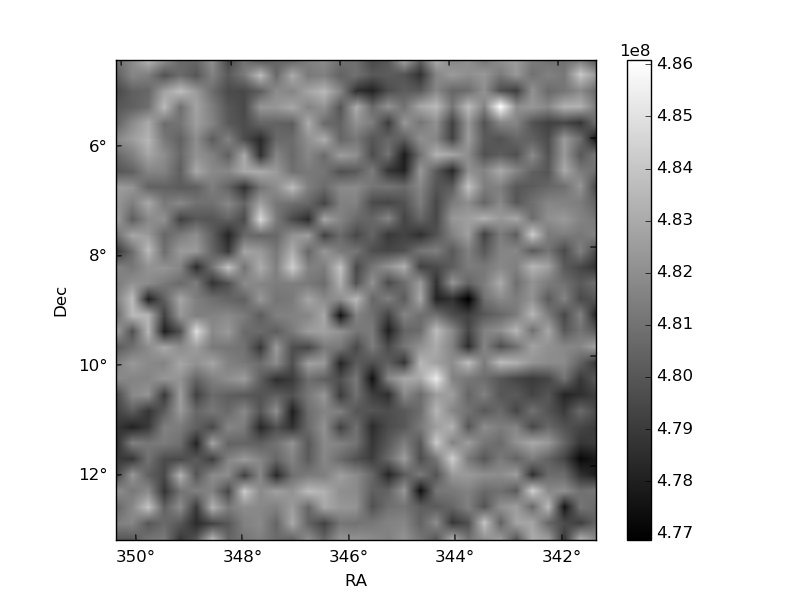
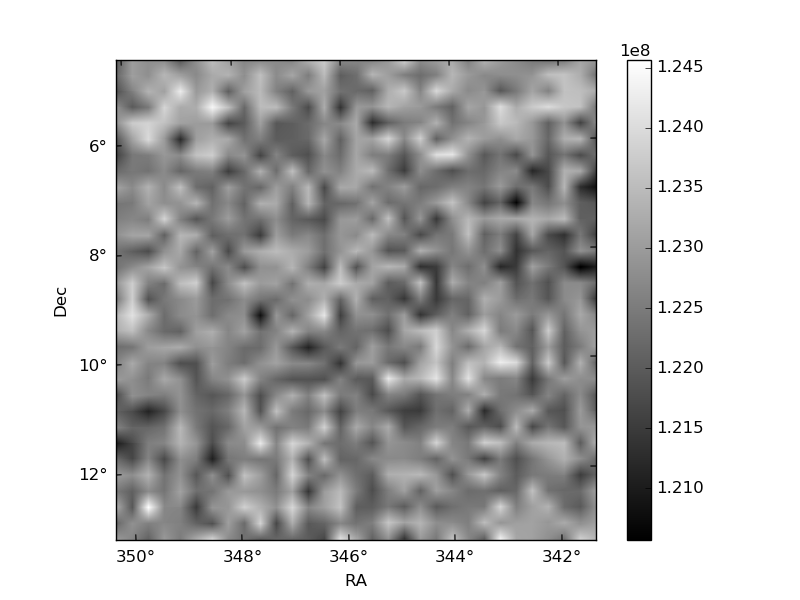
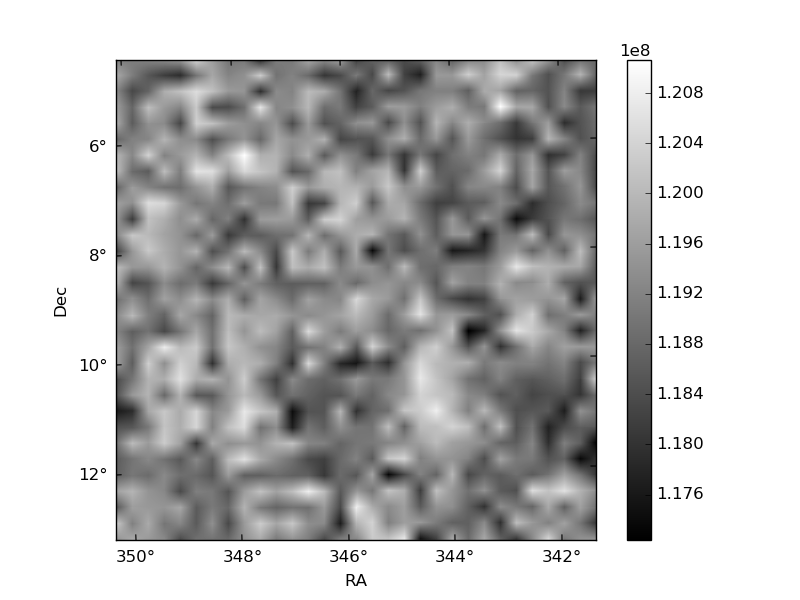
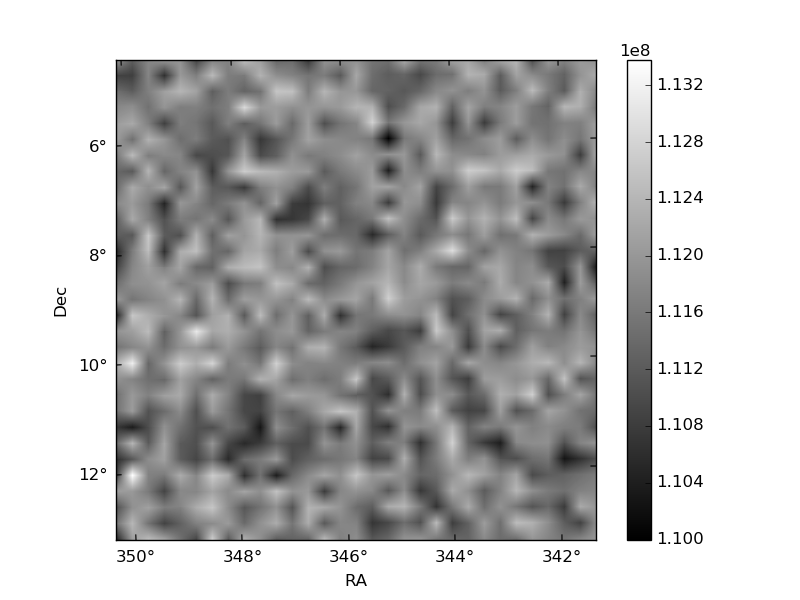
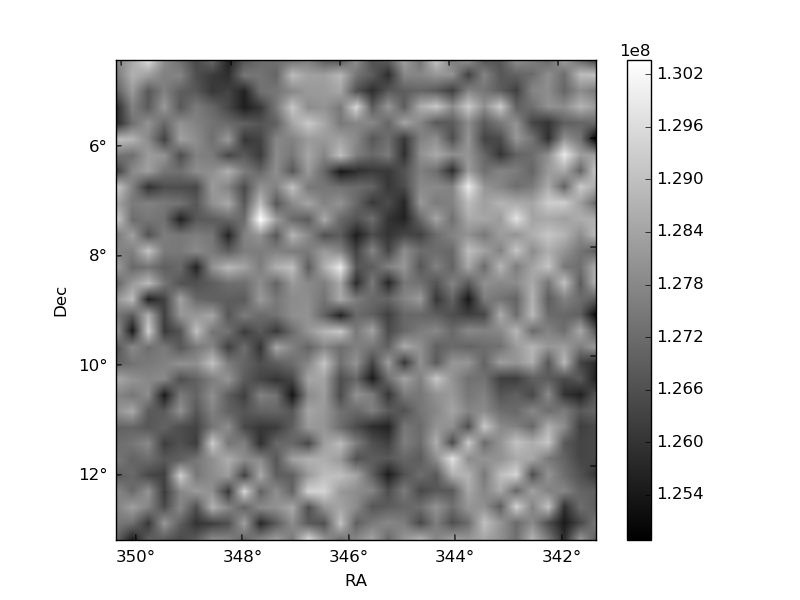
Histogram calculated using DETX and DETY for each event in the final _common_clean file
| Quadrant A | 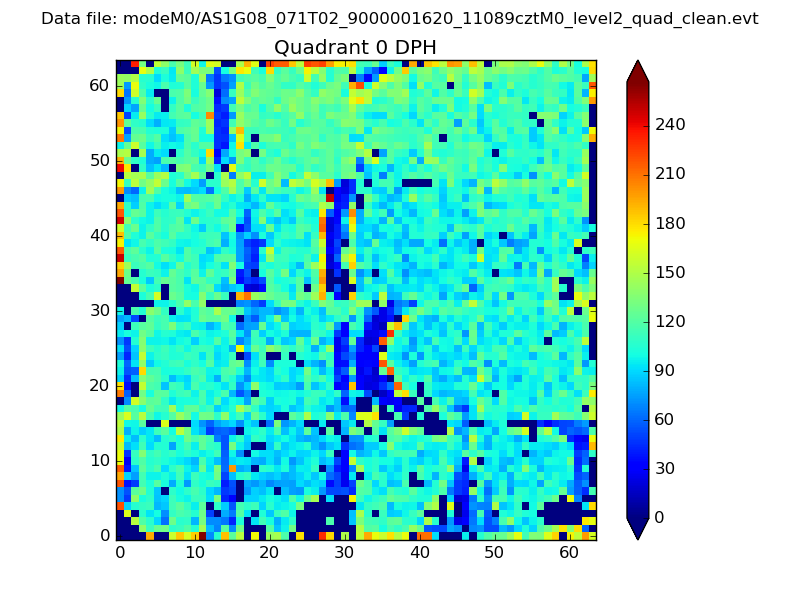 |
 |
Quadrant B |
|---|---|---|---|
| Quadrant D | 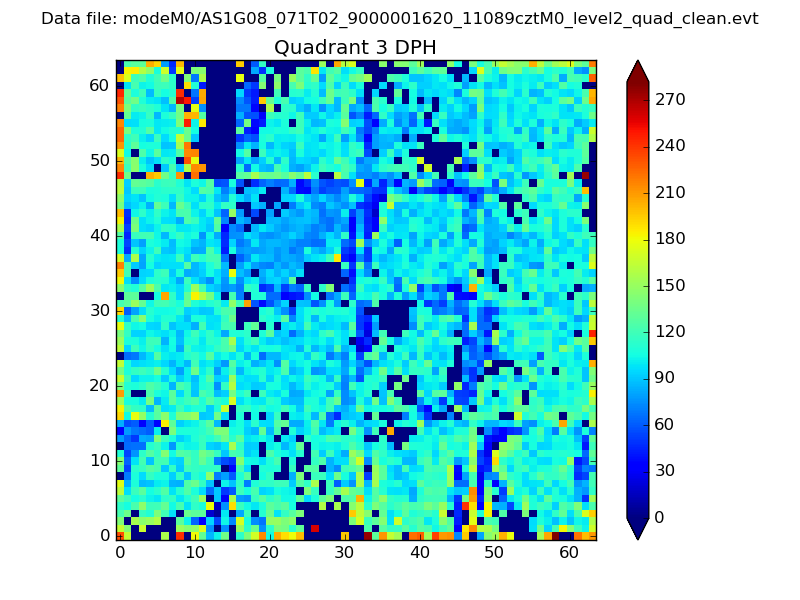 |
 |
Quadrant C |
| Plot type | Count rate plots | Images |
|---|---|---|
| Comparison with Poisson distribution Blue bars denote a histogram of data divided into 1 sec bins. Red curve is a Poisson curve with rate = median count rate of data. |
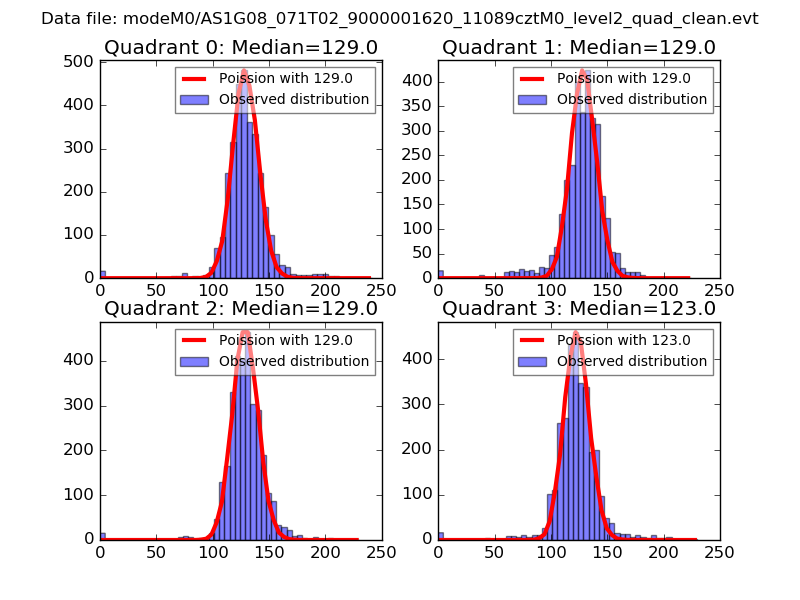 |
 |
| Quadrant-wise count rates Data is divided into 100 sec bins |
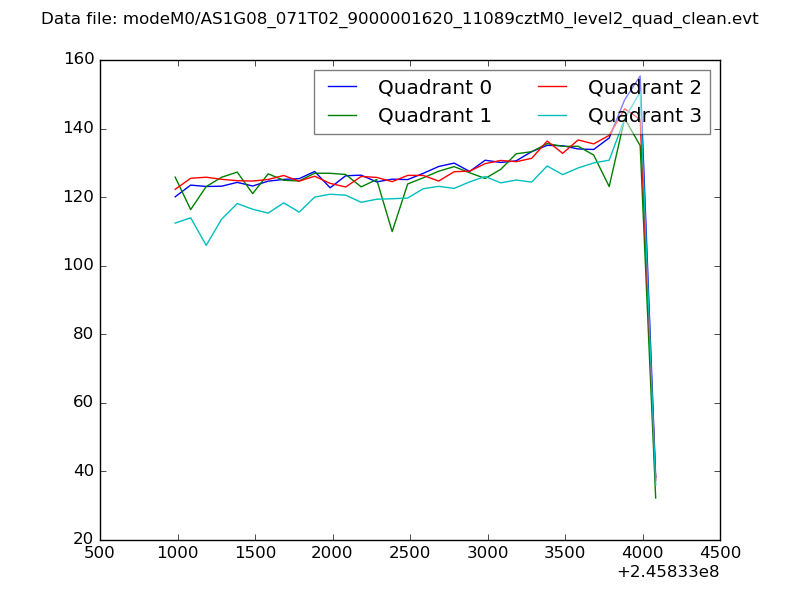 |
|
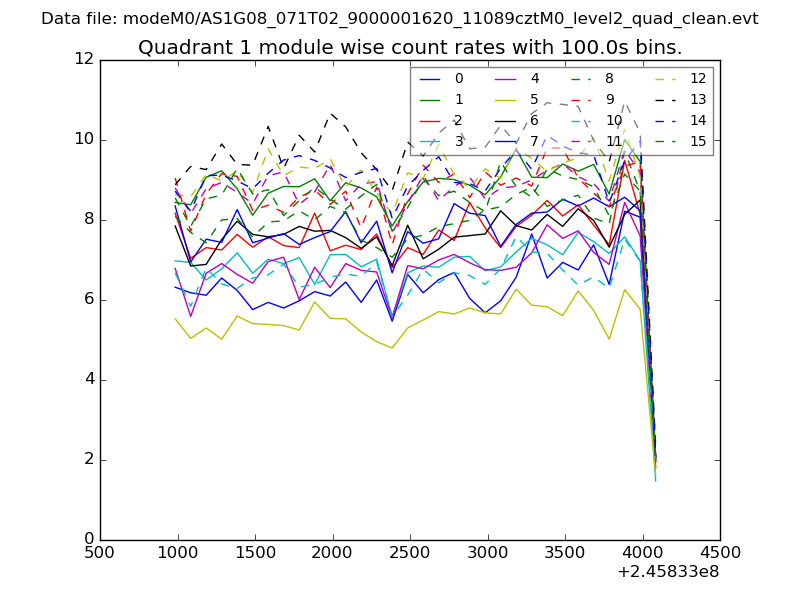
| Module-wise count rates for Quadrant A Data is divided into 100 sec bins |
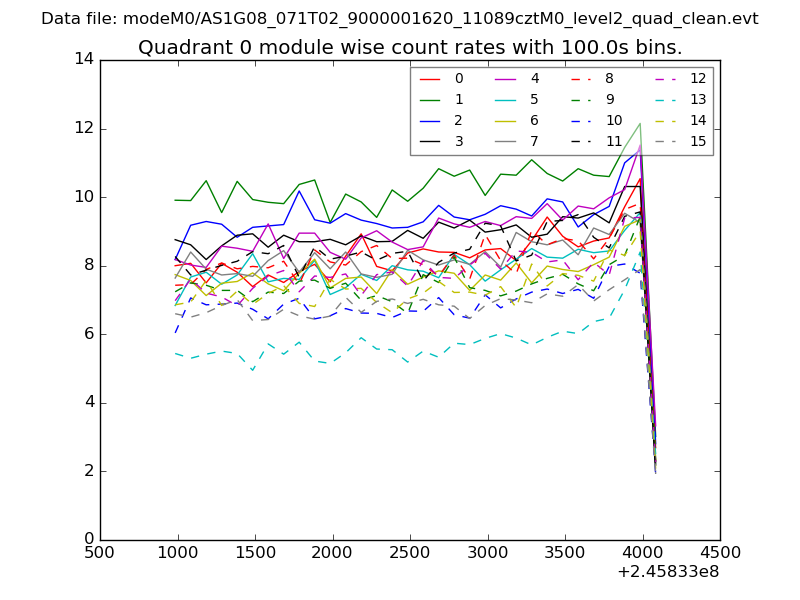 |
 |
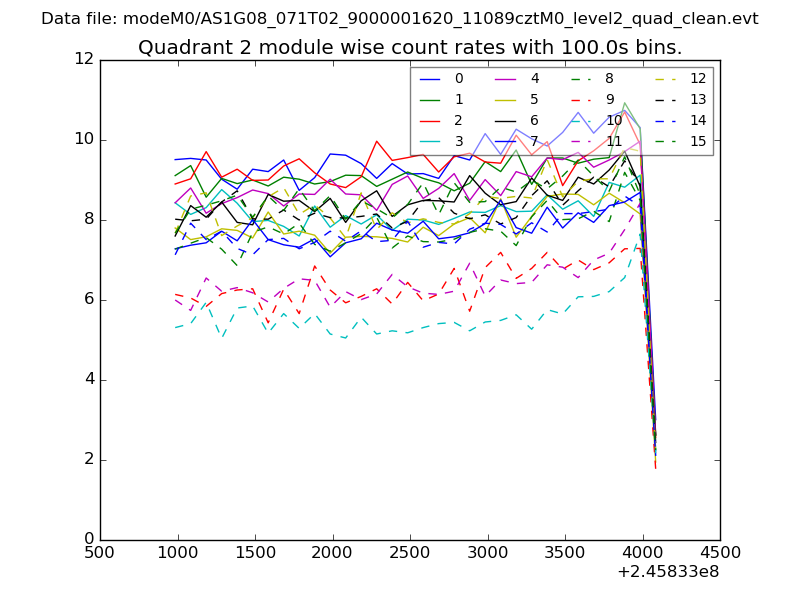
| Module-wise count rates for Quadrant B Data is divided into 100 sec bins |
 |
 |
| Module-wise count rates for Quadrant C Data is divided into 100 sec bins |
 |
 |
| Module-wise count rates for Quadrant D Data is divided into 100 sec bins |
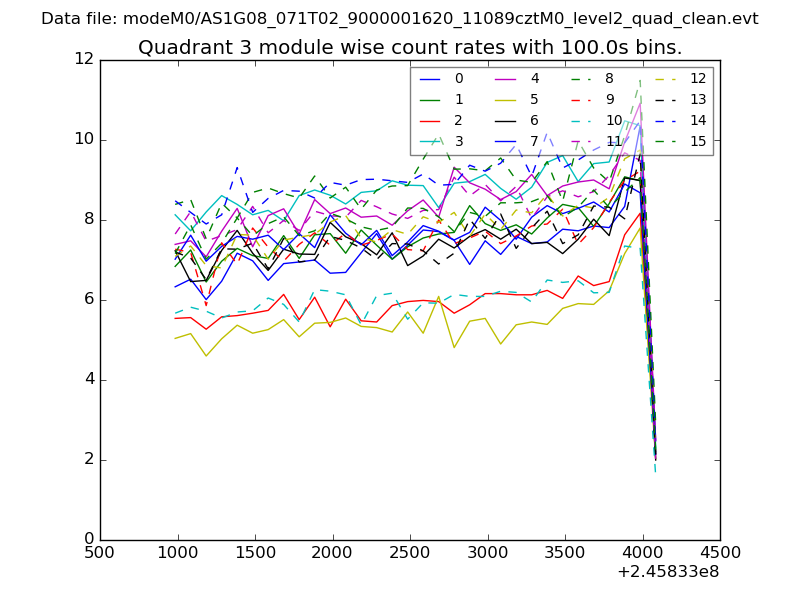 |
 |
| Parameter | Plot |
|---|---|
| CZT HV Monitor | 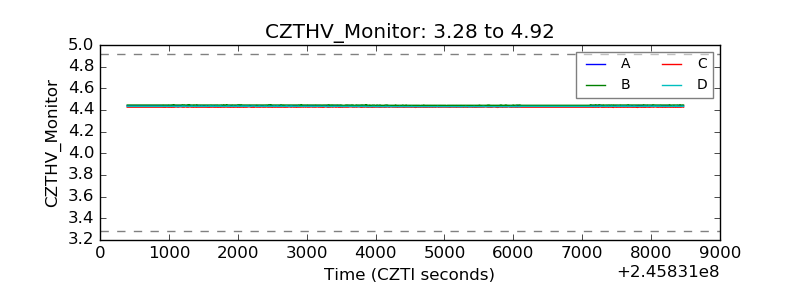 |
| D_VDD | 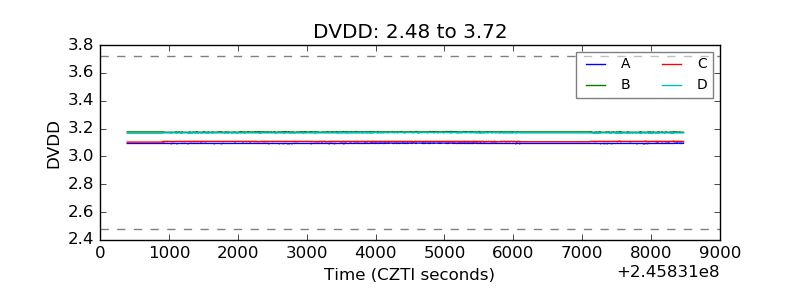 |
| Temperature 1 | 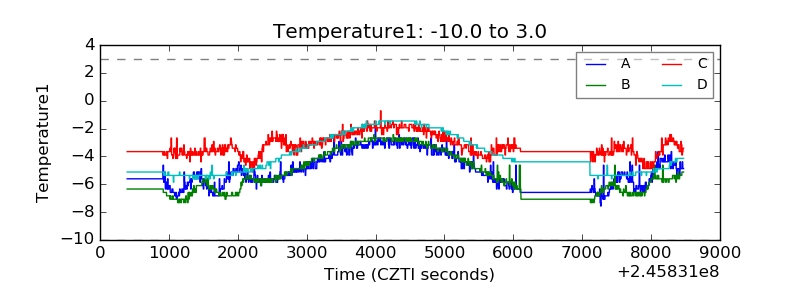 |
| Veto HV Monitor | 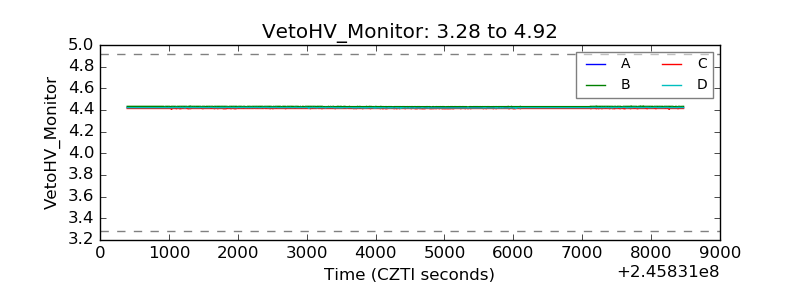 |
| Veto LLD | 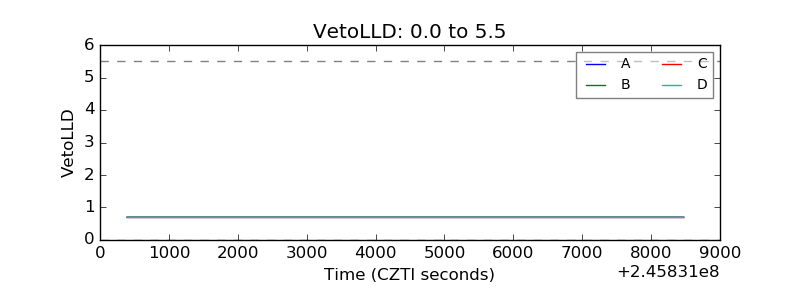 |
| Alpha Counter | 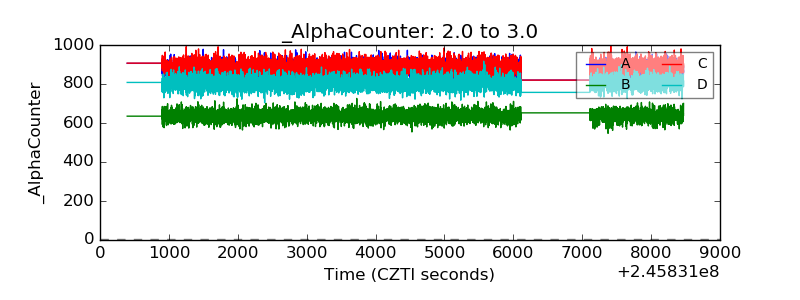 |
| _CPM_Rate | 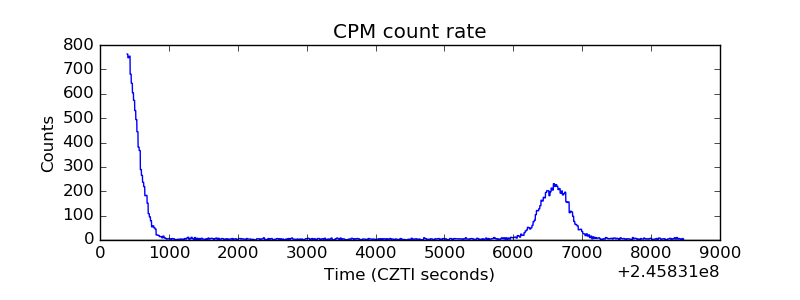 |
| CZT Counter | 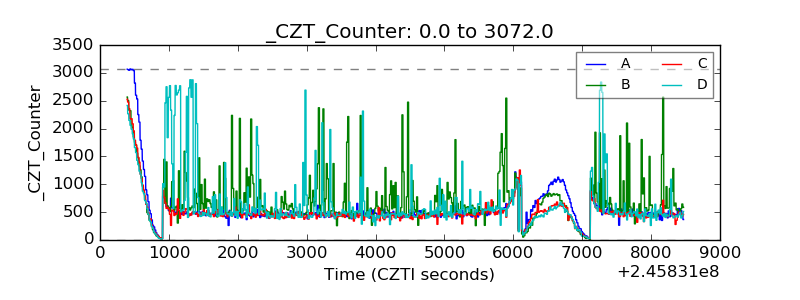 |
| +2.5 Volts monitor |  |
| +5 Volts monitor |  |
| _ROLL_ROT |  |
| _Roll_DEC | 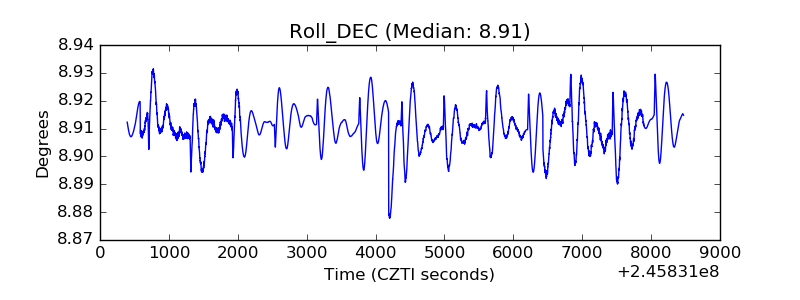 |
| _Roll_RA | 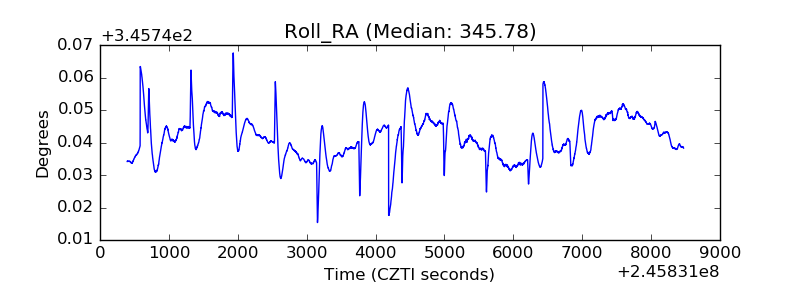 |
| Veto Counter | 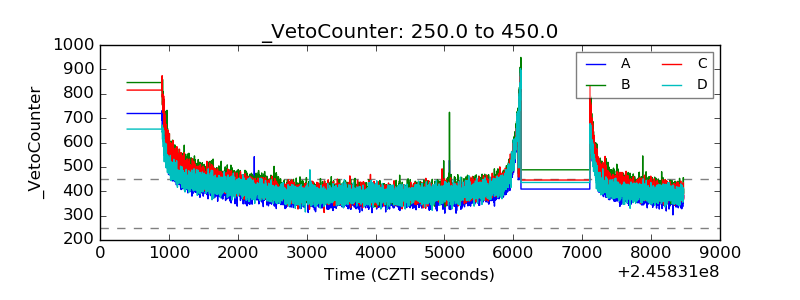 |