| Param | Original file | Final file |
|---|---|---|
| Filename | modeM0/AS1G08_071T02_9000001620_11090cztM0_level2.evt | modeM0/AS1G08_071T02_9000001620_11090cztM0_level2_quad_clean.evt |
| Size (bytes) | 649,091,520 | 85,256,640 |
| Size | 619.0 MB | 81.3 MB |
| Events in quadrant A | 3,836,512 | 527,331 |
| Events in quadrant B | 5,350,894 | 520,894 |
| Events in quadrant C | 3,661,757 | 525,296 |
| Events in quadrant D | 6,291,199 | 476,533 |
| Mode SS | |||
|---|---|---|---|
| Quadrant | BADHDUFLAG | Total packets | Discarded packets |
| A | 0 | 158 | 0 |
| B | 0 | 158 | 0 |
| C | 0 | 158 | 0 |
| D | 0 | 158 | 0 |
| Mode M9 | |||
|---|---|---|---|
| Quadrant | BADHDUFLAG | Total packets | Discarded packets |
| A | 0 | 15 | 0 |
| B | 0 | 15 | 0 |
| C | 0 | 15 | 0 |
| D | 0 | 15 | 0 |
| Mode M0 | |||
|---|---|---|---|
| Quadrant | BADHDUFLAG | Total packets | Discarded packets |
| A | 0 | 16256 | 0 |
| B | 0 | 20843 | 0 |
| C | 0 | 16097 | 0 |
| D | 0 | 23935 | 0 |
| Quadrant | Total seconds | Saturated seconds | Saturation percentage |
|---|---|---|---|
| A | 7633 | 268 | 3.511070% |
| B | 7633 | 617 | 8.083322% |
| C | 7633 | 190 | 2.489192% |
| D | 7633 | 767 | 10.048474% |
Noise dominated data is calculated using 1-second bins in cleaned event files. If a bin has >2000 counts, and if more than 50% of those come from <1% of pixels, then it is considered to be noise-dominated and hence unusable.
| Quadrant | # 1 sec bins | Bins with >0 counts | Bins with >2000 counts | High rate bins dominated by noise | Noise dominated (total time) | Noise dominated (detector-on time) | Marked lightcurve |
|---|---|---|---|---|---|---|---|
| A | 9178 | 7634 | 0 | 0 | 0.00% | 0.00% | 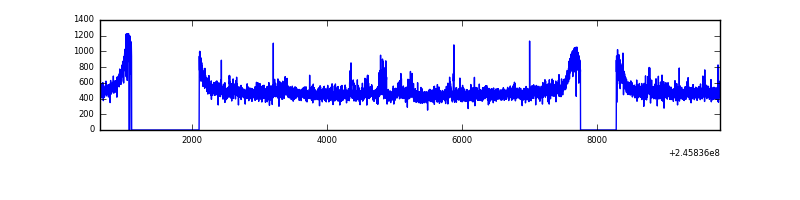 |
| B | 9178 | 7635 | 186 | 186 | 2.03% | 2.44% | 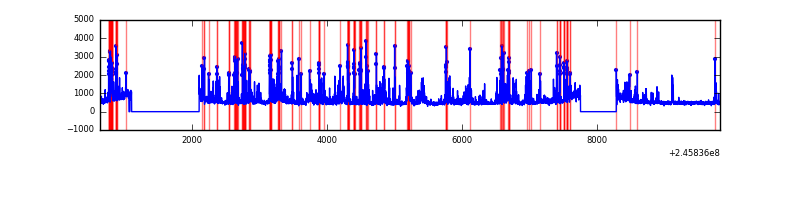 |
| C | 9178 | 7636 | 1 | 1 | 0.01% | 0.01% | 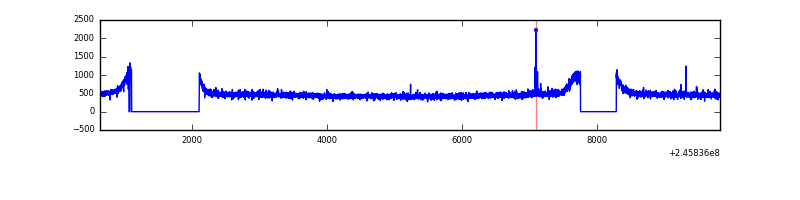 |
| D | 9178 | 7635 | 486 | 486 | 5.30% | 6.37% | 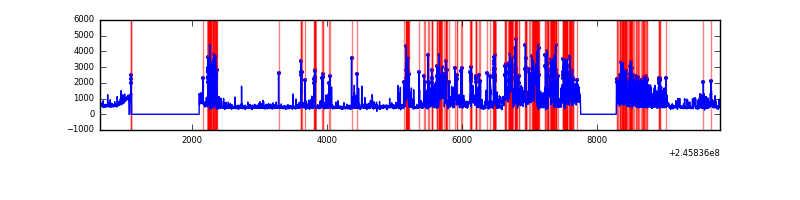 |
Top three noisy pixels from each quadrant. If the there are fewer than three noisy pixels in the level2.evt file, extra rows are filled as -1
| Pixel properties | Quadrant properties | ||||||
|---|---|---|---|---|---|---|---|
| Quadrant | DetID | PixID | Counts | Sigma | Mean | Median | Sigma |
| A | 8 | 15 | 54331 | 270.49 | 957 | 934 | 197.4 |
| A | 15 | 174 | 48336 | 240.13 | 957 | 934 | 197.4 |
| A | 11 | 29 | 13580 | 64.06 | 957 | 934 | 197.4 |
| B | 4 | 239 | 1452220 | 7876.73 | 946 | 922 | 184.3 |
| B | 10 | 16 | 108731 | 585.12 | 946 | 922 | 184.3 |
| B | 15 | 204 | 34577 | 182.66 | 946 | 922 | 184.3 |
| C | 9 | 204 | 22623 | 98.59 | 933 | 937 | 220.0 |
| C | 13 | 61 | 6923 | 27.21 | 933 | 937 | 220.0 |
| C | 14 | 234 | 2584 | 7.49 | 933 | 937 | 220.0 |
| D | 10 | 157 | 1215877 | 5586.35 | 891 | 864 | 217.5 |
| D | 10 | 253 | 1140011 | 5237.54 | 891 | 864 | 217.5 |
| D | 14 | 34 | 269295 | 1234.18 | 891 | 864 | 217.5 |
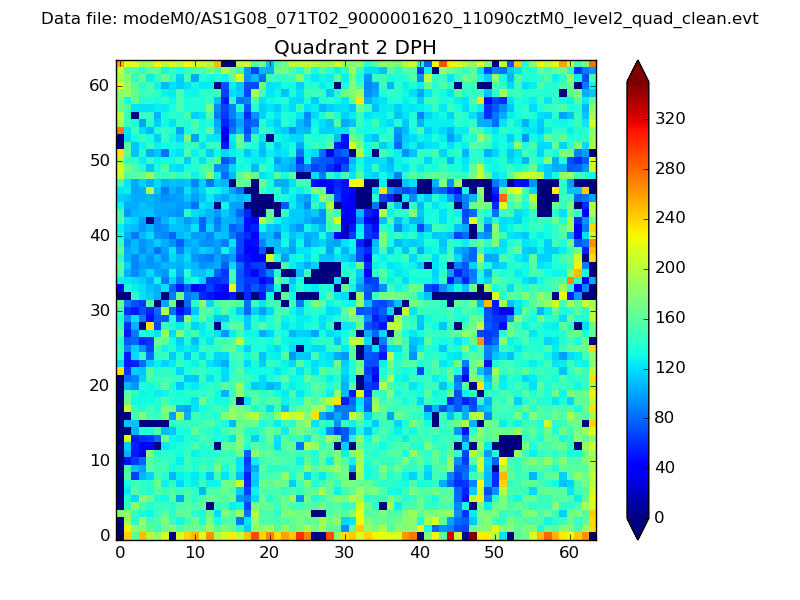
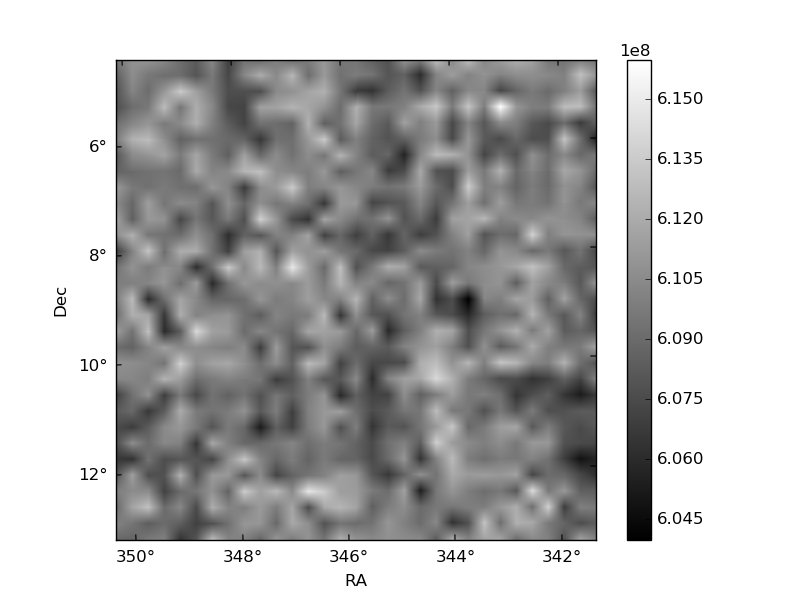
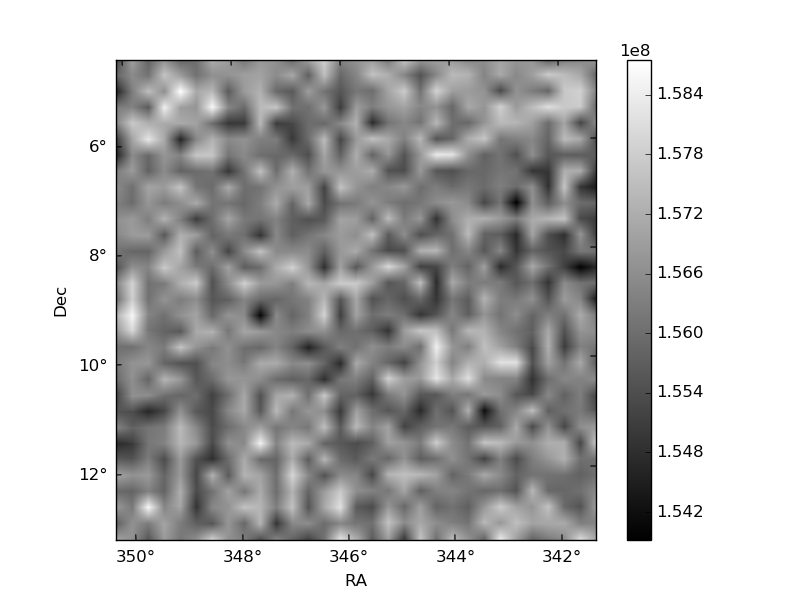
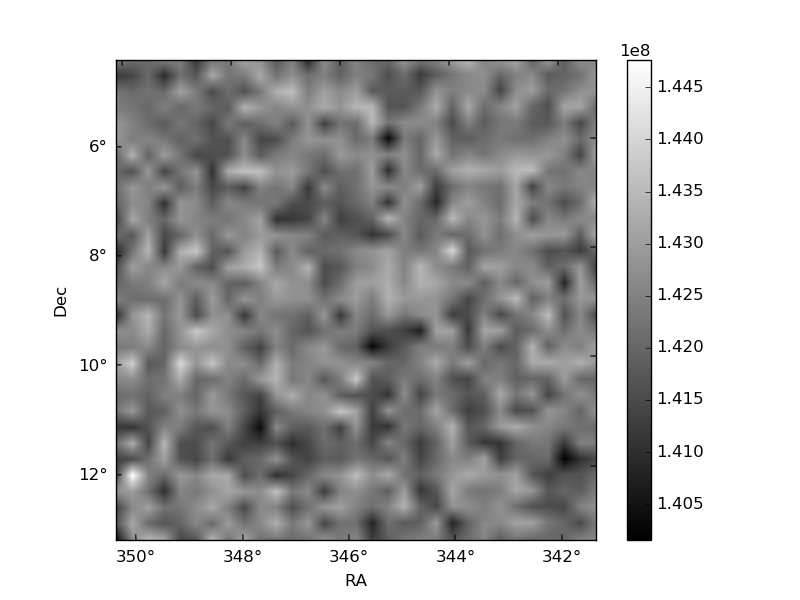
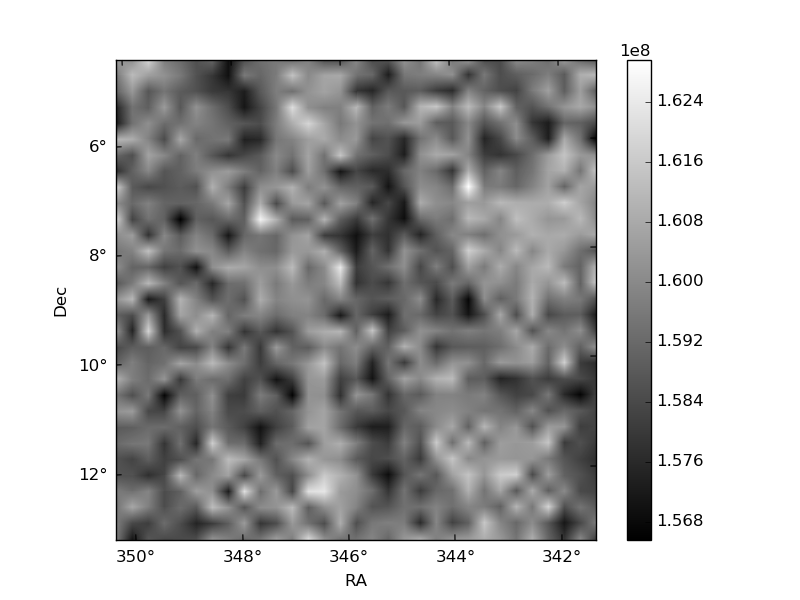
Histogram calculated using DETX and DETY for each event in the final _common_clean file
| Quadrant A | 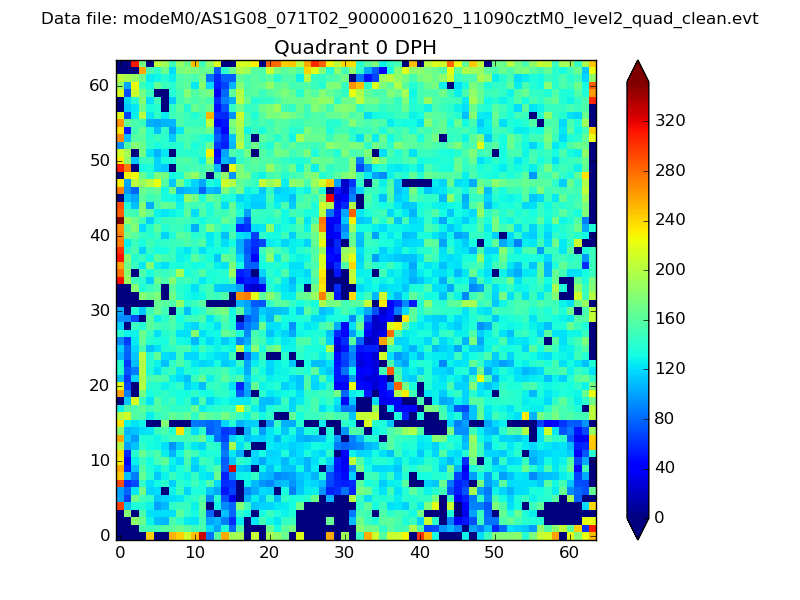 |
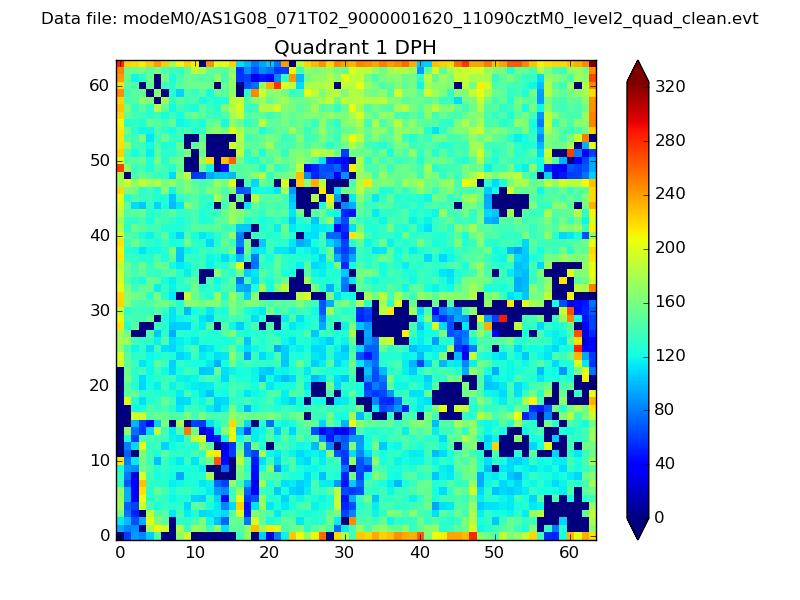 |
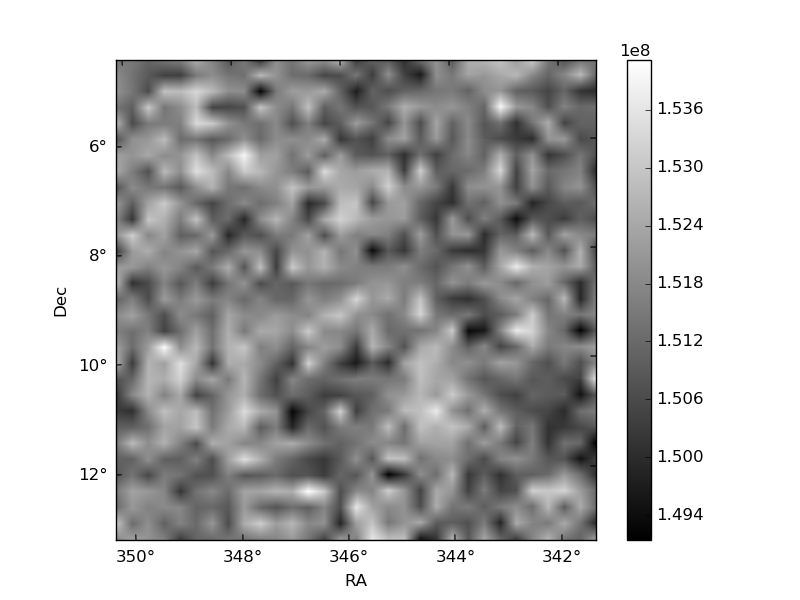
Quadrant B |
|---|---|---|---|
| Quadrant D | 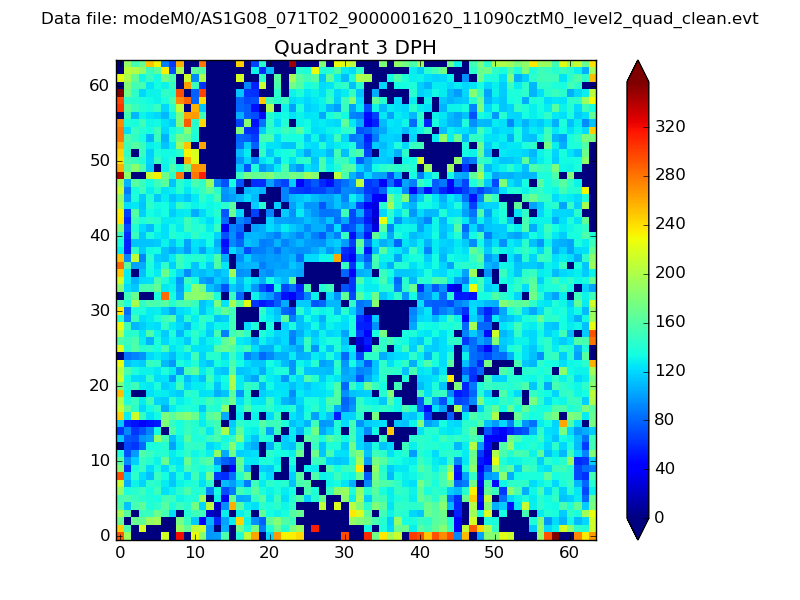 |
 |
Quadrant C |
| Plot type | Count rate plots | Images |
|---|---|---|
| Comparison with Poisson distribution Blue bars denote a histogram of data divided into 1 sec bins. Red curve is a Poisson curve with rate = median count rate of data. |
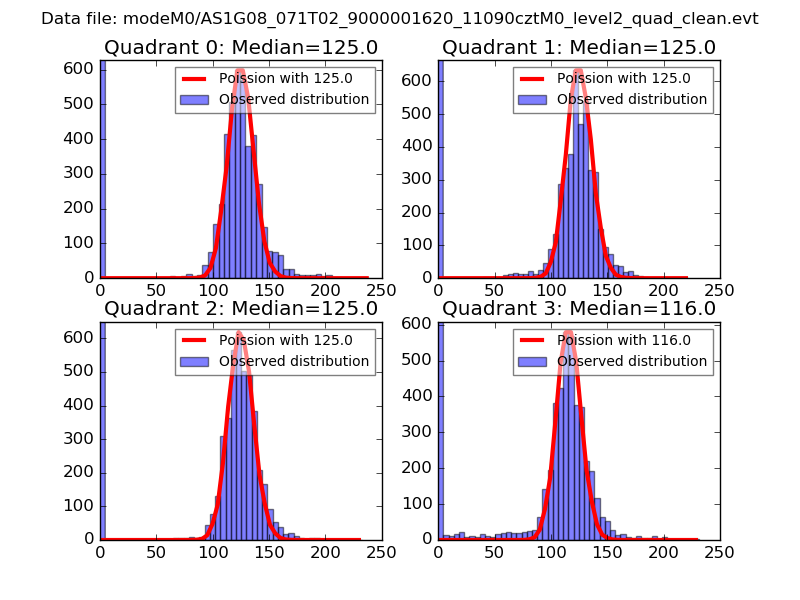 |
 |
| Quadrant-wise count rates Data is divided into 100 sec bins |
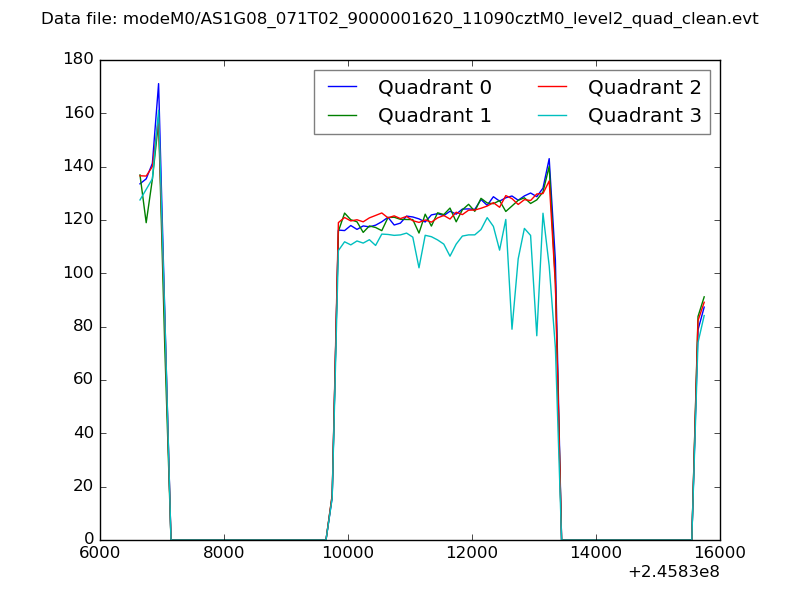 |
|
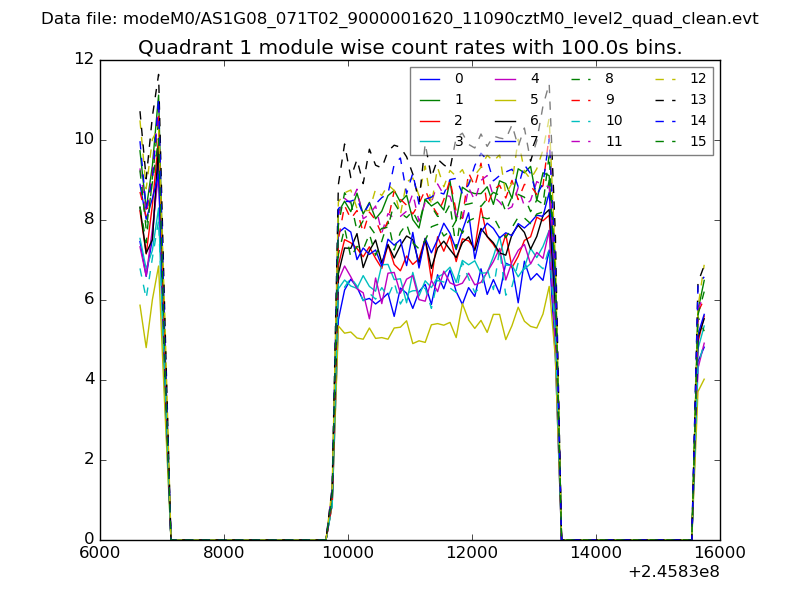
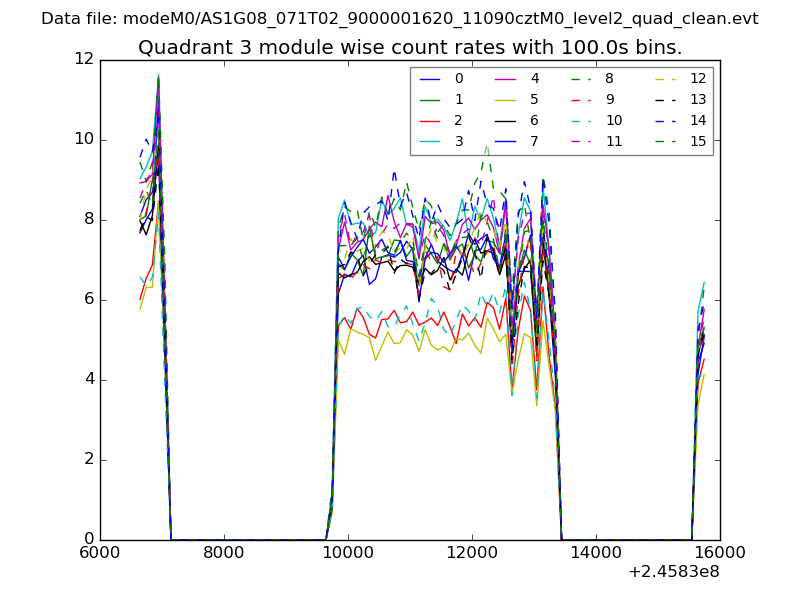
| Module-wise count rates for Quadrant A Data is divided into 100 sec bins |
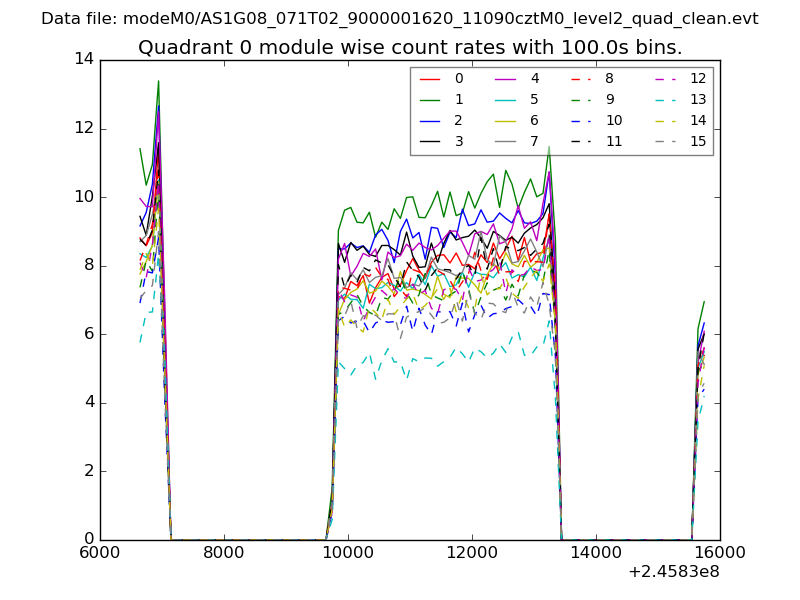 |
 |
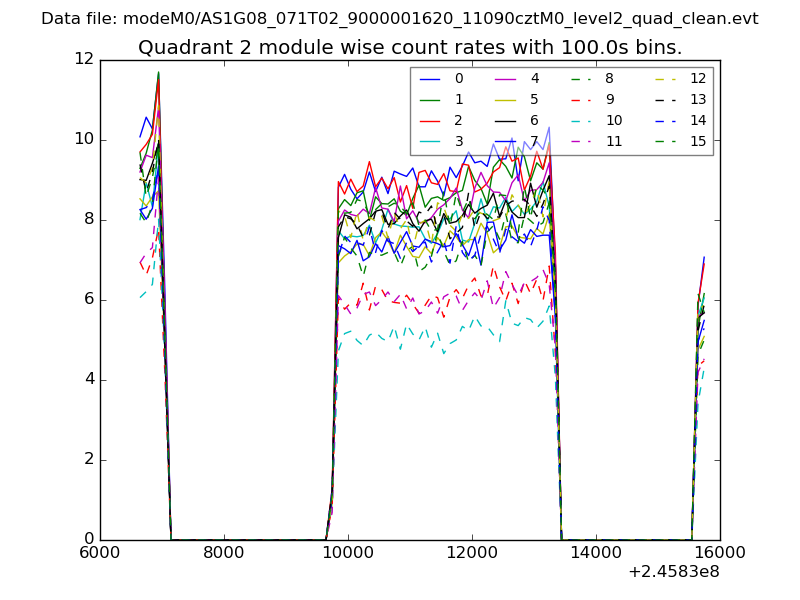
| Module-wise count rates for Quadrant B Data is divided into 100 sec bins |
 |
 |
| Module-wise count rates for Quadrant C Data is divided into 100 sec bins |
 |
 |
| Module-wise count rates for Quadrant D Data is divided into 100 sec bins |
 |
 |
| Parameter | Plot |
|---|---|
| CZT HV Monitor | 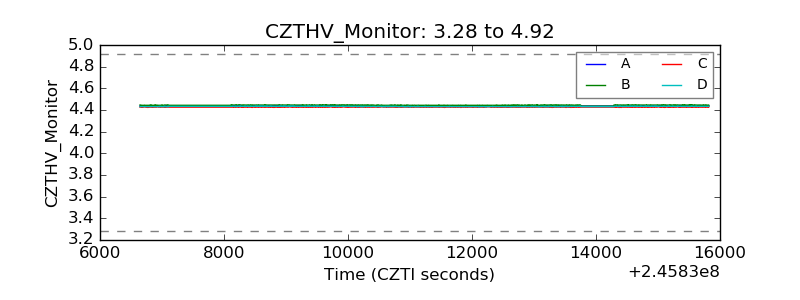 |
| D_VDD | 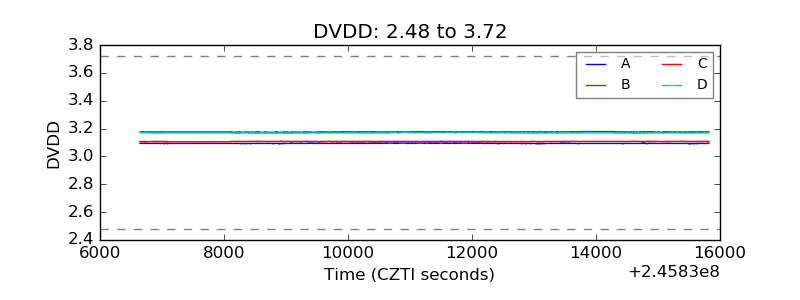 |
| Temperature 1 | 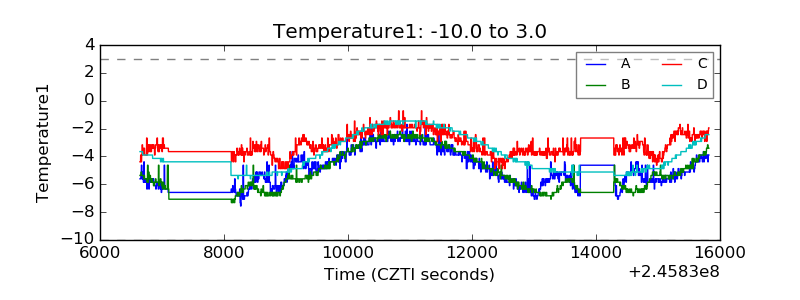 |
| Veto HV Monitor |  |
| Veto LLD | 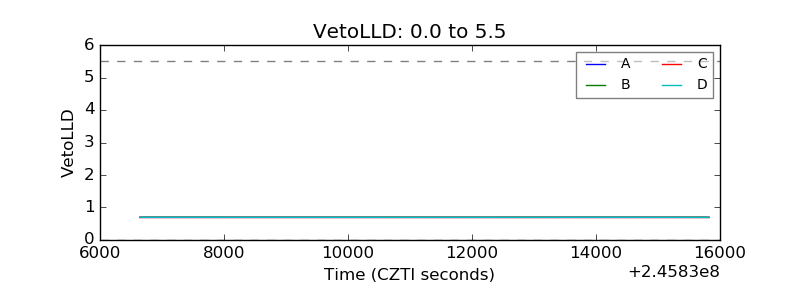 |
| Alpha Counter |  |
| _CPM_Rate | 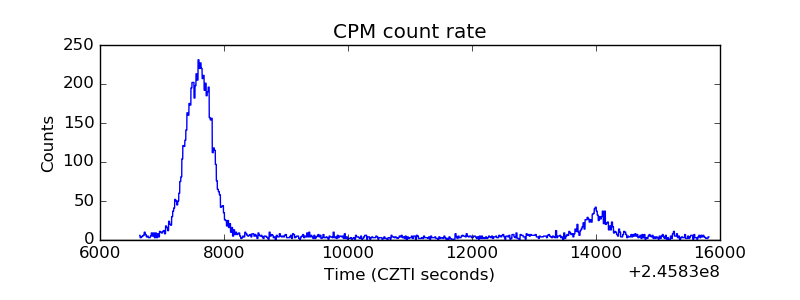 |
| CZT Counter |  |
| +2.5 Volts monitor |  |
| +5 Volts monitor |  |
| _ROLL_ROT | 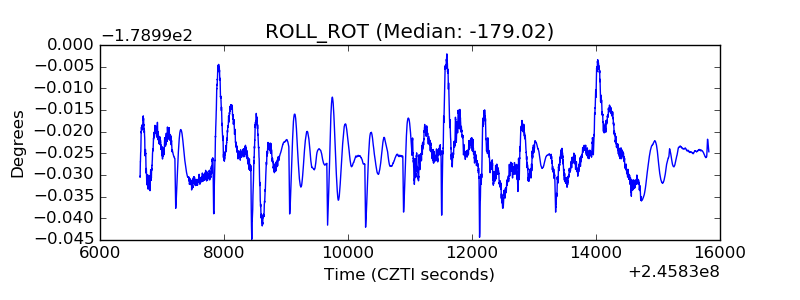 |
| _Roll_DEC | 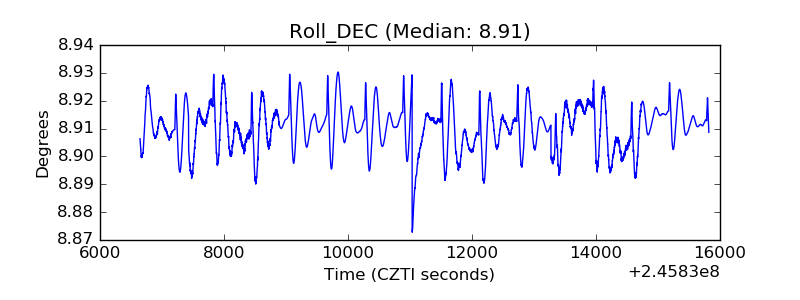 |
| _Roll_RA | 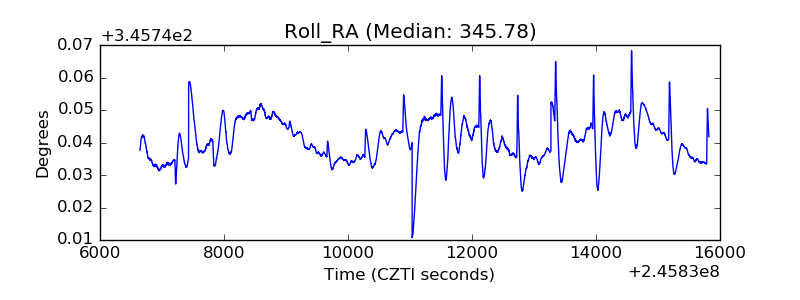 |
| Veto Counter | 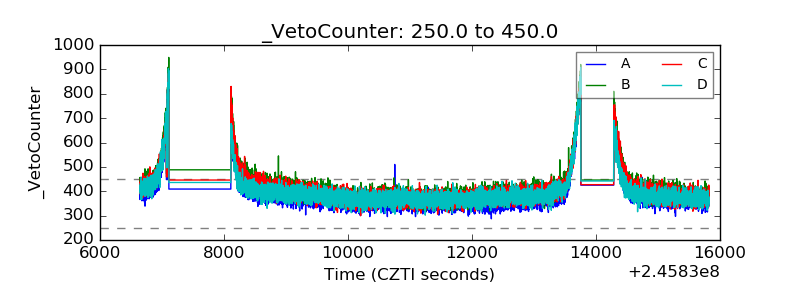 |