| Param | Original file | Final file |
|---|---|---|
| Filename | modeM0/AS1G08_071T02_9000001620_11091cztM0_level2.evt | modeM0/AS1G08_071T02_9000001620_11091cztM0_level2_quad_clean.evt |
| Size (bytes) | 615,683,520 | 82,281,600 |
| Size | 587.2 MB | 78.5 MB |
| Events in quadrant A | 3,843,240 | 492,646 |
| Events in quadrant B | 5,269,541 | 491,674 |
| Events in quadrant C | 3,713,303 | 496,448 |
| Events in quadrant D | 5,289,409 | 467,239 |
| Mode SS | |||
|---|---|---|---|
| Quadrant | BADHDUFLAG | Total packets | Discarded packets |
| A | 0 | 162 | 0 |
| B | 0 | 162 | 0 |
| C | 0 | 162 | 0 |
| D | 0 | 162 | 0 |
| Mode M9 | |||
|---|---|---|---|
| Quadrant | BADHDUFLAG | Total packets | Discarded packets |
| A | 0 | 6 | 0 |
| B | 0 | 6 | 0 |
| C | 0 | 6 | 0 |
| D | 0 | 6 | 0 |
| Mode M0 | |||
|---|---|---|---|
| Quadrant | BADHDUFLAG | Total packets | Discarded packets |
| A | 0 | 16556 | 3 |
| B | 0 | 20695 | 2 |
| C | 0 | 16445 | 2 |
| D | 0 | 20972 | 2 |
| Quadrant | Total seconds | Saturated seconds | Saturation percentage |
|---|---|---|---|
| A | 7810 | 369 | 4.724712% |
| B | 7810 | 841 | 10.768246% |
| C | 7810 | 243 | 3.111396% |
| D | 7810 | 627 | 8.028169% |
Noise dominated data is calculated using 1-second bins in cleaned event files. If a bin has >2000 counts, and if more than 50% of those come from <1% of pixels, then it is considered to be noise-dominated and hence unusable.
| Quadrant | # 1 sec bins | Bins with >0 counts | Bins with >2000 counts | High rate bins dominated by noise | Noise dominated (total time) | Noise dominated (detector-on time) | Marked lightcurve |
|---|---|---|---|---|---|---|---|
| A | 8450 | 7813 | 0 | 0 | 0.00% | 0.00% | 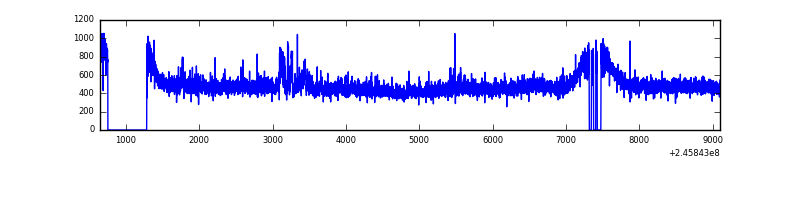 |
| B | 8450 | 7813 | 364 | 364 | 4.31% | 4.66% | 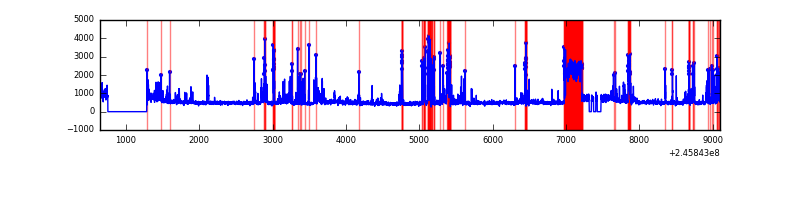 |
| C | 8450 | 7814 | 0 | 0 | 0.00% | 0.00% | 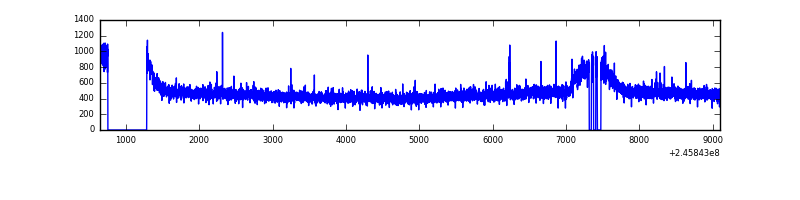 |
| D | 8450 | 7814 | 284 | 284 | 3.36% | 3.63% | 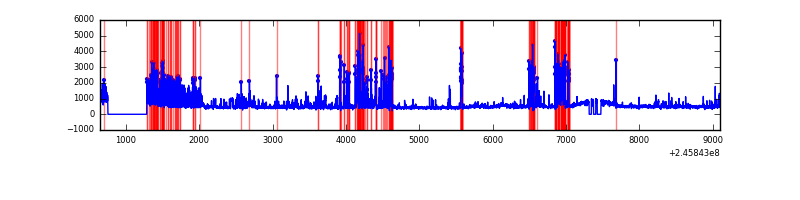 |
Top three noisy pixels from each quadrant. If the there are fewer than three noisy pixels in the level2.evt file, extra rows are filled as -1
| Pixel properties | Quadrant properties | ||||||
|---|---|---|---|---|---|---|---|
| Quadrant | DetID | PixID | Counts | Sigma | Mean | Median | Sigma |
| A | 15 | 174 | 58238 | 287.37 | 960 | 933 | 199.4 |
| A | 1 | 162 | 23310 | 112.22 | 960 | 933 | 199.4 |
| A | 1 | 178 | 14541 | 68.24 | 960 | 933 | 199.4 |
| B | 10 | 16 | 987008 | 5490.08 | 919 | 895 | 179.6 |
| B | 4 | 239 | 568376 | 3159.39 | 919 | 895 | 179.6 |
| B | 15 | 204 | 31413 | 169.91 | 919 | 895 | 179.6 |
| C | 9 | 204 | 34511 | 152.95 | 939 | 942 | 219.5 |
| C | 13 | 61 | 7093 | 28.03 | 939 | 942 | 219.5 |
| C | 14 | 234 | 6103 | 23.52 | 939 | 942 | 219.5 |
| D | 10 | 253 | 807748 | 3637.14 | 913 | 883 | 221.8 |
| D | 10 | 157 | 581784 | 2618.55 | 913 | 883 | 221.8 |
| D | 1 | 52 | 127196 | 569.38 | 913 | 883 | 221.8 |
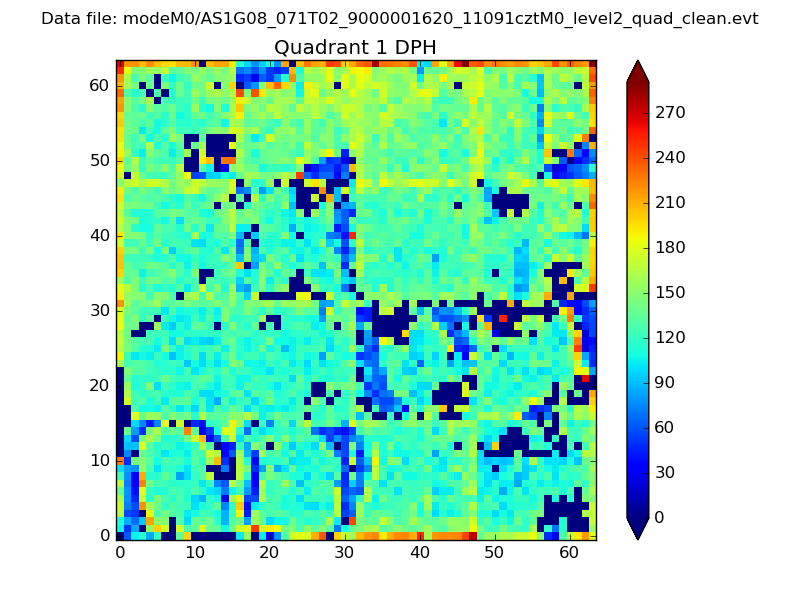
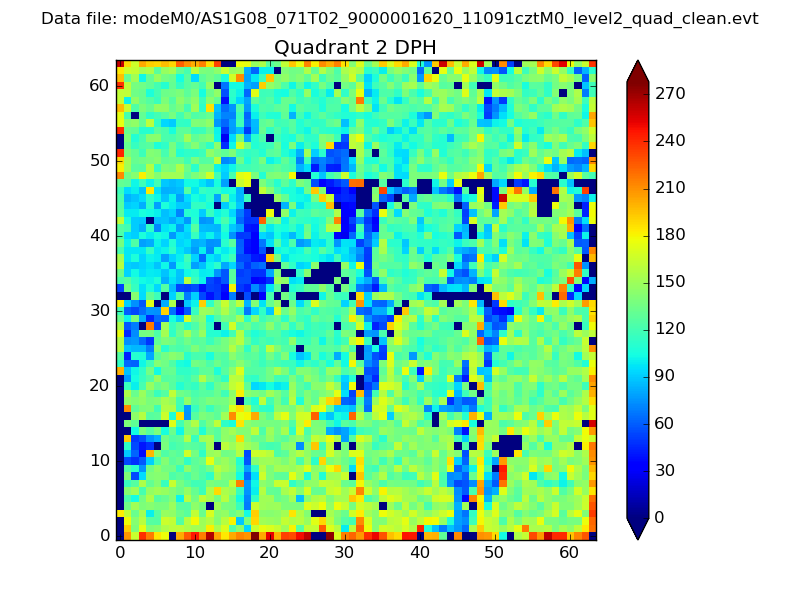
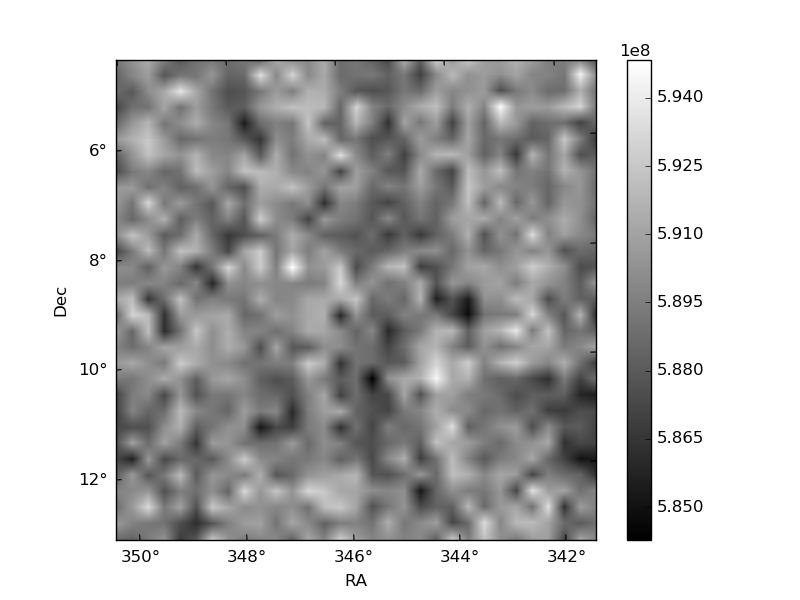
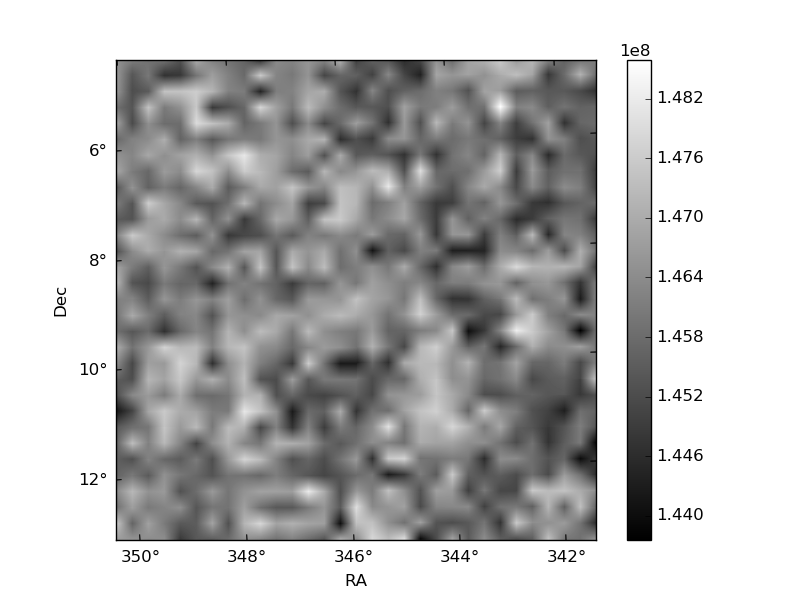
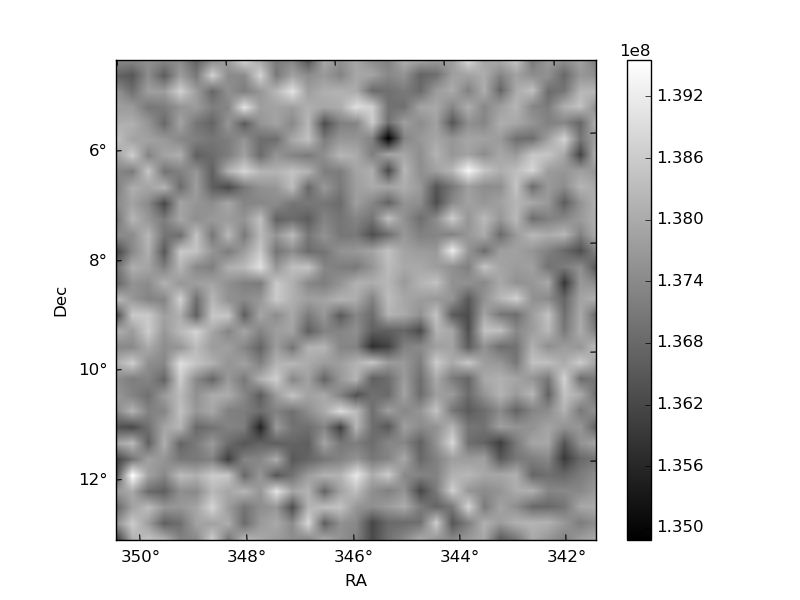
Histogram calculated using DETX and DETY for each event in the final _common_clean file
| Quadrant A |  |
 |
Quadrant B |
|---|---|---|---|
| Quadrant D | 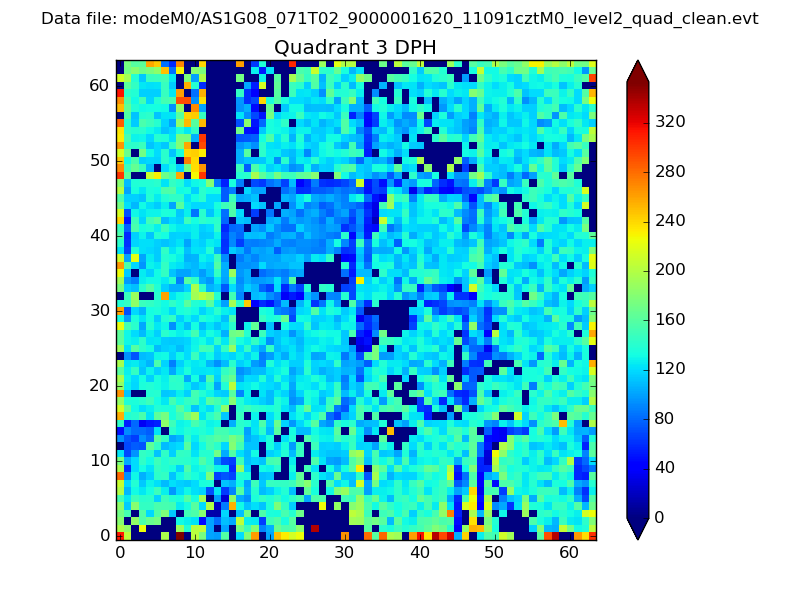 |
 |
Quadrant C |
| Plot type | Count rate plots | Images |
|---|---|---|
| Comparison with Poisson distribution Blue bars denote a histogram of data divided into 1 sec bins. Red curve is a Poisson curve with rate = median count rate of data. |
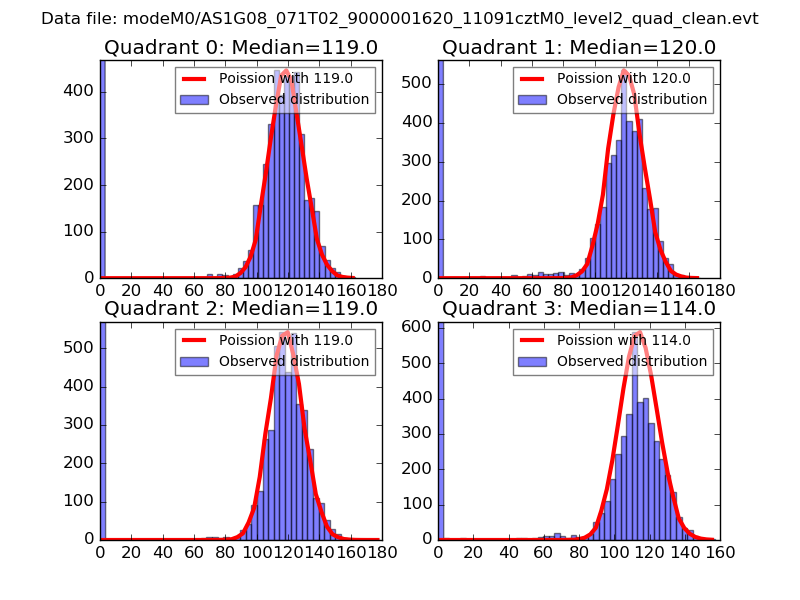 |
 |
| Quadrant-wise count rates Data is divided into 100 sec bins |
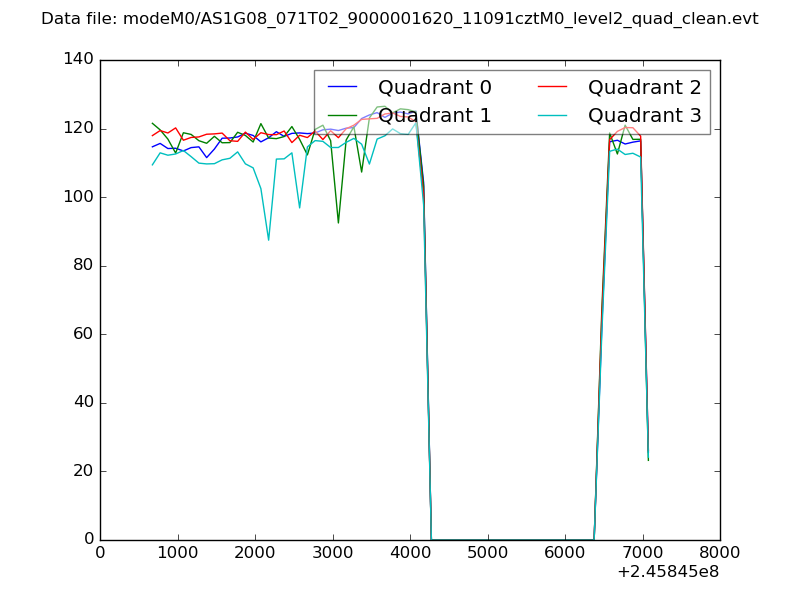 |
|
| Module-wise count rates for Quadrant A Data is divided into 100 sec bins |
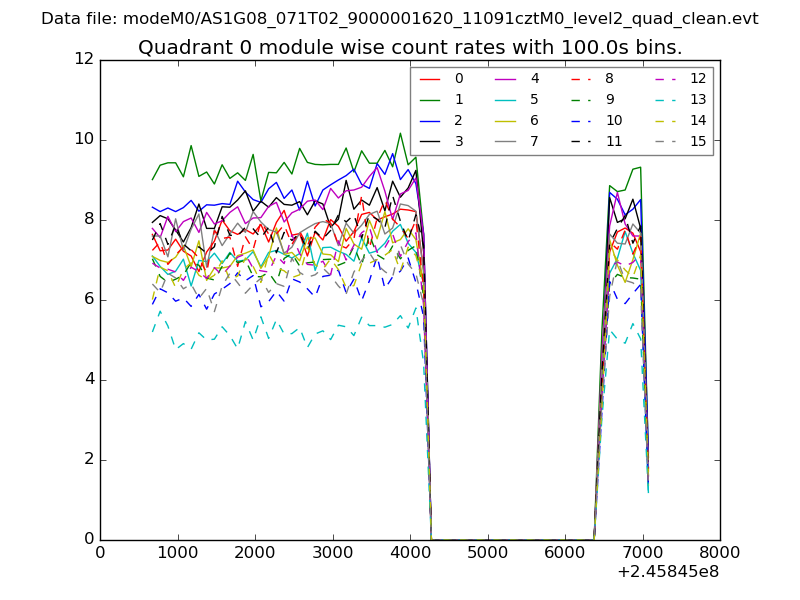 |
 |
| Module-wise count rates for Quadrant B Data is divided into 100 sec bins |
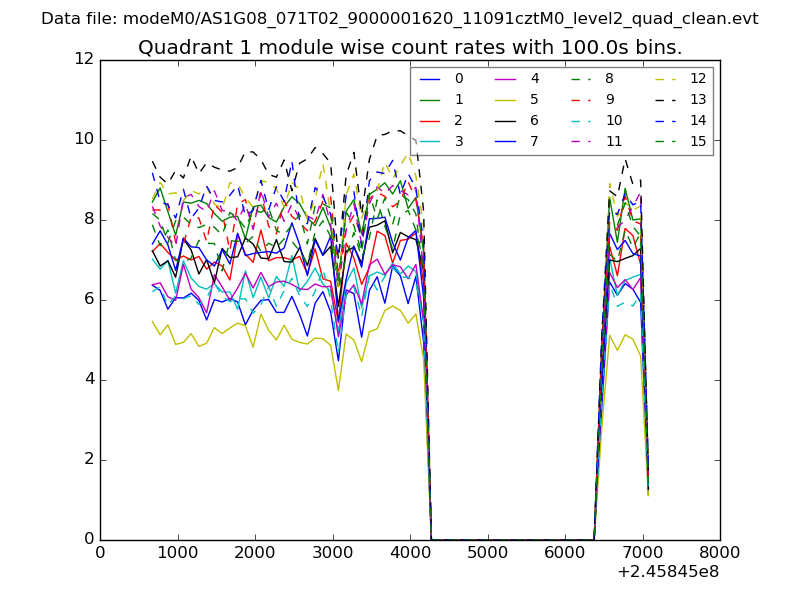 |
 |
| Module-wise count rates for Quadrant C Data is divided into 100 sec bins |
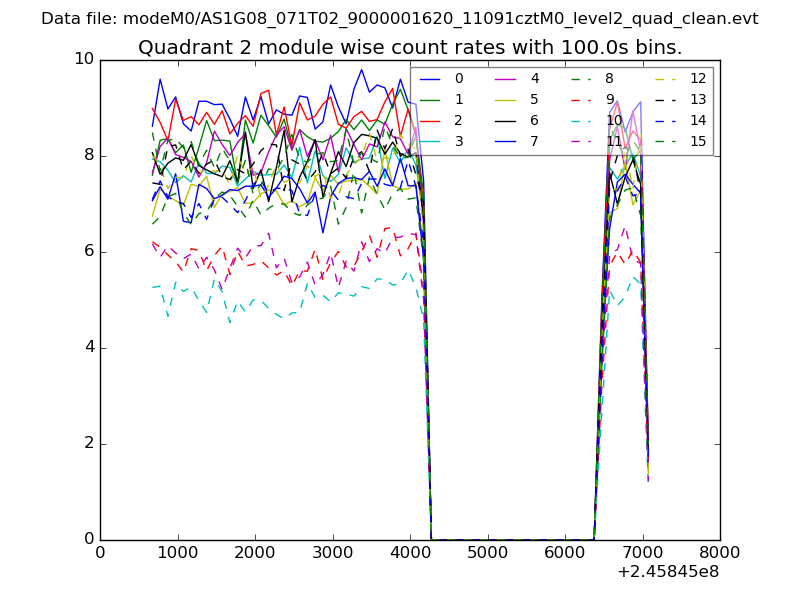 |
 |
| Module-wise count rates for Quadrant D Data is divided into 100 sec bins |
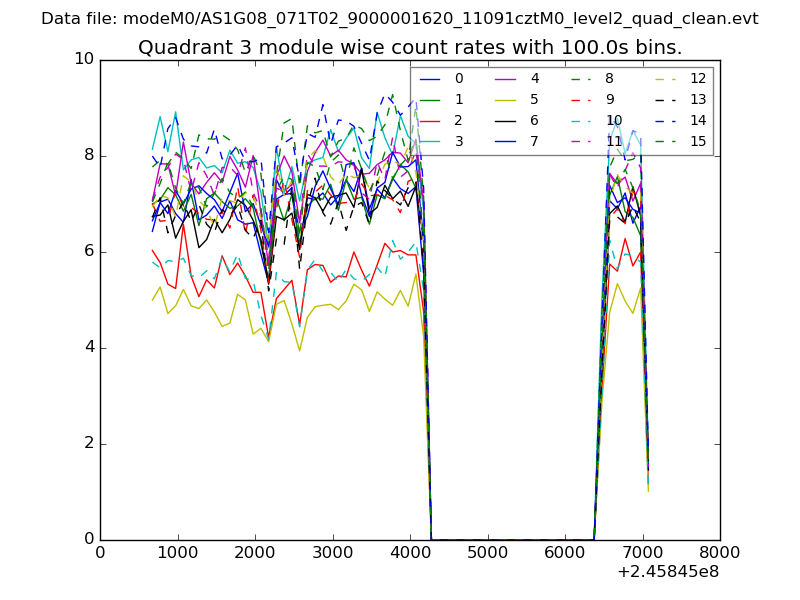 |
 |
| Parameter | Plot |
|---|---|
| CZT HV Monitor | 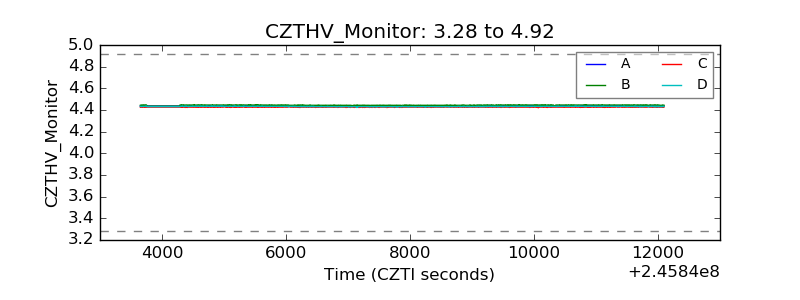 |
| D_VDD | 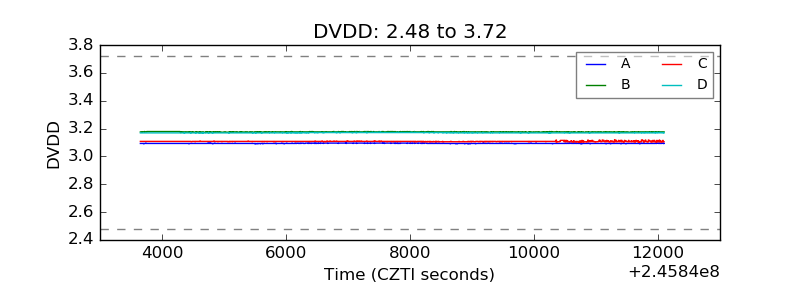 |
| Temperature 1 | 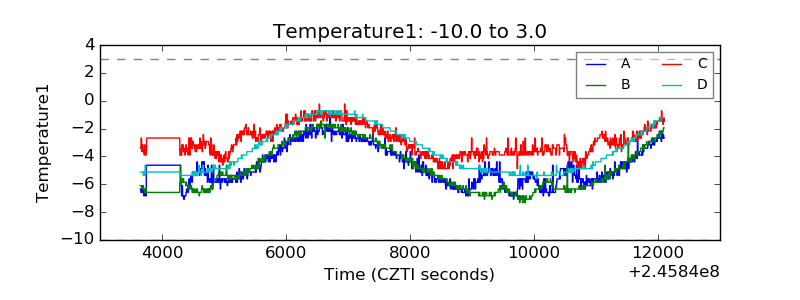 |
| Veto HV Monitor | 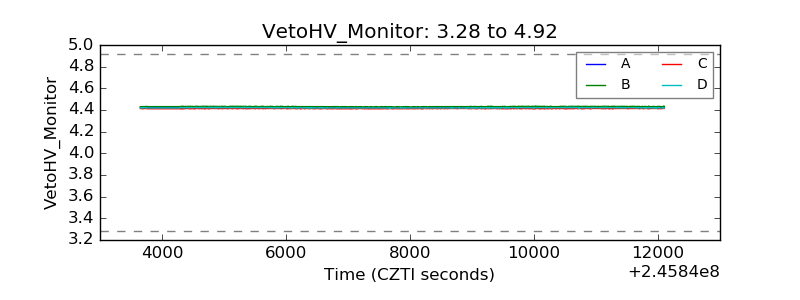 |
| Veto LLD | 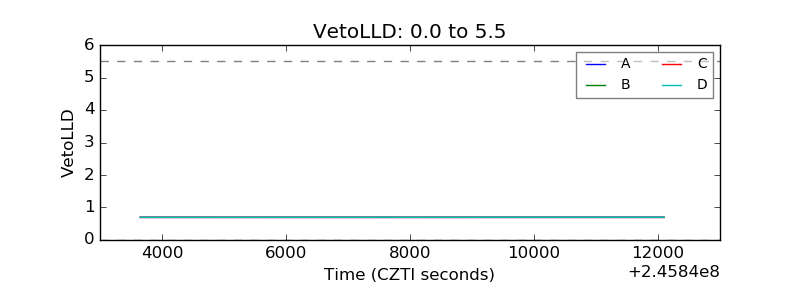 |
| Alpha Counter | 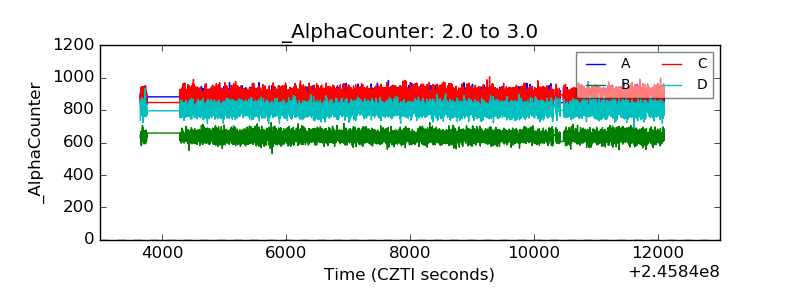 |
| _CPM_Rate | 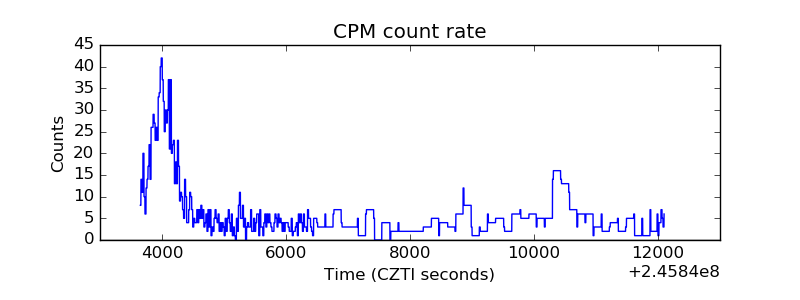 |
| CZT Counter |  |
| +2.5 Volts monitor |  |
| +5 Volts monitor |  |
| _ROLL_ROT | 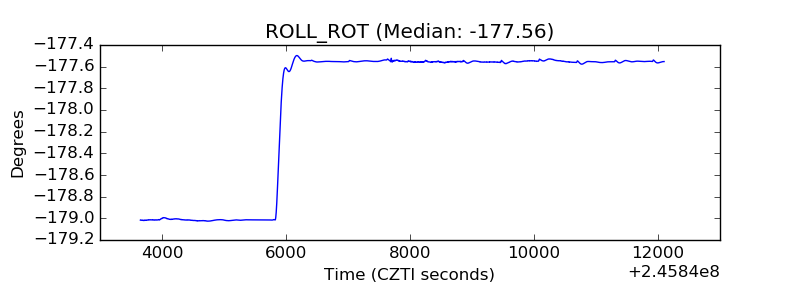 |
| _Roll_DEC | 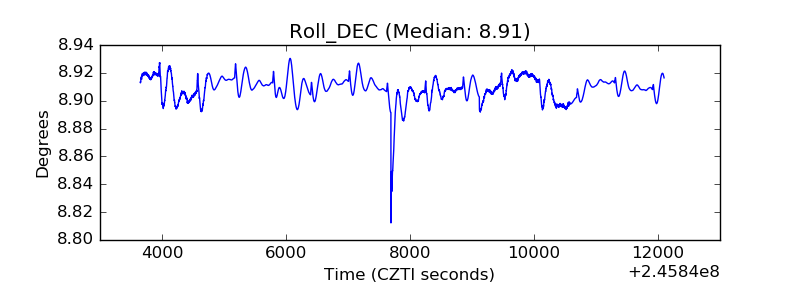 |
| _Roll_RA | 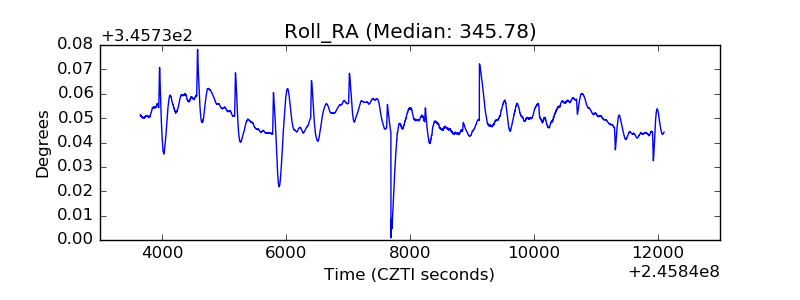 |
| Veto Counter | 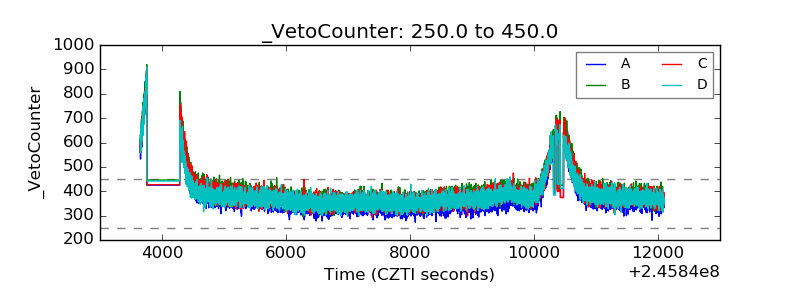 |