| Param | Original file | Final file |
|---|---|---|
| Filename | modeM0/AS1G08_071T02_9000001620_11092cztM0_level2.evt | modeM0/AS1G08_071T02_9000001620_11092cztM0_level2_quad_clean.evt |
| Size (bytes) | 592,963,200 | 89,971,200 |
| Size | 565.5 MB | 85.8 MB |
| Events in quadrant A | 3,881,286 | 554,775 |
| Events in quadrant B | 5,355,839 | 543,576 |
| Events in quadrant C | 3,637,814 | 556,153 |
| Events in quadrant D | 4,551,334 | 525,051 |
| Mode SS | |||
|---|---|---|---|
| Quadrant | BADHDUFLAG | Total packets | Discarded packets |
| A | 0 | 158 | 0 |
| B | 0 | 158 | 0 |
| C | 0 | 158 | 0 |
| D | 0 | 158 | 0 |
| Mode M9 | |||
|---|---|---|---|
| Quadrant | BADHDUFLAG | Total packets | Discarded packets |
| A | 0 | 1 | 0 |
| B | 0 | 1 | 0 |
| C | 0 | 1 | 0 |
| D | 0 | 1 | 0 |
| Mode M0 | |||
|---|---|---|---|
| Quadrant | BADHDUFLAG | Total packets | Discarded packets |
| A | 0 | 16565 | 2 |
| B | 0 | 20969 | 1 |
| C | 0 | 16170 | 1 |
| D | 0 | 18579 | 1 |
| Quadrant | Total seconds | Saturated seconds | Saturation percentage |
|---|---|---|---|
| A | 7838 | 228 | 2.908905% |
| B | 7838 | 567 | 7.233988% |
| C | 7838 | 104 | 1.326869% |
| D | 7838 | 357 | 4.554733% |
Noise dominated data is calculated using 1-second bins in cleaned event files. If a bin has >2000 counts, and if more than 50% of those come from <1% of pixels, then it is considered to be noise-dominated and hence unusable.
| Quadrant | # 1 sec bins | Bins with >0 counts | Bins with >2000 counts | High rate bins dominated by noise | Noise dominated (total time) | Noise dominated (detector-on time) | Marked lightcurve |
|---|---|---|---|---|---|---|---|
| A | 7863 | 7839 | 0 | 0 | 0.00% | 0.00% | 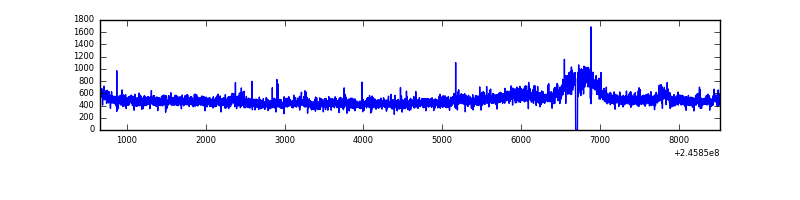 |
| B | 7863 | 7839 | 241 | 241 | 3.06% | 3.07% | 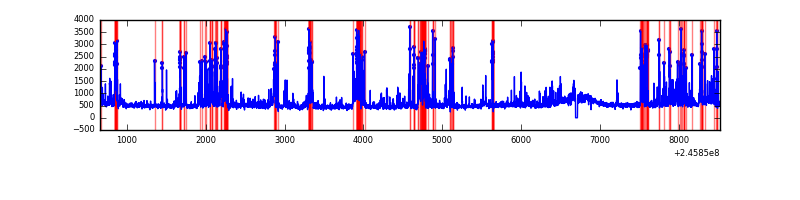 |
| C | 7863 | 7839 | 0 | 0 | 0.00% | 0.00% | 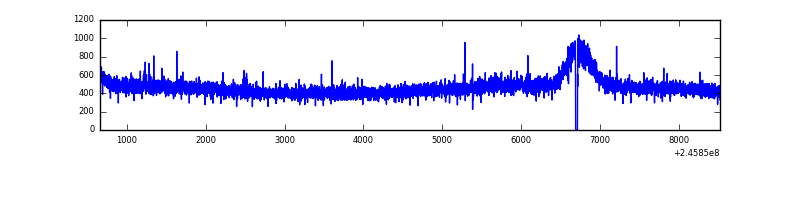 |
| D | 7863 | 7839 | 176 | 176 | 2.24% | 2.25% | 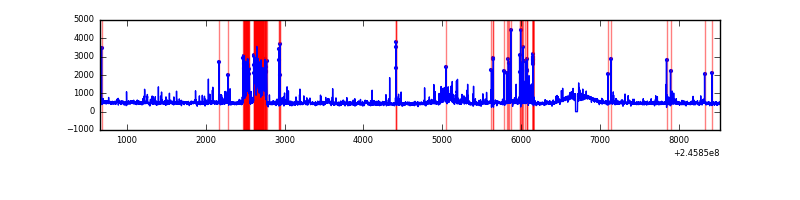 |
Top three noisy pixels from each quadrant. If the there are fewer than three noisy pixels in the level2.evt file, extra rows are filled as -1
| Pixel properties | Quadrant properties | ||||||
|---|---|---|---|---|---|---|---|
| Quadrant | DetID | PixID | Counts | Sigma | Mean | Median | Sigma |
| A | 8 | 15 | 204562 | 1043.15 | 949 | 925 | 195.2 |
| A | 11 | 29 | 17671 | 85.78 | 949 | 925 | 195.2 |
| A | 0 | 226 | 8552 | 39.07 | 949 | 925 | 195.2 |
| B | 10 | 16 | 958637 | 5297.03 | 935 | 910 | 180.8 |
| B | 4 | 239 | 532624 | 2940.82 | 935 | 910 | 180.8 |
| B | 15 | 204 | 53394 | 290.28 | 935 | 910 | 180.8 |
| C | 9 | 204 | 15114 | 65.43 | 924 | 929 | 216.8 |
| C | 8 | 128 | 10325 | 43.34 | 924 | 929 | 216.8 |
| C | 13 | 61 | 6921 | 27.64 | 924 | 929 | 216.8 |
| D | 13 | 104 | 491684 | 2209.39 | 912 | 886 | 222.1 |
| D | 10 | 253 | 149258 | 667.91 | 912 | 886 | 222.1 |
| D | 4 | 95 | 126918 | 567.35 | 912 | 886 | 222.1 |
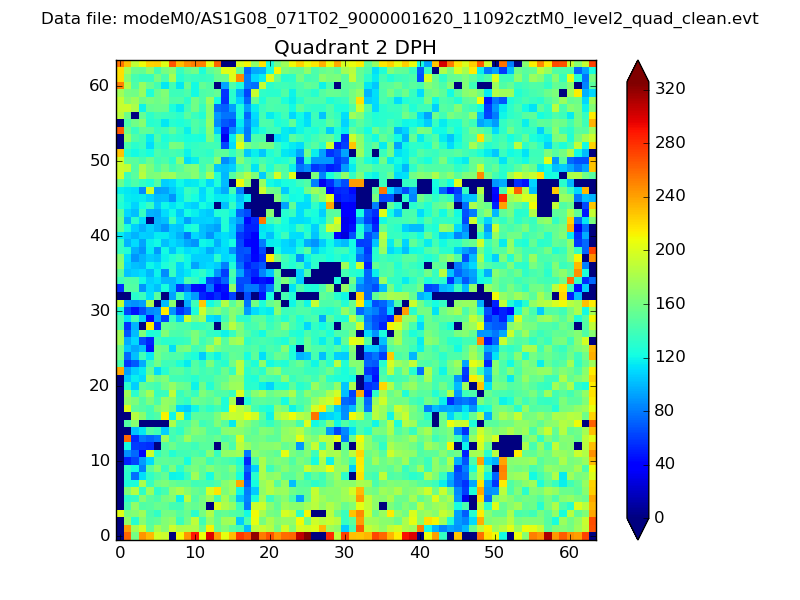
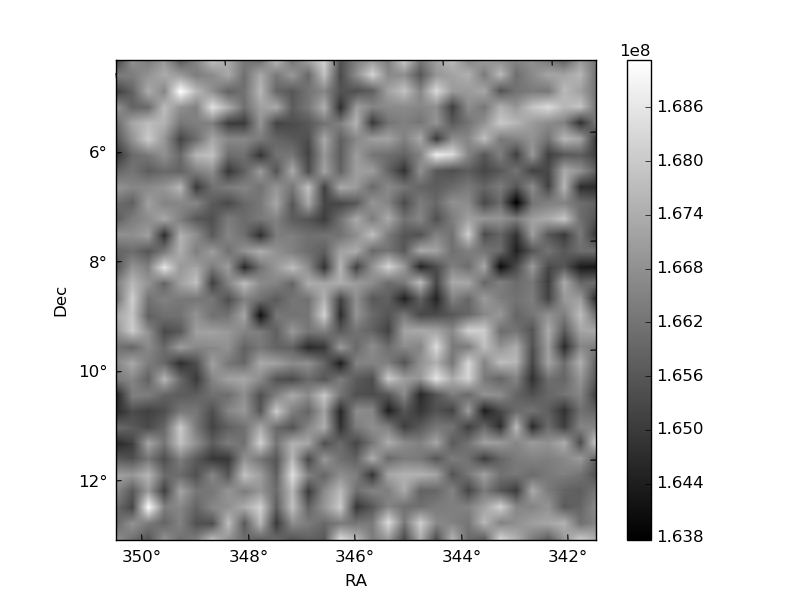
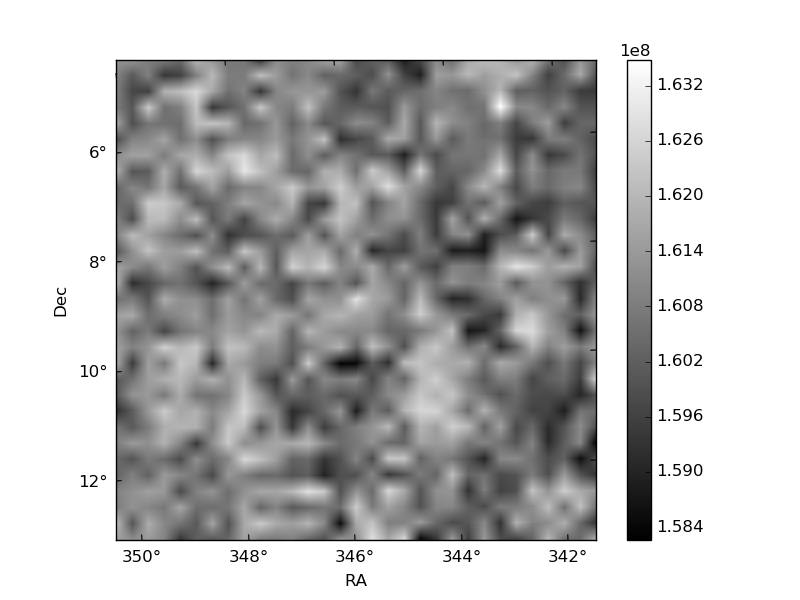
Histogram calculated using DETX and DETY for each event in the final _common_clean file
| Quadrant A | 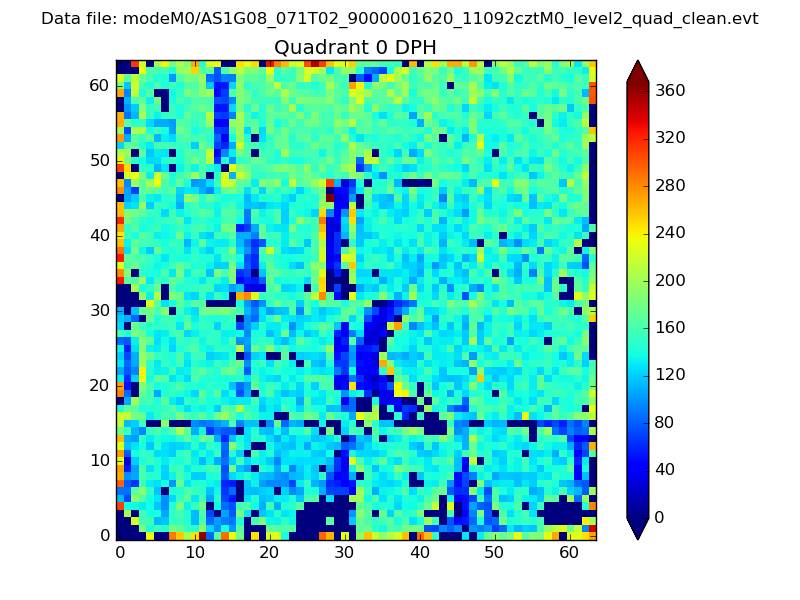 |
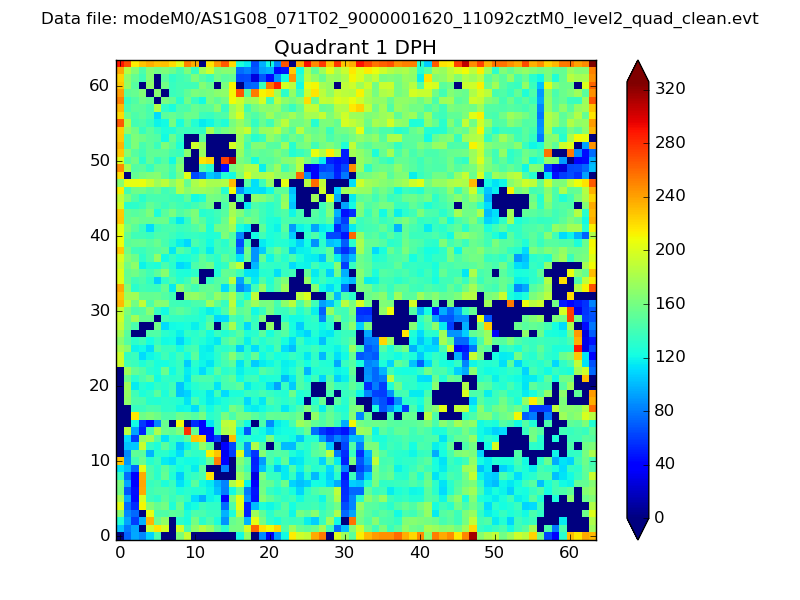 |
Quadrant B |
|---|---|---|---|
| Quadrant D | 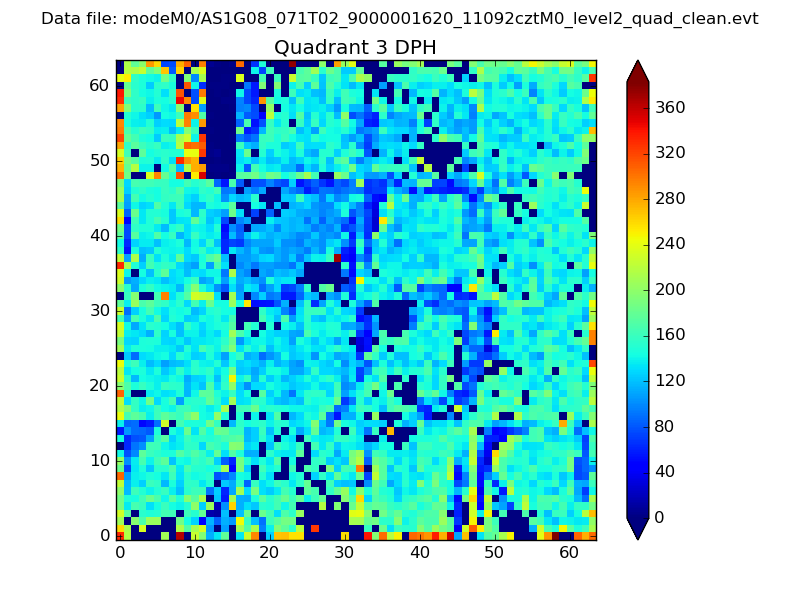 |
 |
Quadrant C |
| Plot type | Count rate plots | Images |
|---|---|---|
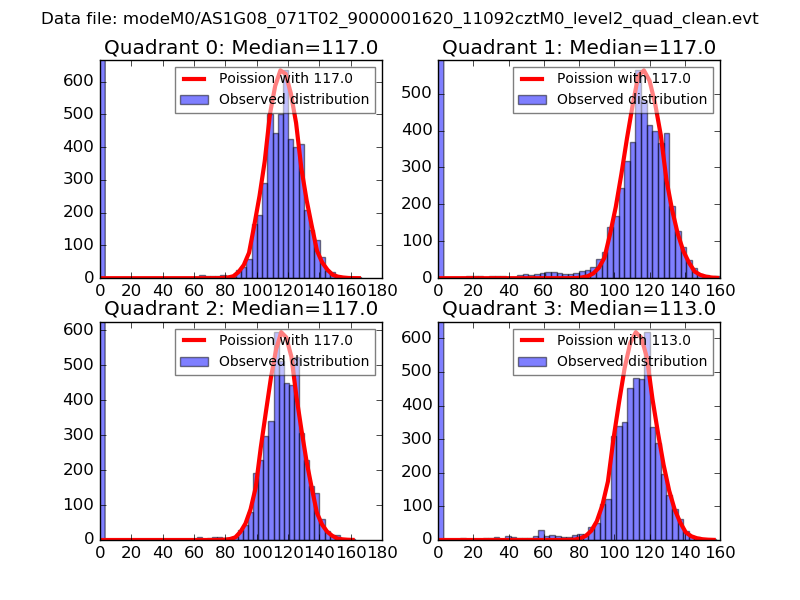
| Comparison with Poisson distribution Blue bars denote a histogram of data divided into 1 sec bins. Red curve is a Poisson curve with rate = median count rate of data. |
 |
 |
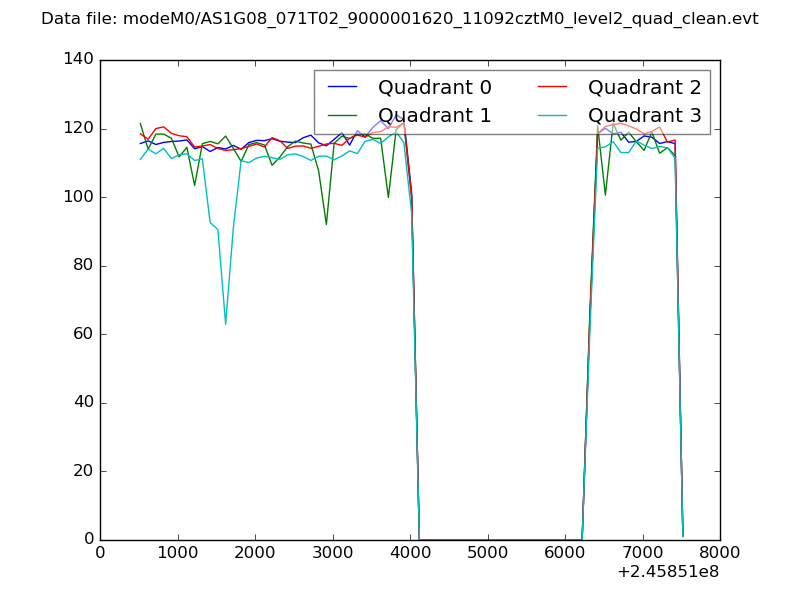
| Quadrant-wise count rates Data is divided into 100 sec bins |
 |
|
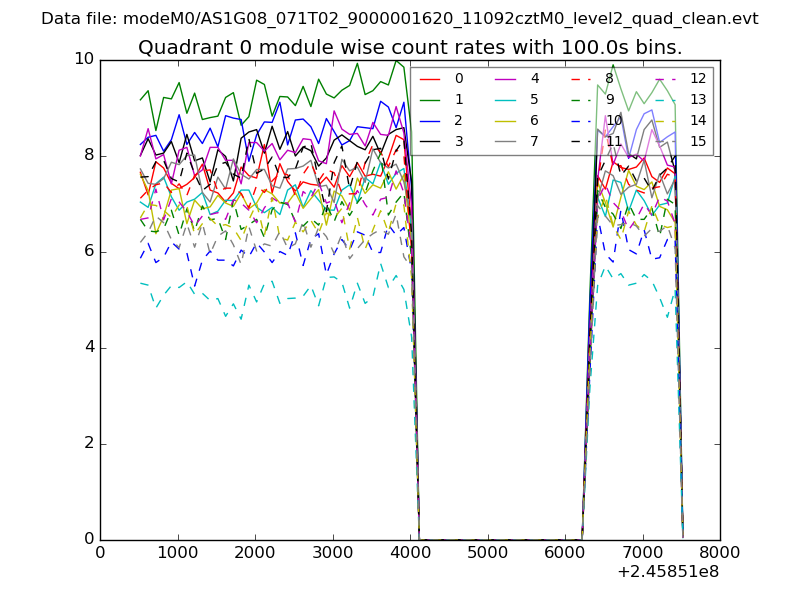
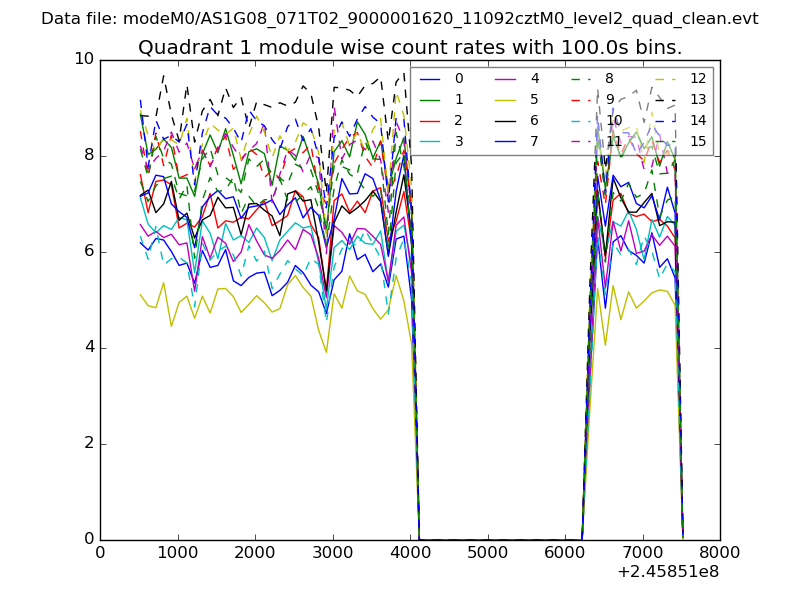
| Module-wise count rates for Quadrant A Data is divided into 100 sec bins |
 |
 |
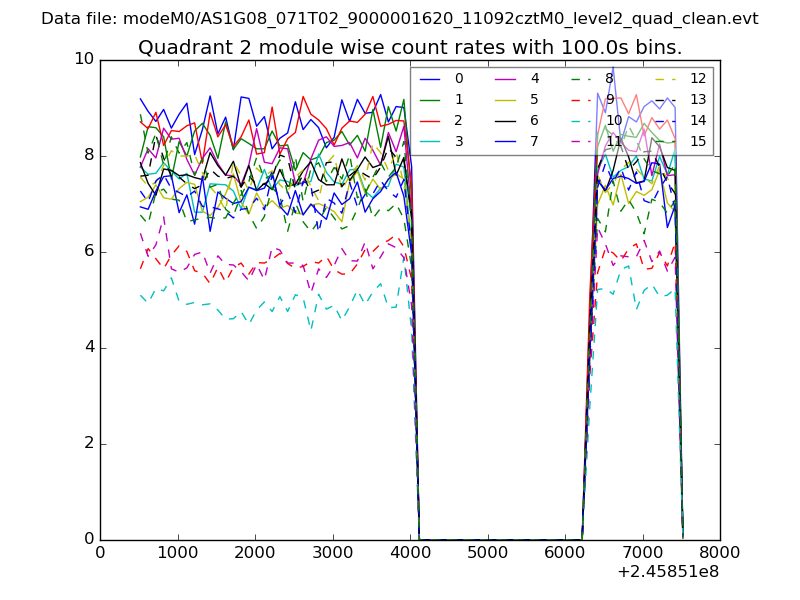
| Module-wise count rates for Quadrant B Data is divided into 100 sec bins |
 |
 |
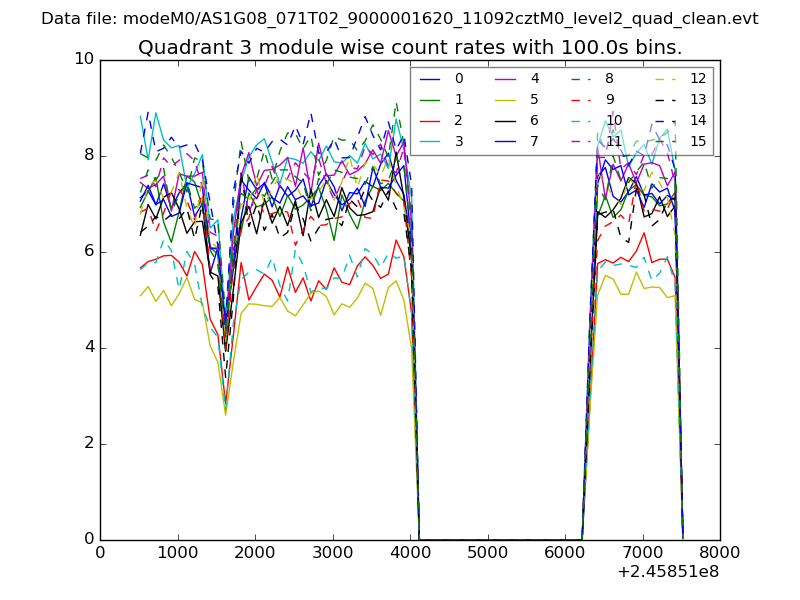
| Module-wise count rates for Quadrant C Data is divided into 100 sec bins |
 |
 |
| Module-wise count rates for Quadrant D Data is divided into 100 sec bins |
 |
 |
| Parameter | Plot |
|---|---|
| CZT HV Monitor | 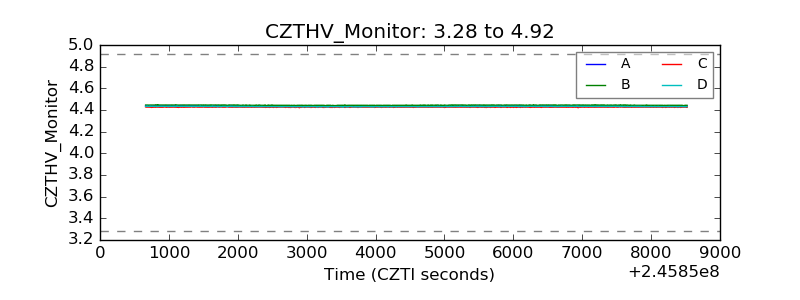 |
| D_VDD | 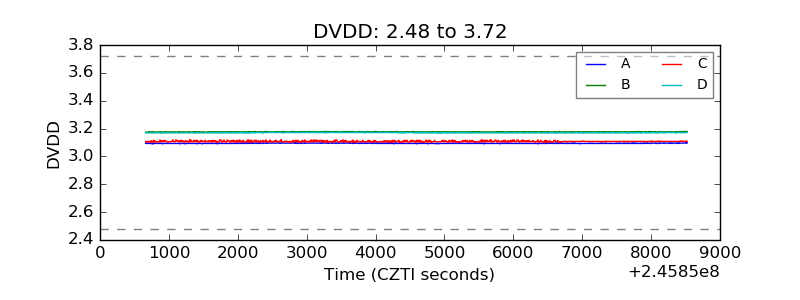 |
| Temperature 1 | 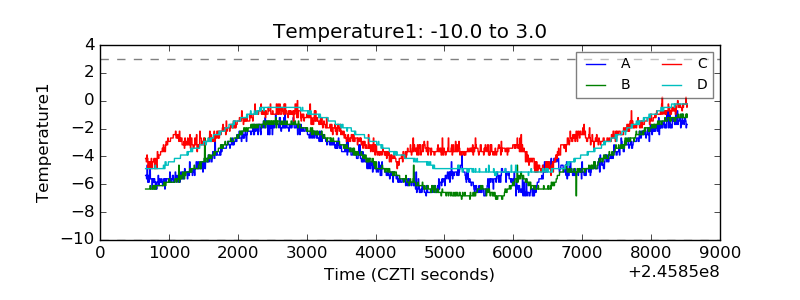 |
| Veto HV Monitor | 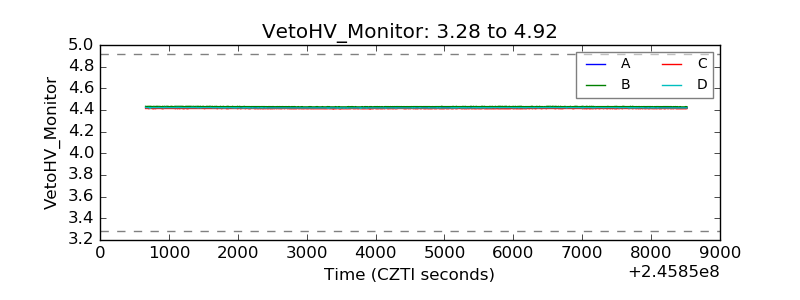 |
| Veto LLD | 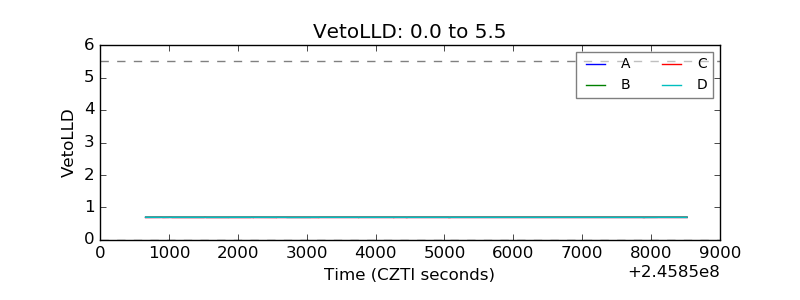 |
| Alpha Counter | 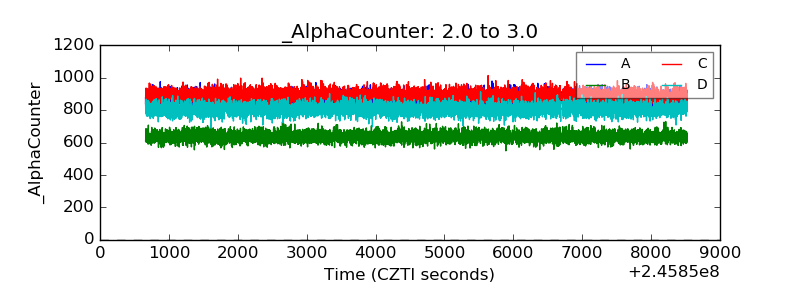 |
| _CPM_Rate | 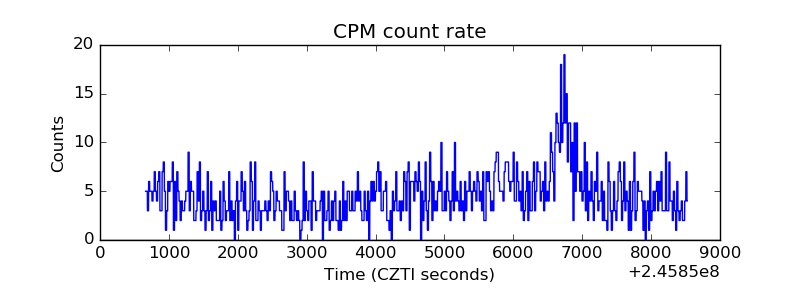 |
| CZT Counter | 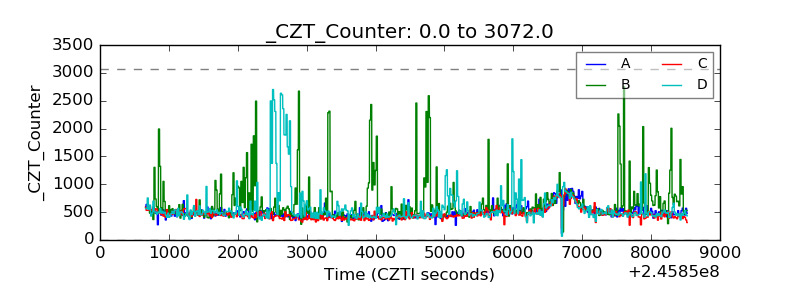 |
| +2.5 Volts monitor |  |
| +5 Volts monitor |  |
| _ROLL_ROT | 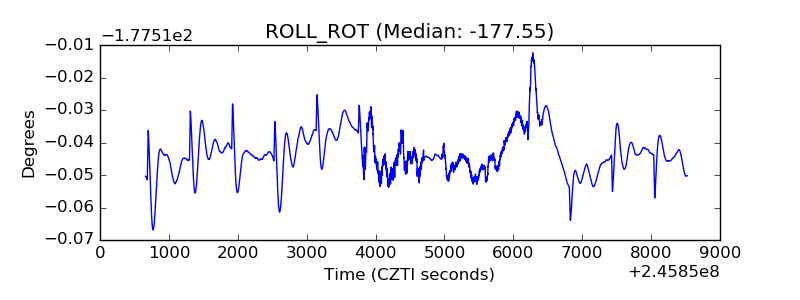 |
| _Roll_DEC | 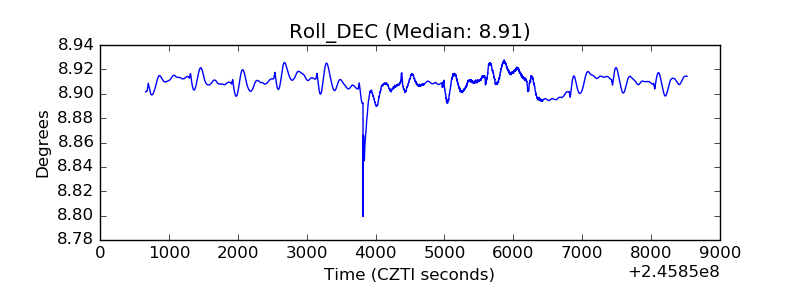 |
| _Roll_RA | 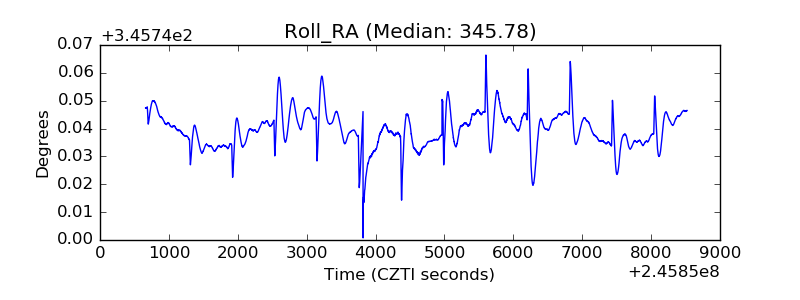 |
| Veto Counter | 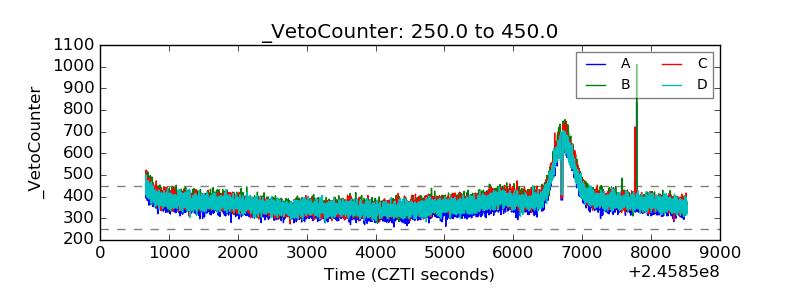 |