| Param | Original file | Final file |
|---|---|---|
| Filename | modeM0/AS1G08_071T02_9000001620_11095cztM0_level2.evt | modeM0/AS1G08_071T02_9000001620_11095cztM0_level2_quad_clean.evt |
| Size (bytes) | 948,960,000 | 141,004,800 |
| Size | 905.0 MB | 134.5 MB |
| Events in quadrant A | 5,700,800 | 879,038 |
| Events in quadrant B | 7,847,085 | 865,188 |
| Events in quadrant C | 5,273,030 | 885,023 |
| Events in quadrant D | 9,128,747 | 833,136 |
| Mode SS | |||
|---|---|---|---|
| Quadrant | BADHDUFLAG | Total packets | Discarded packets |
| A | 0 | 236 | 0 |
| B | 0 | 236 | 0 |
| C | 0 | 236 | 0 |
| D | 0 | 236 | 0 |
| Mode M9 | |||
|---|---|---|---|
| Quadrant | BADHDUFLAG | Total packets | Discarded packets |
| A | 0 | 8 | 0 |
| B | 0 | 8 | 0 |
| C | 0 | 8 | 0 |
| D | 0 | 8 | 0 |
| Mode M0 | |||
|---|---|---|---|
| Quadrant | BADHDUFLAG | Total packets | Discarded packets |
| A | 0 | 24662 | 3 |
| B | 0 | 30977 | 2 |
| C | 0 | 24032 | 2 |
| D | 0 | 35015 | 2 |
| Quadrant | Total seconds | Saturated seconds | Saturation percentage |
|---|---|---|---|
| A | 11683 | 210 | 1.797484% |
| B | 11683 | 684 | 5.854661% |
| C | 11683 | 136 | 1.164085% |
| D | 11683 | 1111 | 9.509544% |
Noise dominated data is calculated using 1-second bins in cleaned event files. If a bin has >2000 counts, and if more than 50% of those come from <1% of pixels, then it is considered to be noise-dominated and hence unusable.
| Quadrant | # 1 sec bins | Bins with >0 counts | Bins with >2000 counts | High rate bins dominated by noise | Noise dominated (total time) | Noise dominated (detector-on time) | Marked lightcurve |
|---|---|---|---|---|---|---|---|
| A | 12473 | 11685 | 4 | 4 | 0.03% | 0.03% | 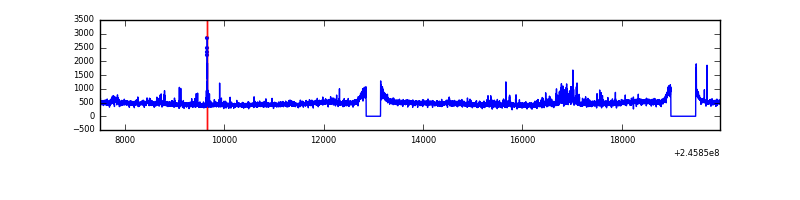 |
| B | 12473 | 11685 | 310 | 310 | 2.49% | 2.65% | 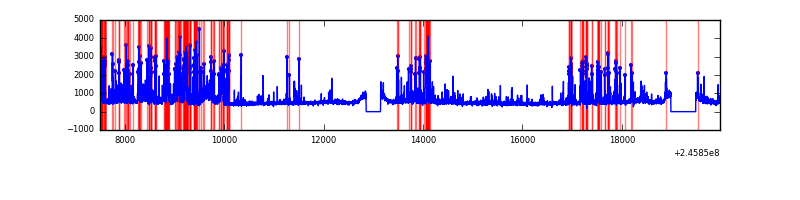 |
| C | 12473 | 11685 | 0 | 0 | 0.00% | 0.00% | 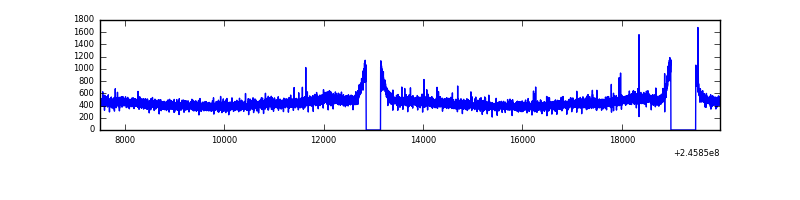 |
| D | 12473 | 11685 | 856 | 856 | 6.86% | 7.33% | 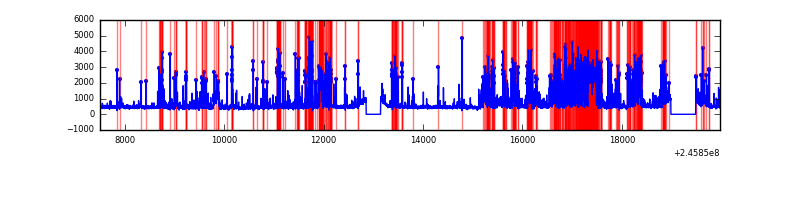 |
Top three noisy pixels from each quadrant. If the there are fewer than three noisy pixels in the level2.evt file, extra rows are filled as -1
| Pixel properties | Quadrant properties | ||||||
|---|---|---|---|---|---|---|---|
| Quadrant | DetID | PixID | Counts | Sigma | Mean | Median | Sigma |
| A | 8 | 15 | 272810 | 968.38 | 1384 | 1353 | 280.3 |
| A | 14 | 238 | 66999 | 234.18 | 1384 | 1353 | 280.3 |
| A | 11 | 29 | 27450 | 93.1 | 1384 | 1353 | 280.3 |
| B | 4 | 239 | 1078067 | 4097.65 | 1368 | 1334 | 262.8 |
| B | 10 | 16 | 995756 | 3784.41 | 1368 | 1334 | 262.8 |
| B | 15 | 204 | 153201 | 577.95 | 1368 | 1334 | 262.8 |
| C | 13 | 61 | 10011 | 27.56 | 1349 | 1356 | 314.1 |
| C | 12 | 4 | 5307 | 12.58 | 1349 | 1356 | 314.1 |
| C | 14 | 234 | 4344 | 9.51 | 1349 | 1356 | 314.1 |
| D | 10 | 253 | 1489155 | 4702.53 | 1299 | 1261 | 316.4 |
| D | 4 | 95 | 1407840 | 4445.53 | 1299 | 1261 | 316.4 |
| D | 1 | 52 | 475071 | 1497.49 | 1299 | 1261 | 316.4 |
Histogram calculated using DETX and DETY for each event in the final _common_clean file
| Quadrant A | 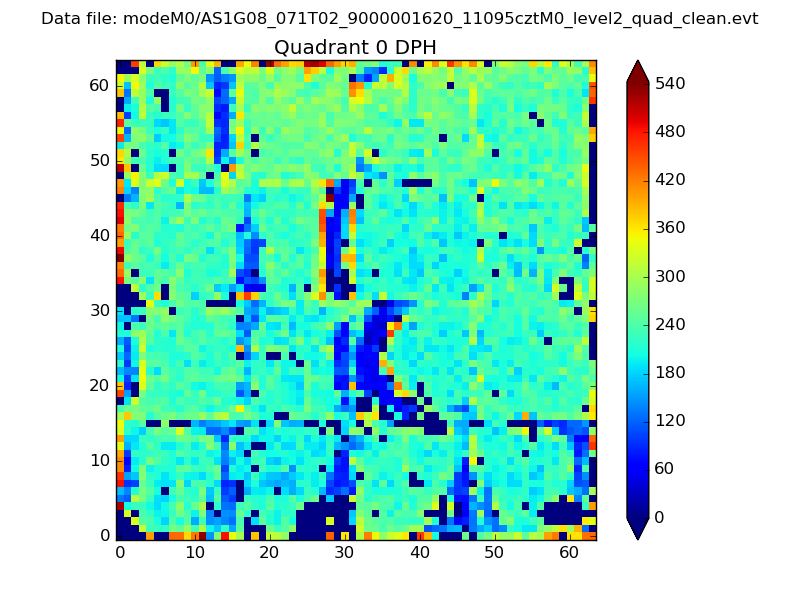 |
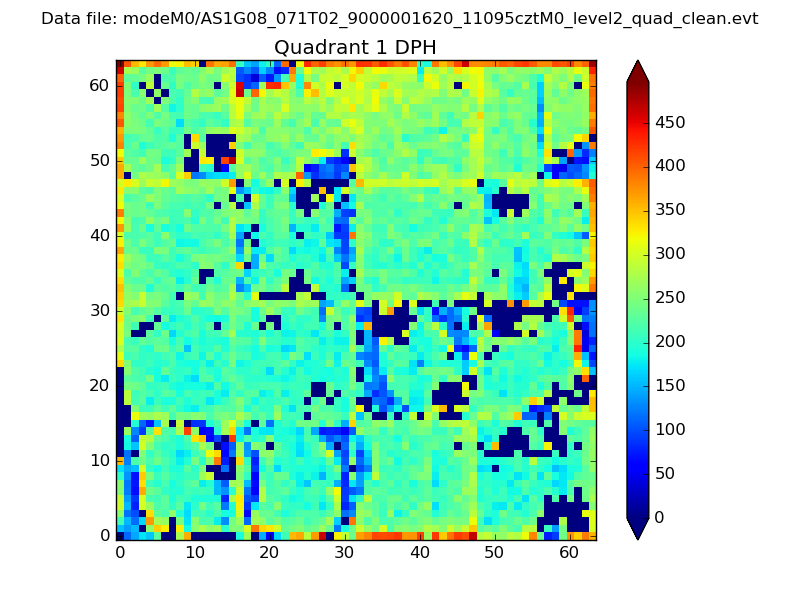 |
Quadrant B |
|---|---|---|---|
| Quadrant D | 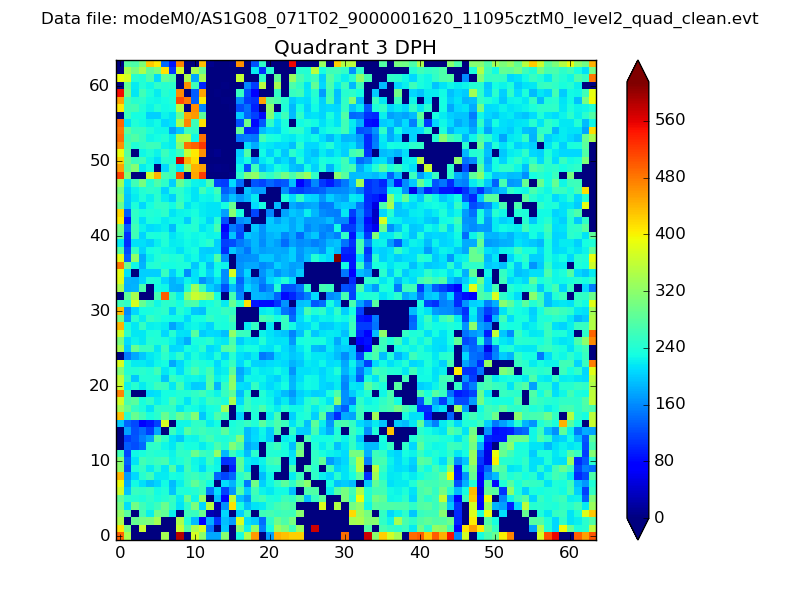 |
 |
Quadrant C |
| Plot type | Count rate plots | Images |
|---|---|---|
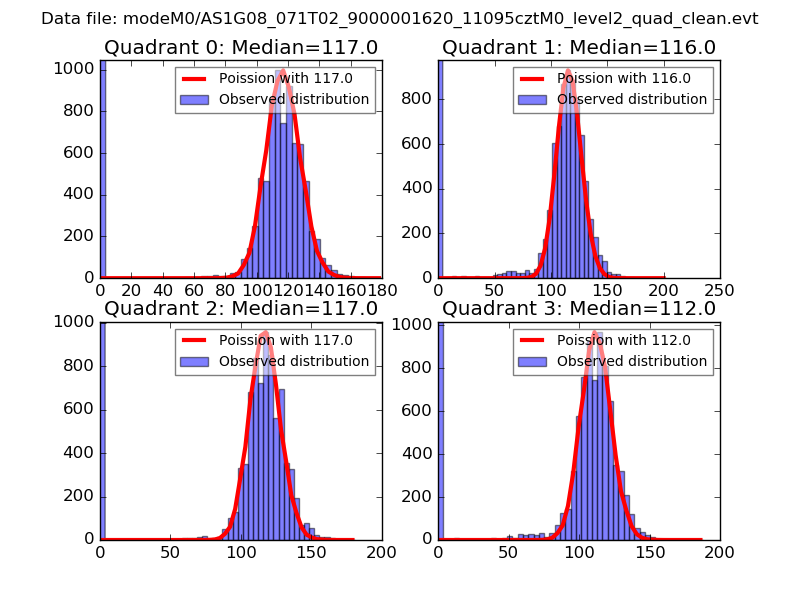
| Comparison with Poisson distribution Blue bars denote a histogram of data divided into 1 sec bins. Red curve is a Poisson curve with rate = median count rate of data. |
 |
 |
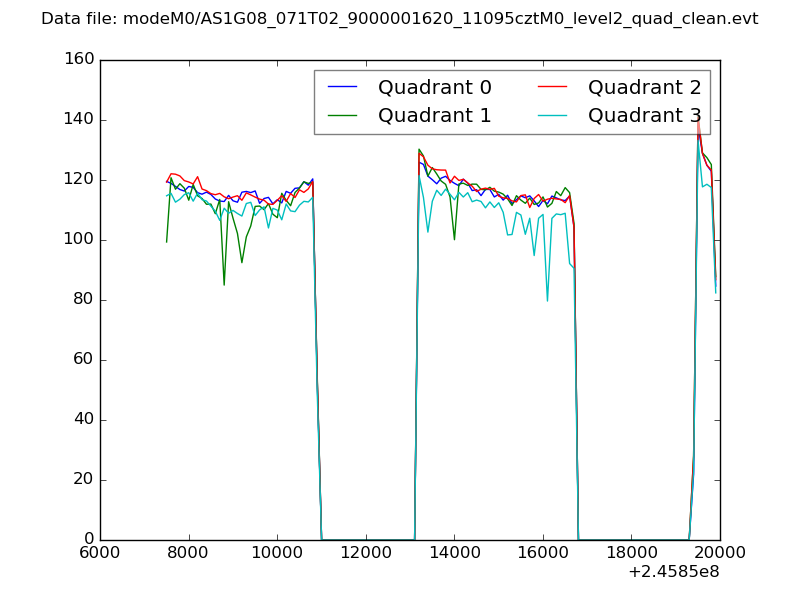
| Quadrant-wise count rates Data is divided into 100 sec bins |
 |
|
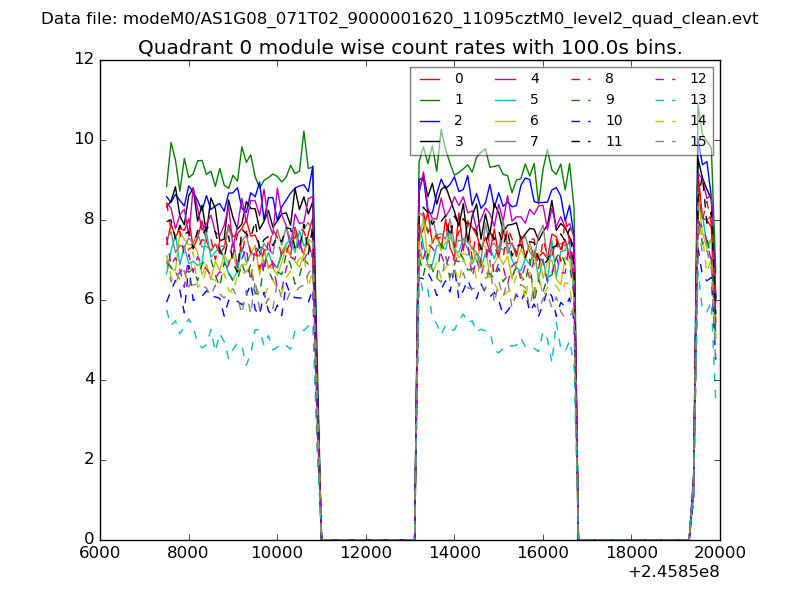
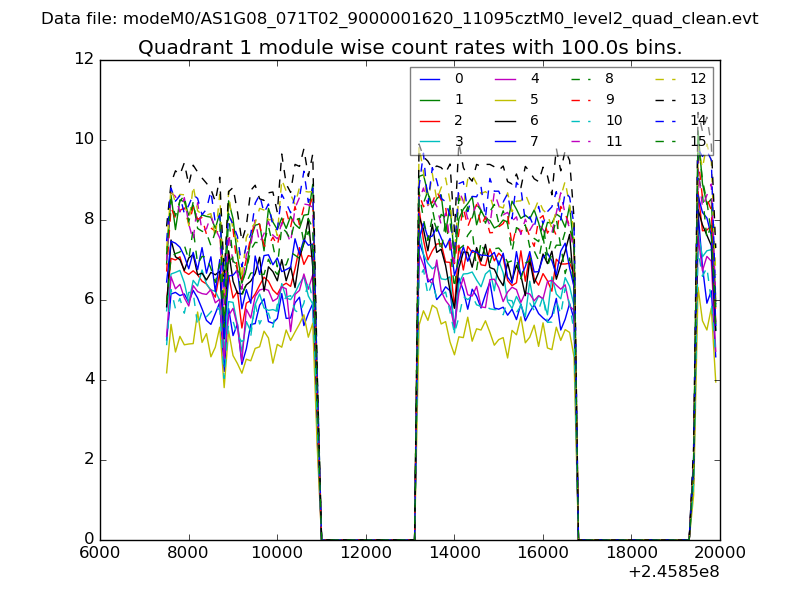
| Module-wise count rates for Quadrant A Data is divided into 100 sec bins |
 |
 |
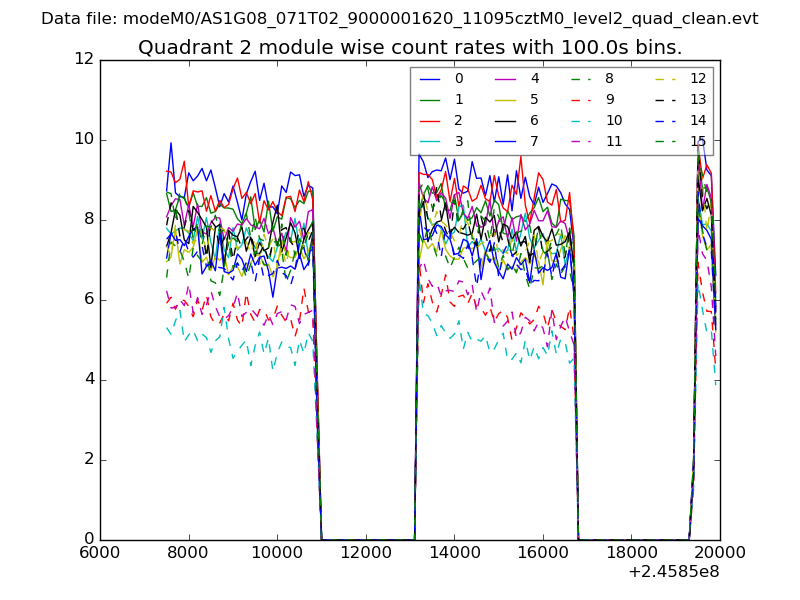
| Module-wise count rates for Quadrant B Data is divided into 100 sec bins |
 |
 |
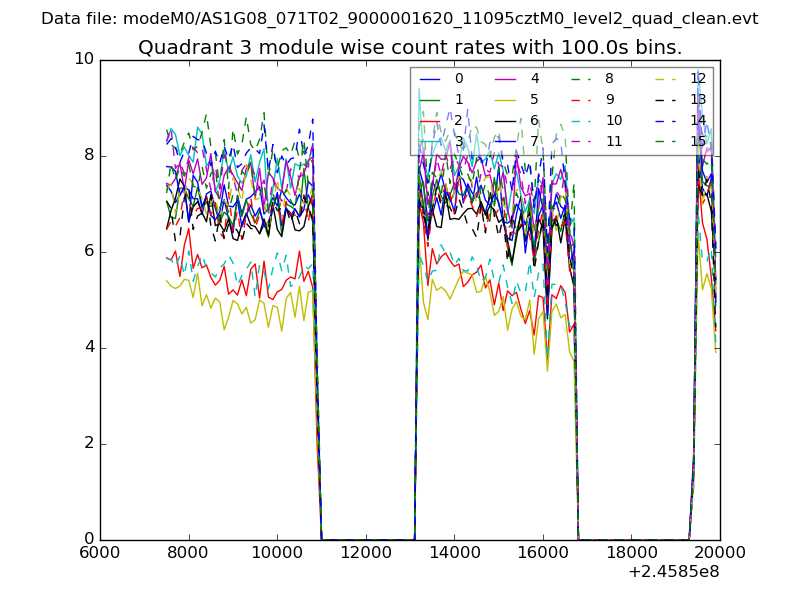
| Module-wise count rates for Quadrant C Data is divided into 100 sec bins |
 |
 |
| Module-wise count rates for Quadrant D Data is divided into 100 sec bins |
 |
 |
| Parameter | Plot |
|---|---|
| CZT HV Monitor | 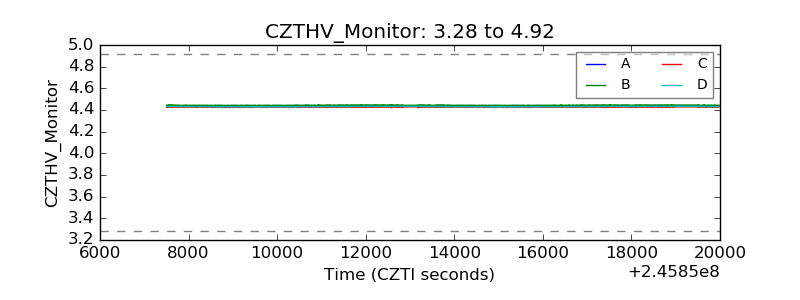 |
| D_VDD | 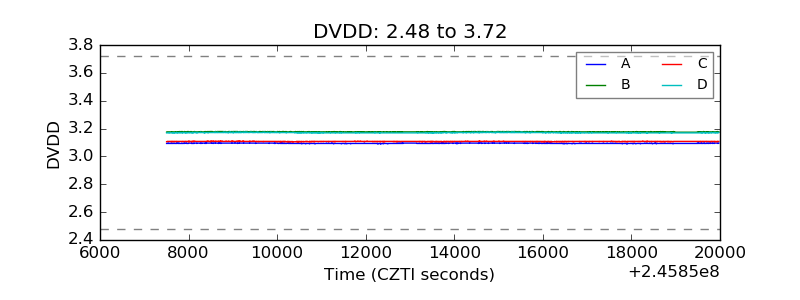 |
| Temperature 1 | 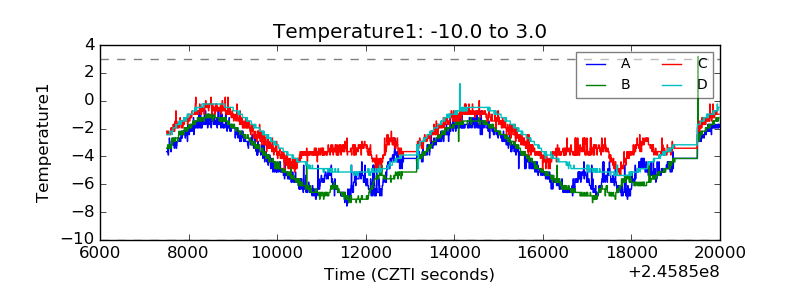 |
| Veto HV Monitor | 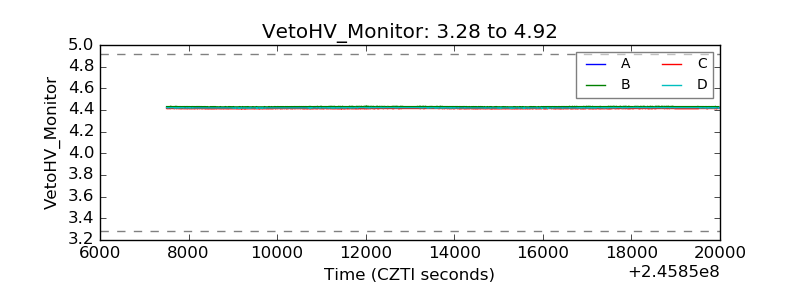 |
| Veto LLD | 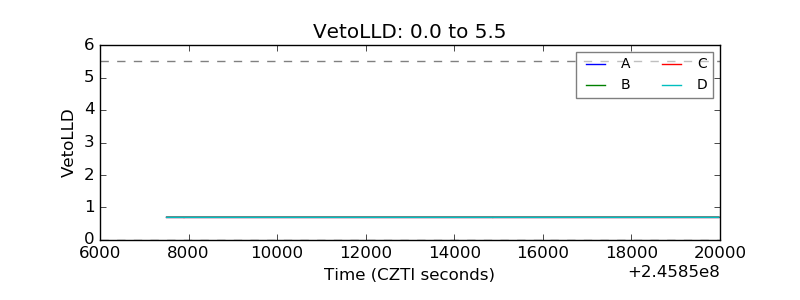 |
| Alpha Counter | 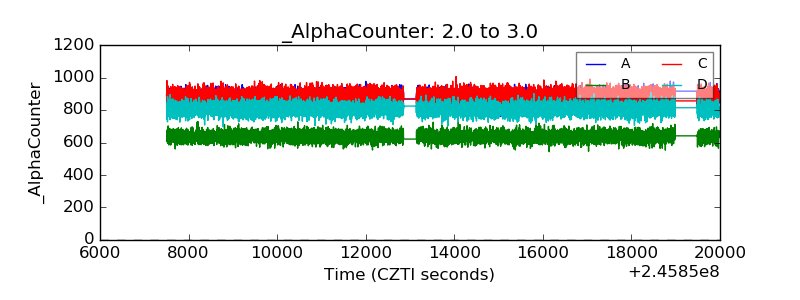 |
| _CPM_Rate | 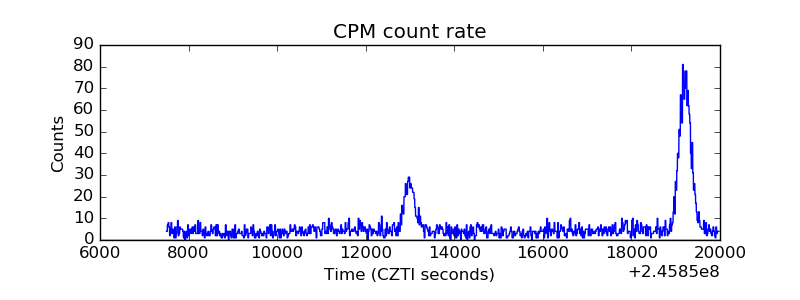 |
| CZT Counter |  |
| +2.5 Volts monitor |  |
| +5 Volts monitor |  |
| _ROLL_ROT | 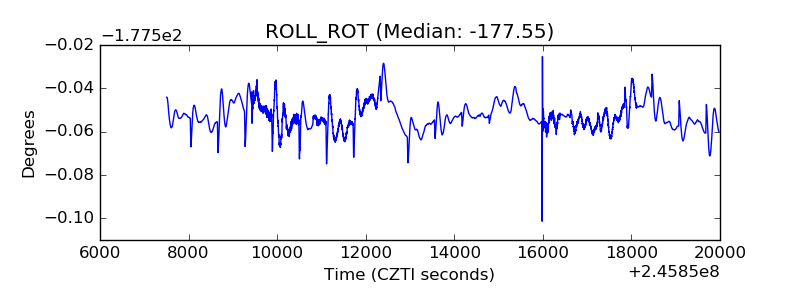 |
| _Roll_DEC | 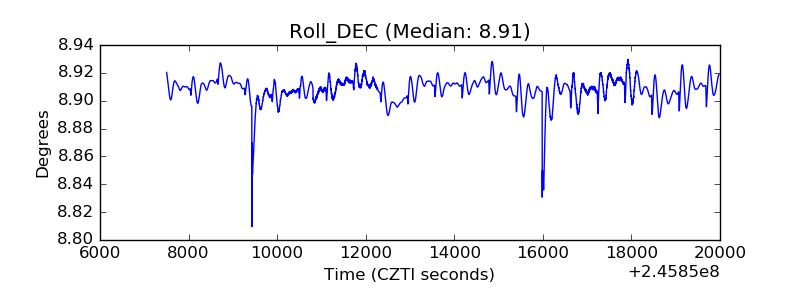 |
| _Roll_RA | 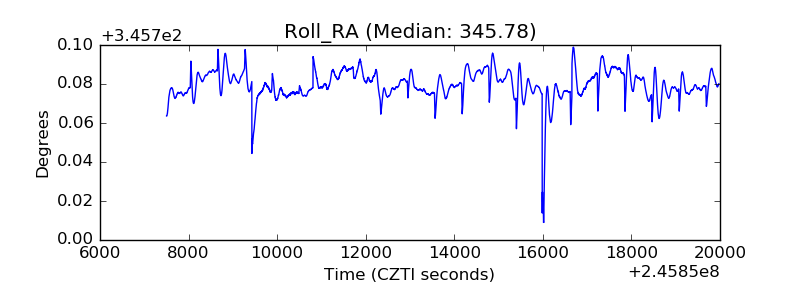 |
| Veto Counter | 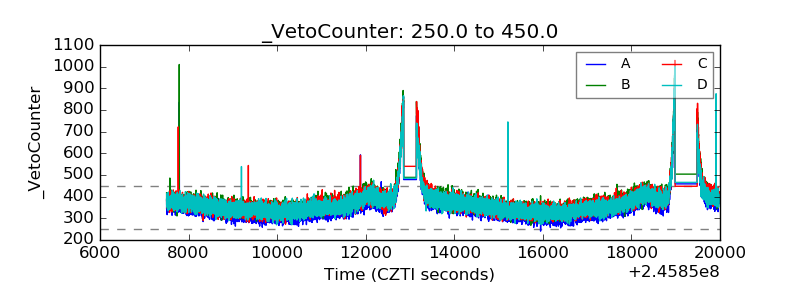 |