| Param | Original file | Final file |
|---|---|---|
| Filename | modeM0/AS1G08_071T02_9000001620_11096cztM0_level2.evt | modeM0/AS1G08_071T02_9000001620_11096cztM0_level2_quad_clean.evt |
| Size (bytes) | 996,408,000 | 152,288,640 |
| Size | 950.2 MB | 145.2 MB |
| Events in quadrant A | 5,757,406 | 959,806 |
| Events in quadrant B | 8,125,002 | 942,549 |
| Events in quadrant C | 5,548,794 | 963,334 |
| Events in quadrant D | 9,903,245 | 885,314 |
| Mode SS | |||
|---|---|---|---|
| Quadrant | BADHDUFLAG | Total packets | Discarded packets |
| A | 0 | 252 | 0 |
| B | 0 | 252 | 0 |
| C | 0 | 252 | 0 |
| D | 0 | 252 | 0 |
| Mode M9 | |||
|---|---|---|---|
| Quadrant | BADHDUFLAG | Total packets | Discarded packets |
| A | 0 | 17 | 0 |
| B | 0 | 17 | 0 |
| C | 0 | 17 | 0 |
| D | 0 | 17 | 0 |
| Mode M0 | |||
|---|---|---|---|
| Quadrant | BADHDUFLAG | Total packets | Discarded packets |
| A | 0 | 25578 | 4 |
| B | 0 | 32307 | 3 |
| C | 0 | 25338 | 3 |
| D | 0 | 37979 | 3 |
| Quadrant | Total seconds | Saturated seconds | Saturation percentage |
|---|---|---|---|
| A | 12455 | 84 | 0.674428% |
| B | 12455 | 614 | 4.929747% |
| C | 12455 | 33 | 0.264954% |
| D | 12456 | 1269 | 10.187861% |
Noise dominated data is calculated using 1-second bins in cleaned event files. If a bin has >2000 counts, and if more than 50% of those come from <1% of pixels, then it is considered to be noise-dominated and hence unusable.
| Quadrant | # 1 sec bins | Bins with >0 counts | Bins with >2000 counts | High rate bins dominated by noise | Noise dominated (total time) | Noise dominated (detector-on time) | Marked lightcurve |
|---|---|---|---|---|---|---|---|
| A | 14085 | 12457 | 0 | 0 | 0.00% | 0.00% | 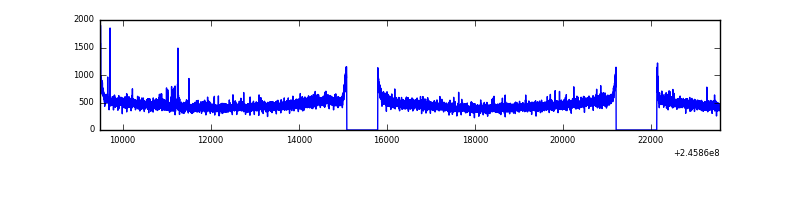 |
| B | 14085 | 12457 | 349 | 349 | 2.48% | 2.80% | 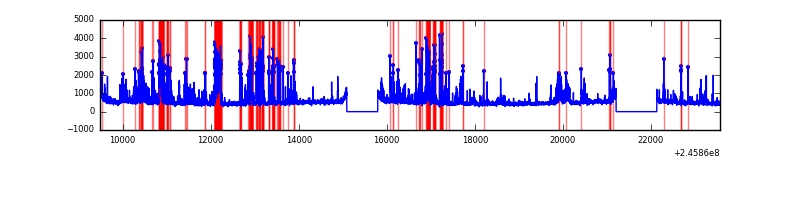 |
| C | 14085 | 12457 | 0 | 0 | 0.00% | 0.00% | 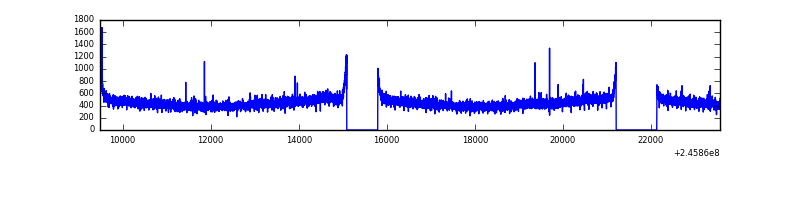 |
| D | 14086 | 12456 | 957 | 957 | 6.79% | 7.68% | 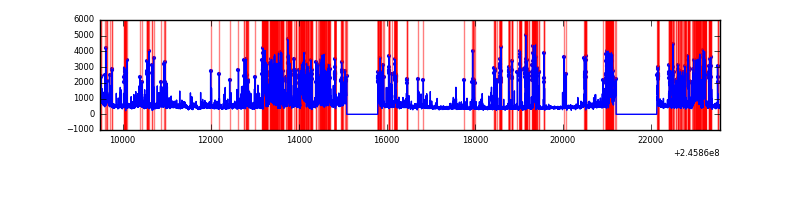 |
Top three noisy pixels from each quadrant. If the there are fewer than three noisy pixels in the level2.evt file, extra rows are filled as -1
| Pixel properties | Quadrant properties | ||||||
|---|---|---|---|---|---|---|---|
| Quadrant | DetID | PixID | Counts | Sigma | Mean | Median | Sigma |
| A | 8 | 15 | 73737 | 243.21 | 1461 | 1429 | 297.3 |
| A | 1 | 162 | 15995 | 48.99 | 1461 | 1429 | 297.3 |
| A | 14 | 238 | 15785 | 48.29 | 1461 | 1429 | 297.3 |
| B | 10 | 16 | 1117934 | 4039.92 | 1441 | 1403 | 276.4 |
| B | 4 | 239 | 937442 | 3386.85 | 1441 | 1403 | 276.4 |
| B | 15 | 204 | 208226 | 748.34 | 1441 | 1403 | 276.4 |
| C | 13 | 61 | 10471 | 27.32 | 1421 | 1429 | 331.0 |
| C | 8 | 222 | 4757 | 10.05 | 1421 | 1429 | 331.0 |
| C | 14 | 234 | 4272 | 8.59 | 1421 | 1429 | 331.0 |
| D | 4 | 95 | 1670865 | 5082.79 | 1356 | 1315 | 328.5 |
| D | 10 | 253 | 1432450 | 4356.96 | 1356 | 1315 | 328.5 |
| D | 1 | 52 | 906479 | 2755.69 | 1356 | 1315 | 328.5 |
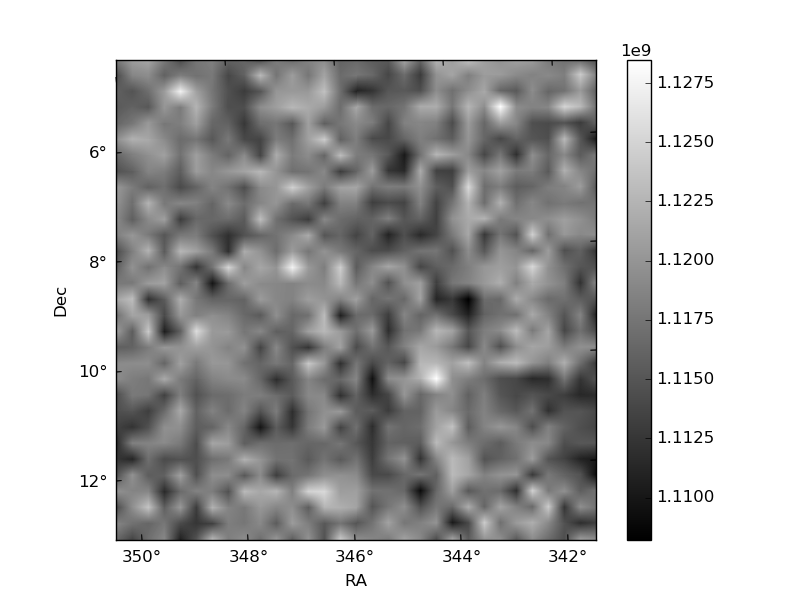
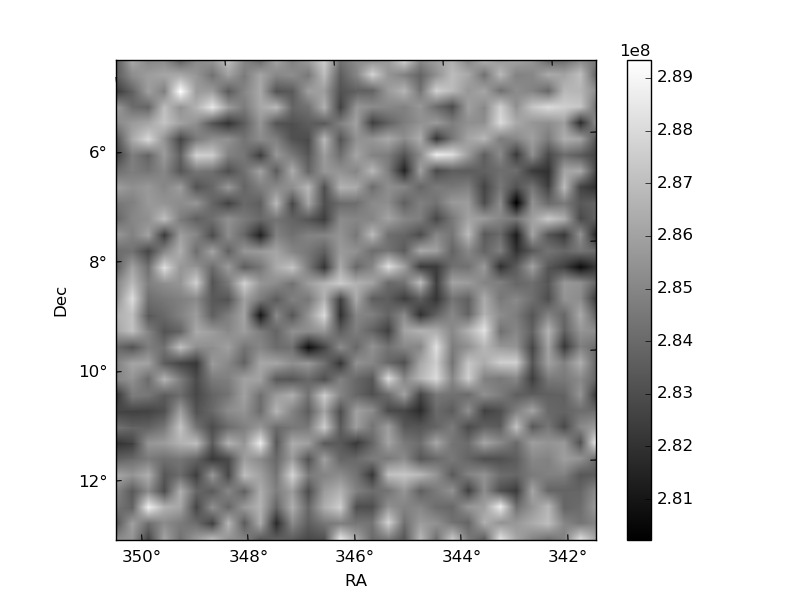
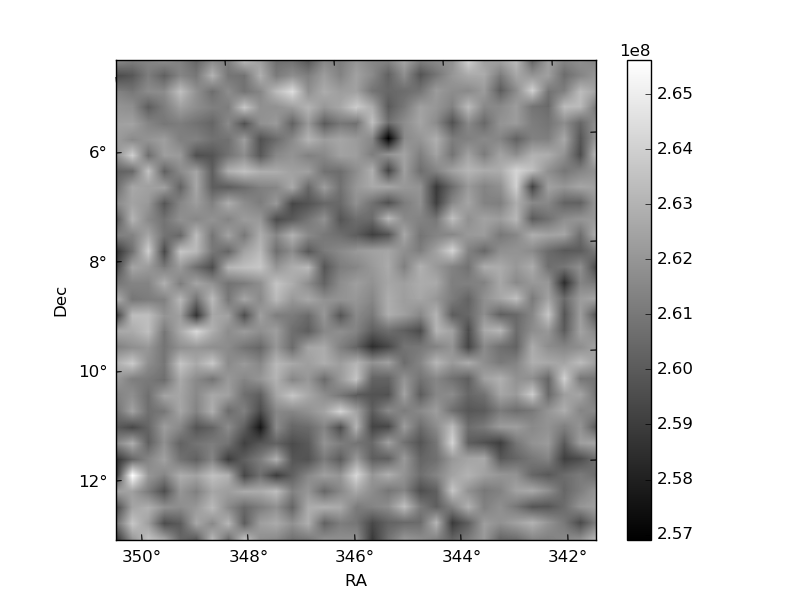
Histogram calculated using DETX and DETY for each event in the final _common_clean file
| Quadrant A | 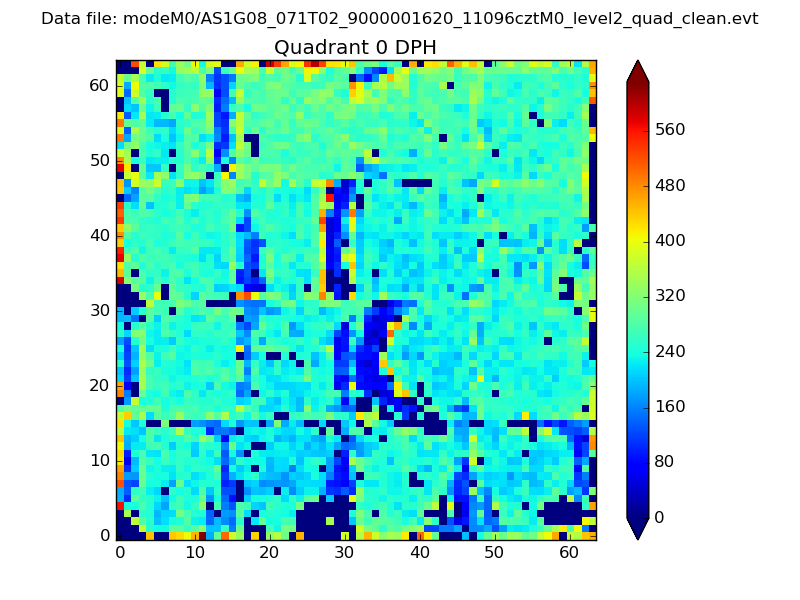 |
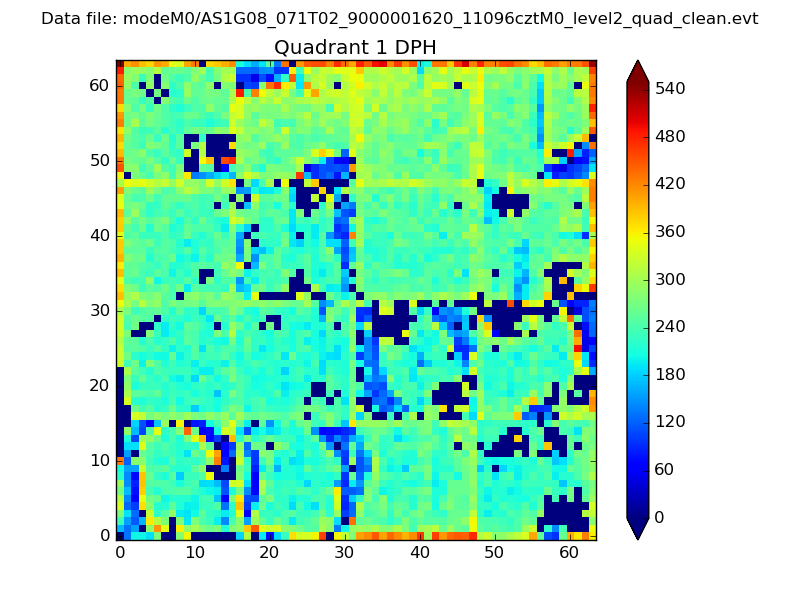 |
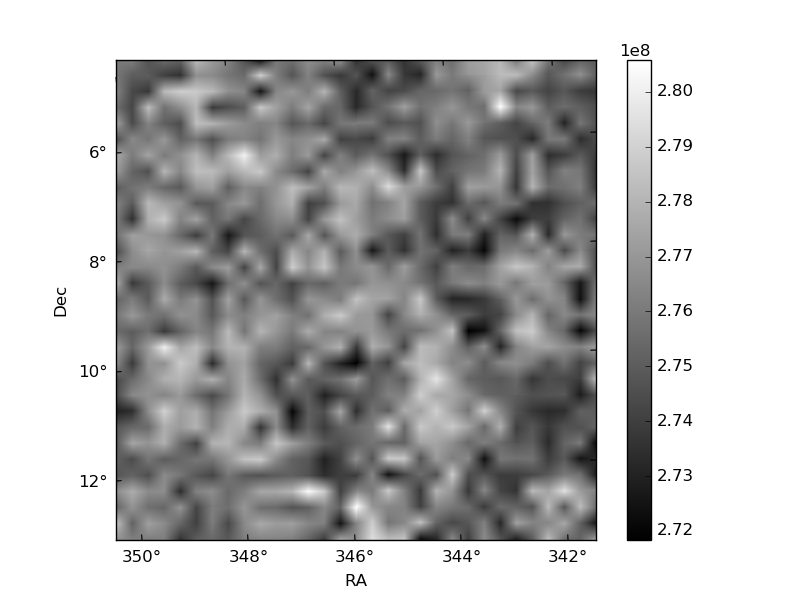
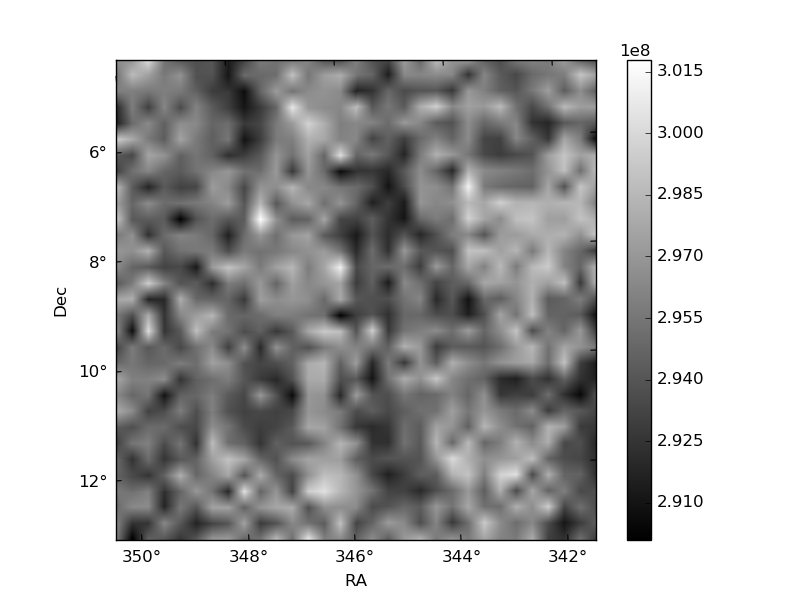
Quadrant B |
|---|---|---|---|
| Quadrant D | 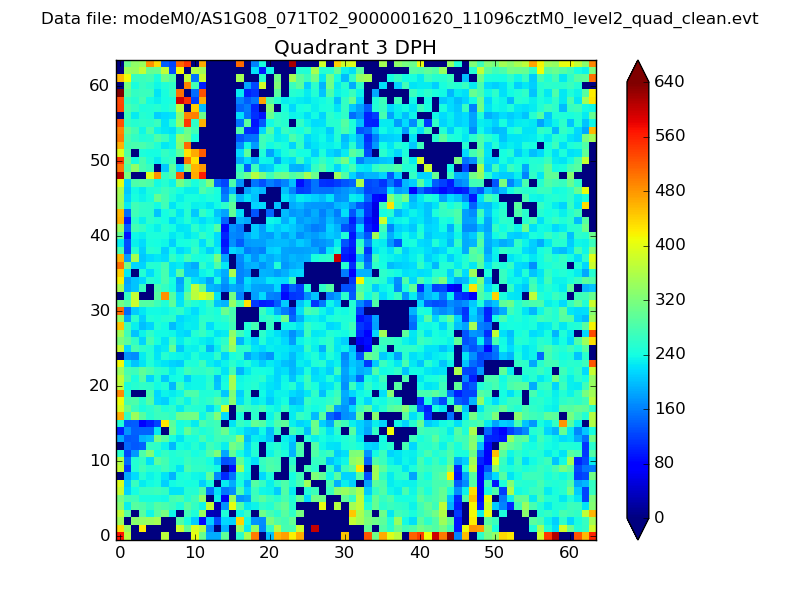 |
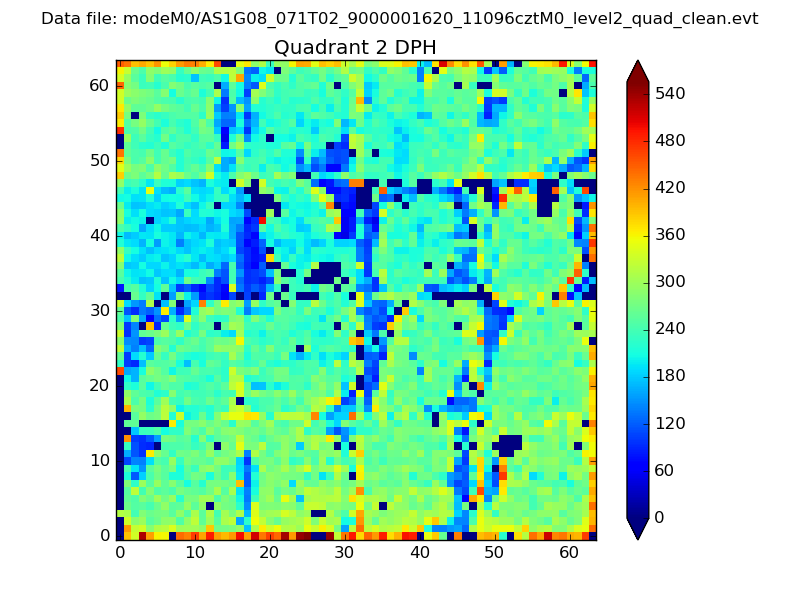 |
Quadrant C |
| Plot type | Count rate plots | Images |
|---|---|---|
| Comparison with Poisson distribution Blue bars denote a histogram of data divided into 1 sec bins. Red curve is a Poisson curve with rate = median count rate of data. |
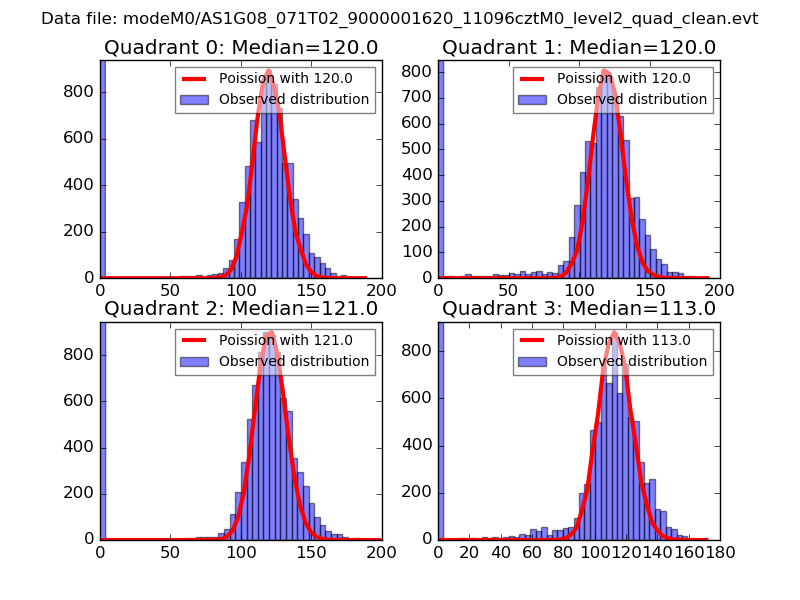 |
 |
| Quadrant-wise count rates Data is divided into 100 sec bins |
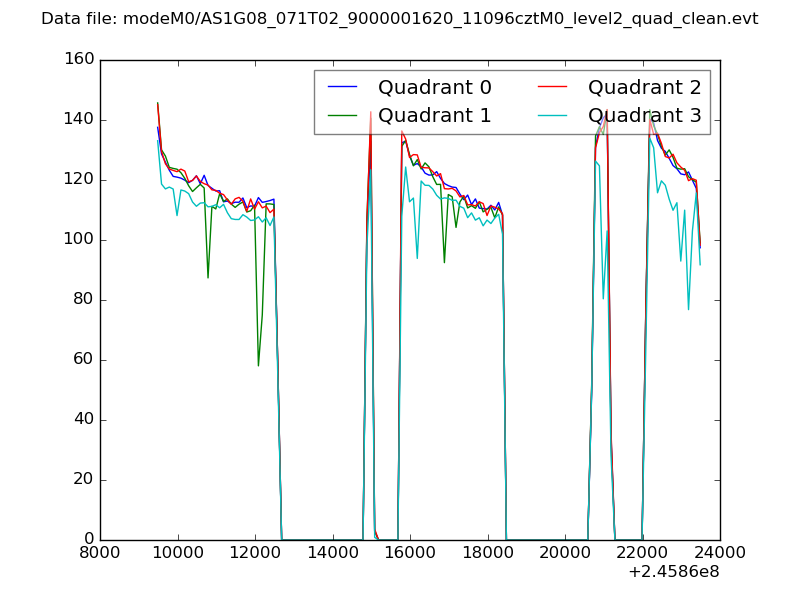 |
|
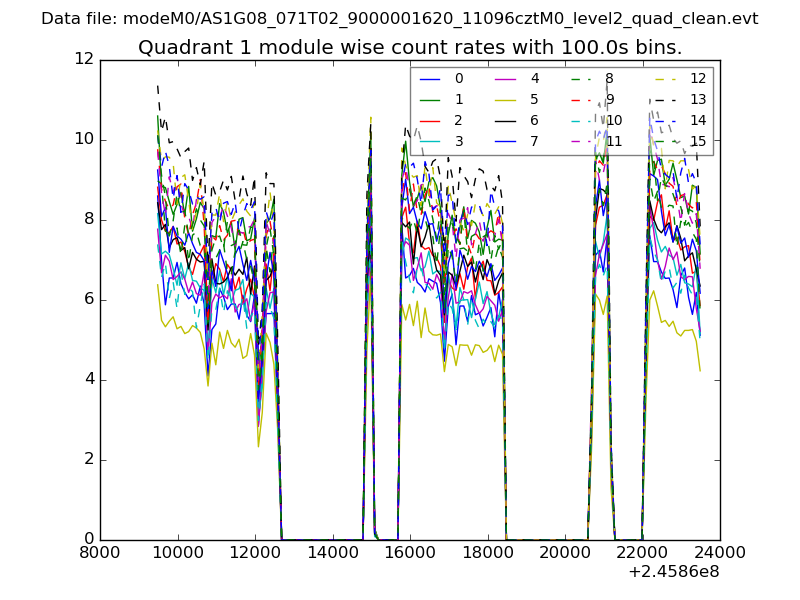
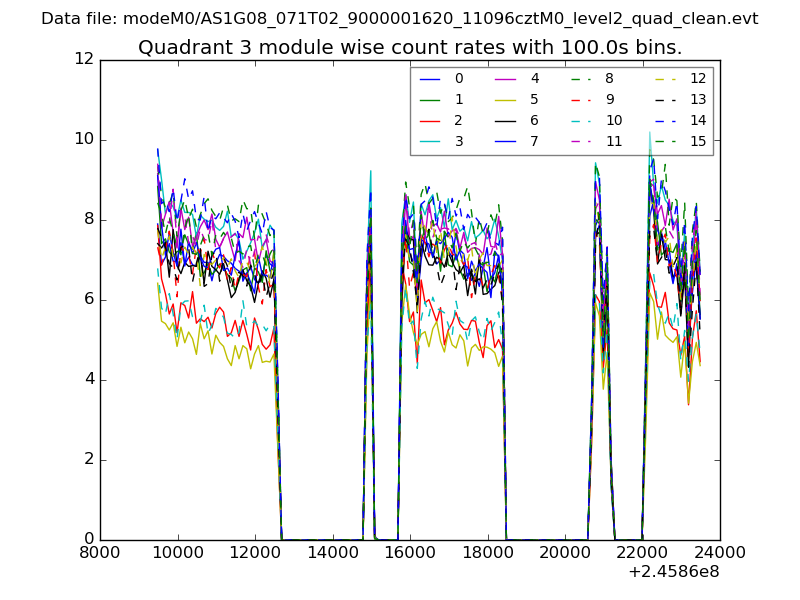
| Module-wise count rates for Quadrant A Data is divided into 100 sec bins |
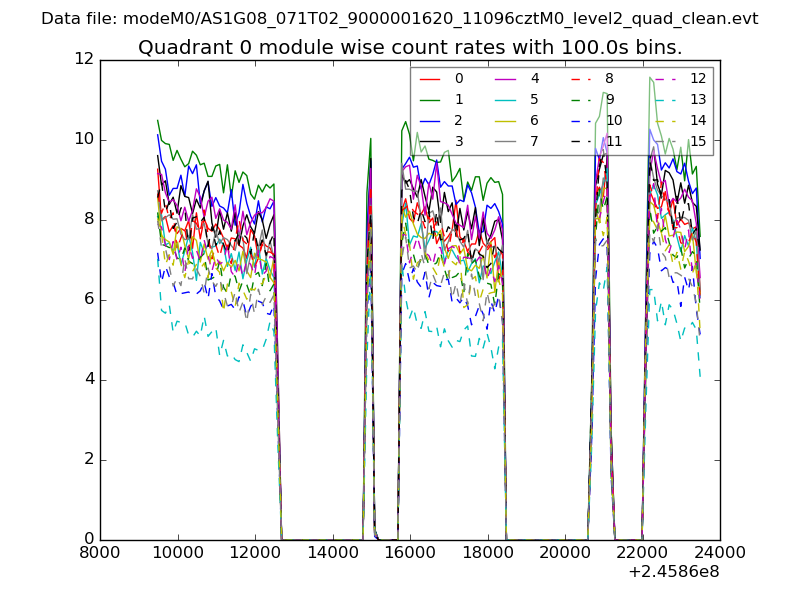 |
 |
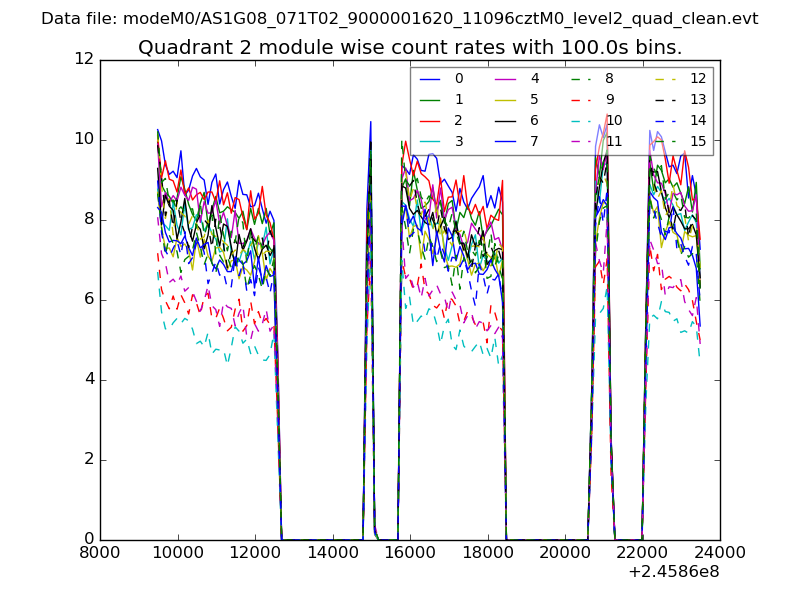
| Module-wise count rates for Quadrant B Data is divided into 100 sec bins |
 |
 |
| Module-wise count rates for Quadrant C Data is divided into 100 sec bins |
 |
 |
| Module-wise count rates for Quadrant D Data is divided into 100 sec bins |
 |
 |
| Parameter | Plot |
|---|---|
| CZT HV Monitor | 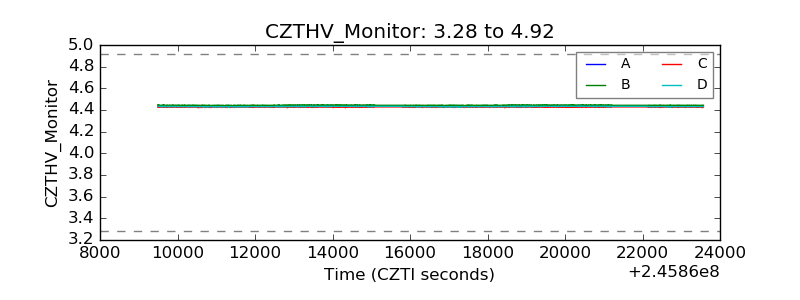 |
| D_VDD | 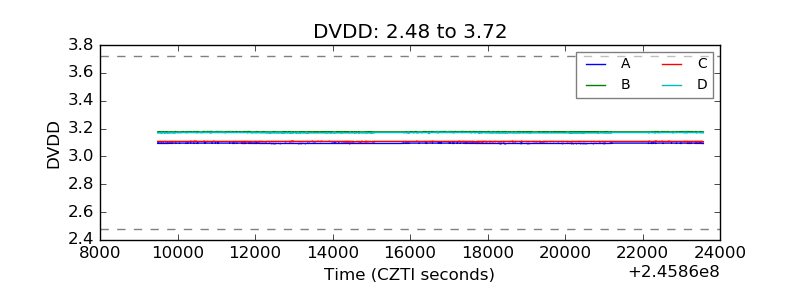 |
| Temperature 1 | 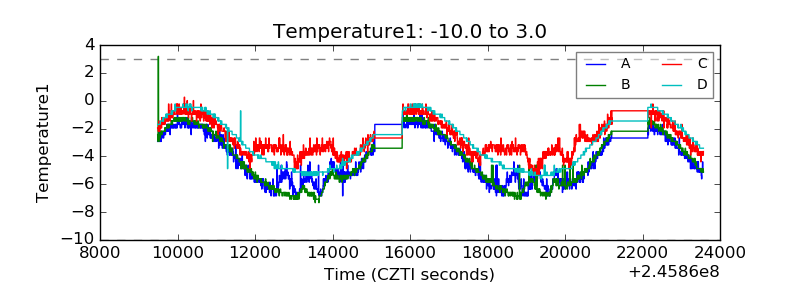 |
| Veto HV Monitor | 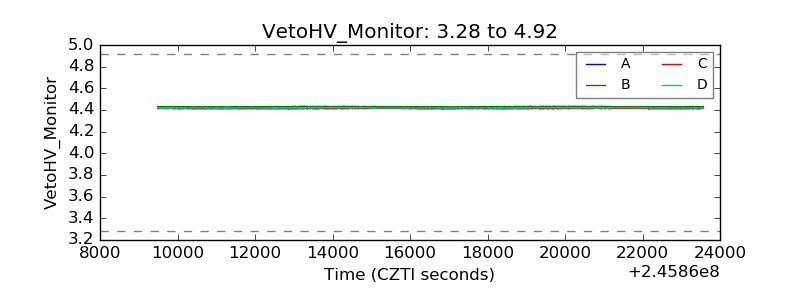 |
| Veto LLD | 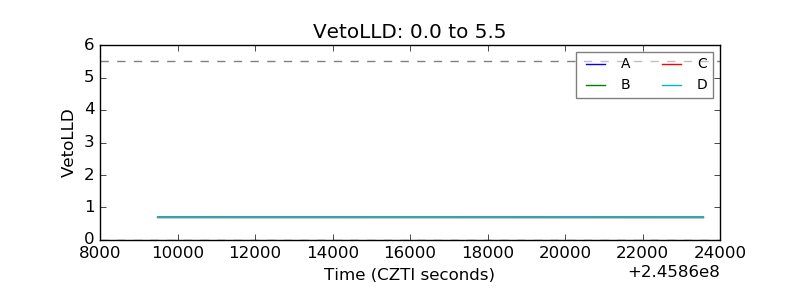 |
| Alpha Counter | 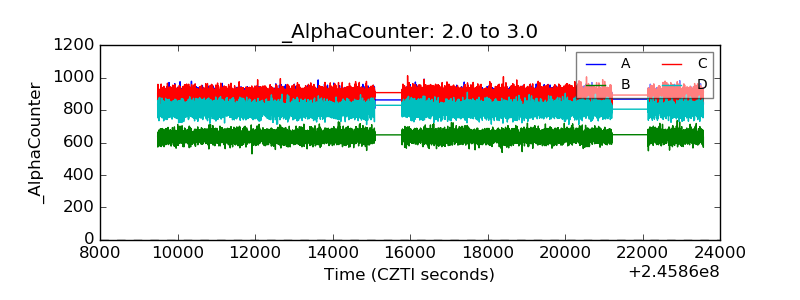 |
| _CPM_Rate | 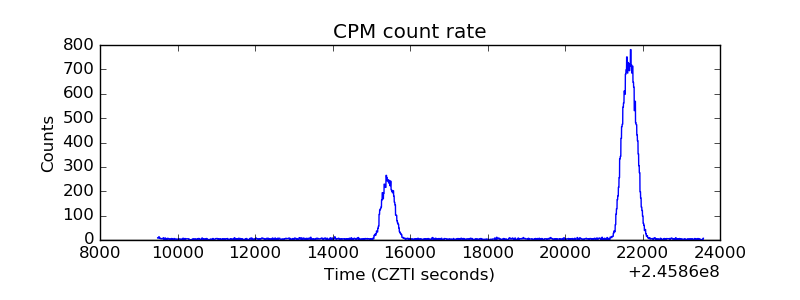 |
| CZT Counter | 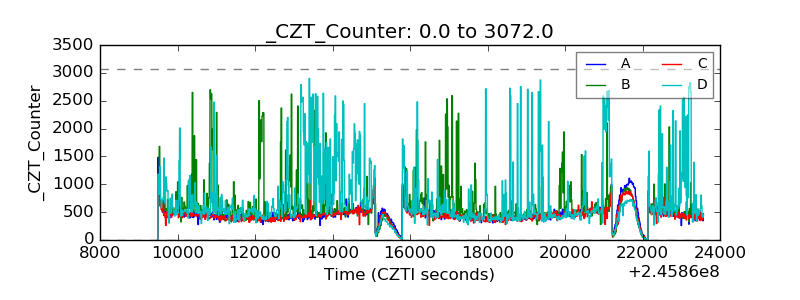 |
| +2.5 Volts monitor |  |
| +5 Volts monitor | 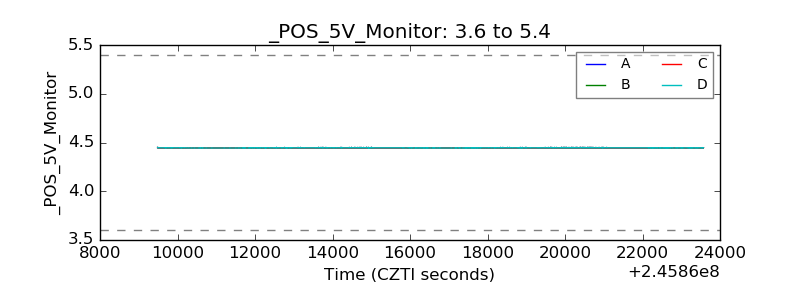 |
| _ROLL_ROT | 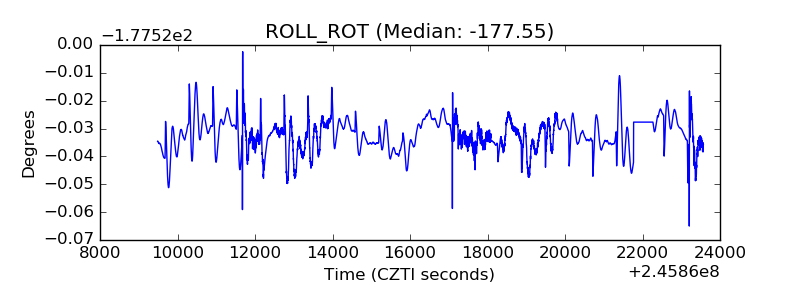 |
| _Roll_DEC | 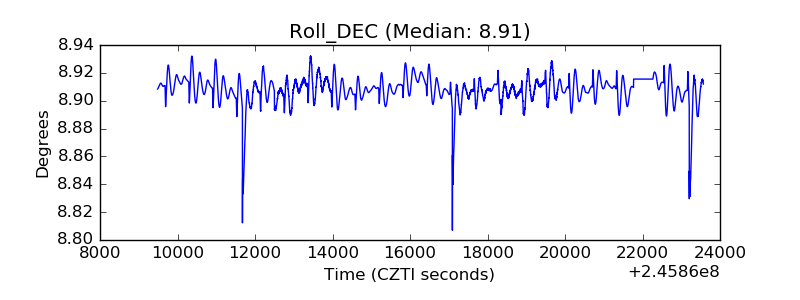 |
| _Roll_RA | 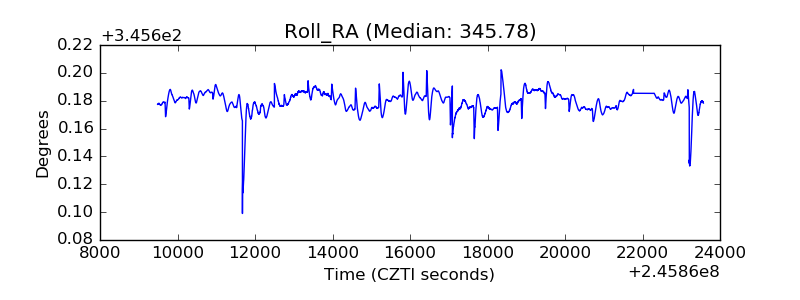 |
| Veto Counter | 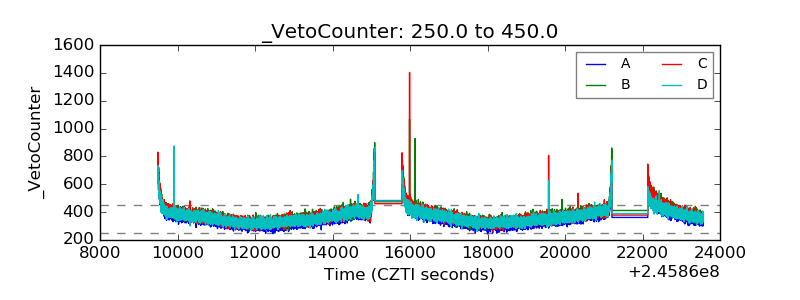 |