| Param | Original file | Final file |
|---|---|---|
| Filename | modeM0/AS1G08_071T02_9000001620_11101cztM0_level2.evt | modeM0/AS1G08_071T02_9000001620_11101cztM0_level2_quad_clean.evt |
| Size (bytes) | 578,105,280 | 73,224,000 |
| Size | 551.3 MB | 69.8 MB |
| Events in quadrant A | 3,312,584 | 457,427 |
| Events in quadrant B | 3,476,012 | 469,255 |
| Events in quadrant C | 3,188,618 | 453,269 |
| Events in quadrant D | 7,099,958 | 393,231 |
| Mode SS | |||
|---|---|---|---|
| Quadrant | BADHDUFLAG | Total packets | Discarded packets |
| A | 0 | 128 | 0 |
| B | 0 | 128 | 0 |
| C | 0 | 128 | 0 |
| D | 0 | 128 | 0 |
| Mode M9 | |||
|---|---|---|---|
| Quadrant | BADHDUFLAG | Total packets | Discarded packets |
| A | 0 | 19 | 0 |
| B | 0 | 19 | 0 |
| C | 0 | 19 | 0 |
| D | 0 | 20 | 0 |
| Mode M0 | |||
|---|---|---|---|
| Quadrant | BADHDUFLAG | Total packets | Discarded packets |
| A | 0 | 13732 | 3 |
| B | 0 | 14202 | 2 |
| C | 0 | 13435 | 2 |
| D | 0 | 25548 | 2 |
| Quadrant | Total seconds | Saturated seconds | Saturation percentage |
|---|---|---|---|
| A | 6365 | 8 | 0.125687% |
| B | 6365 | 37 | 0.581304% |
| C | 6365 | 61 | 0.958366% |
| D | 6365 | 952 | 14.956795% |
Noise dominated data is calculated using 1-second bins in cleaned event files. If a bin has >2000 counts, and if more than 50% of those come from <1% of pixels, then it is considered to be noise-dominated and hence unusable.
| Quadrant | # 1 sec bins | Bins with >0 counts | Bins with >2000 counts | High rate bins dominated by noise | Noise dominated (total time) | Noise dominated (detector-on time) | Marked lightcurve |
|---|---|---|---|---|---|---|---|
| A | 7710 | 6366 | 0 | 0 | 0.00% | 0.00% | 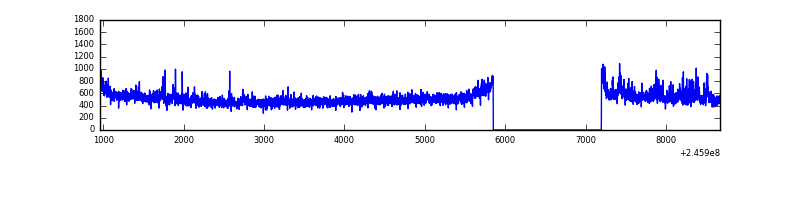 |
| B | 7710 | 6366 | 11 | 11 | 0.14% | 0.17% | 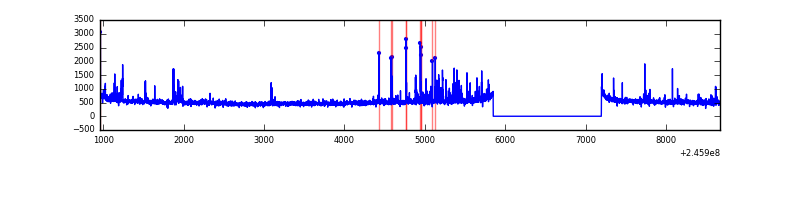 |
| C | 7710 | 6366 | 40 | 40 | 0.52% | 0.63% | 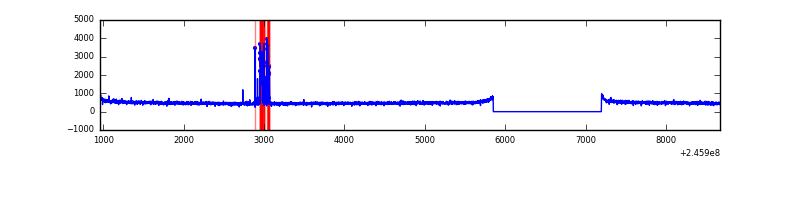 |
| D | 7710 | 6366 | 796 | 796 | 10.32% | 12.50% | 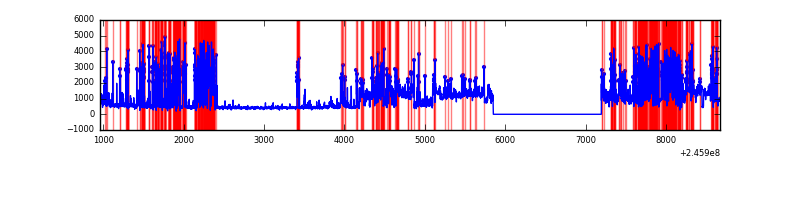 |
Top three noisy pixels from each quadrant. If the there are fewer than three noisy pixels in the level2.evt file, extra rows are filled as -1
| Pixel properties | Quadrant properties | ||||||
|---|---|---|---|---|---|---|---|
| Quadrant | DetID | PixID | Counts | Sigma | Mean | Median | Sigma |
| A | 8 | 15 | 183318 | 1124.83 | 805 | 790 | 162.3 |
| A | 11 | 29 | 28632 | 171.58 | 805 | 790 | 162.3 |
| A | 0 | 226 | 7478 | 41.21 | 805 | 790 | 162.3 |
| B | 4 | 239 | 188516 | 1227.6 | 816 | 799 | 152.9 |
| B | 10 | 16 | 26637 | 168.97 | 816 | 799 | 152.9 |
| B | 0 | 187 | 25188 | 159.5 | 816 | 799 | 152.9 |
| C | 9 | 54 | 150044 | 822.7 | 779 | 786 | 181.4 |
| C | 13 | 61 | 5782 | 27.54 | 779 | 786 | 181.4 |
| C | 5 | 207 | 2215 | 7.88 | 779 | 786 | 181.4 |
| D | 10 | 253 | 2124248 | 12436.44 | 710 | 692 | 170.8 |
| D | 1 | 52 | 1971912 | 11544.3 | 710 | 692 | 170.8 |
| D | 13 | 152 | 82723 | 480.41 | 710 | 692 | 170.8 |
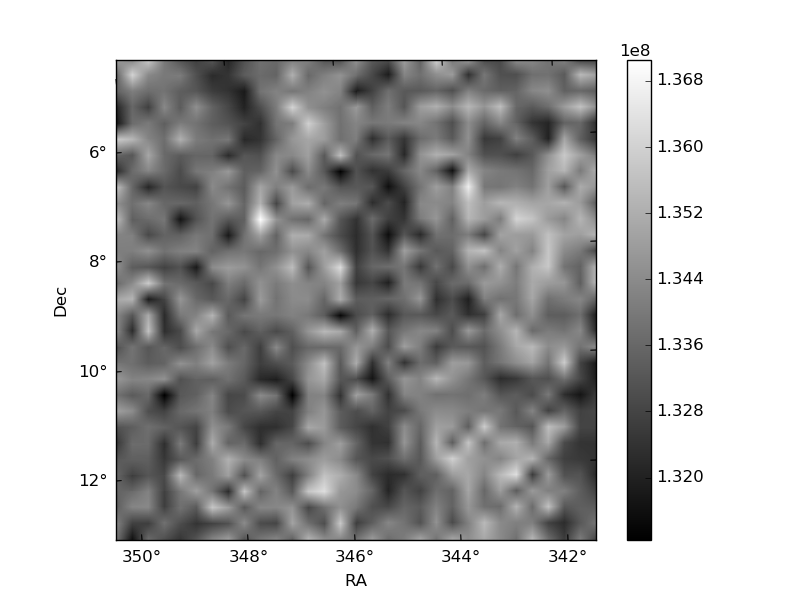
Histogram calculated using DETX and DETY for each event in the final _common_clean file
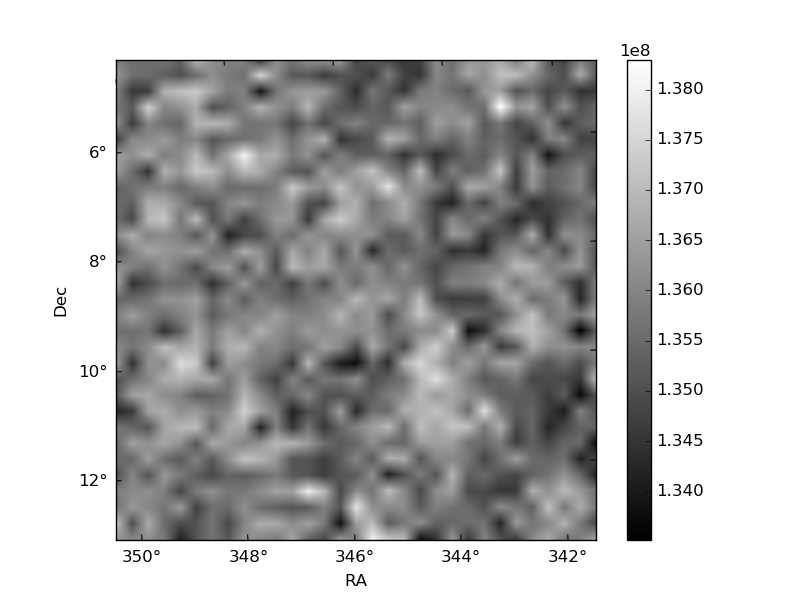
| Quadrant A | 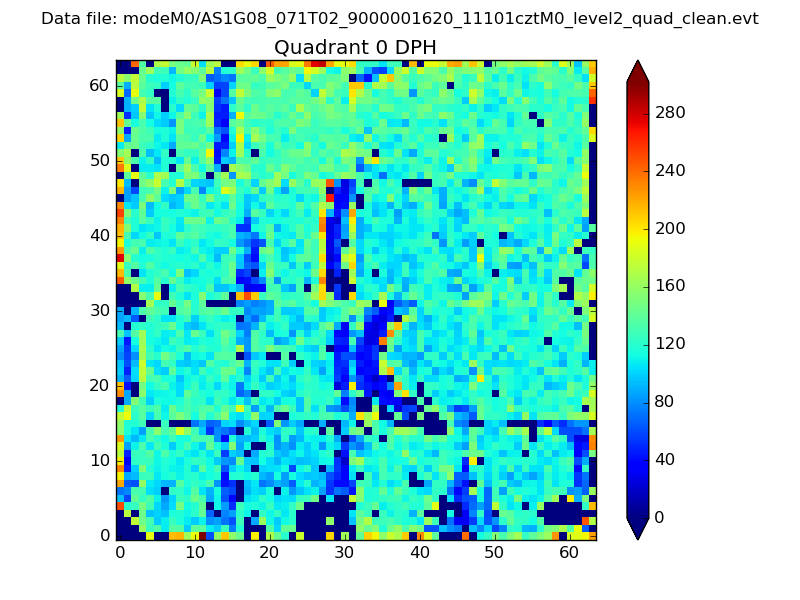 |
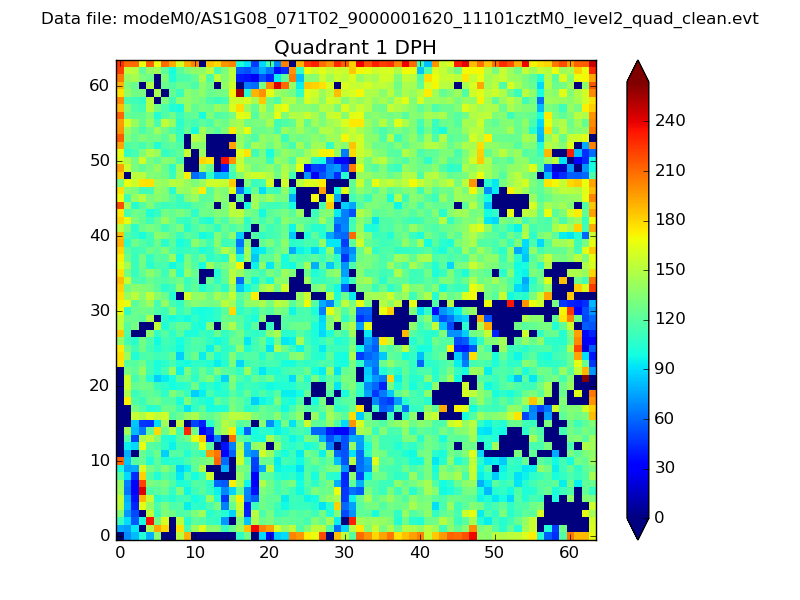 |
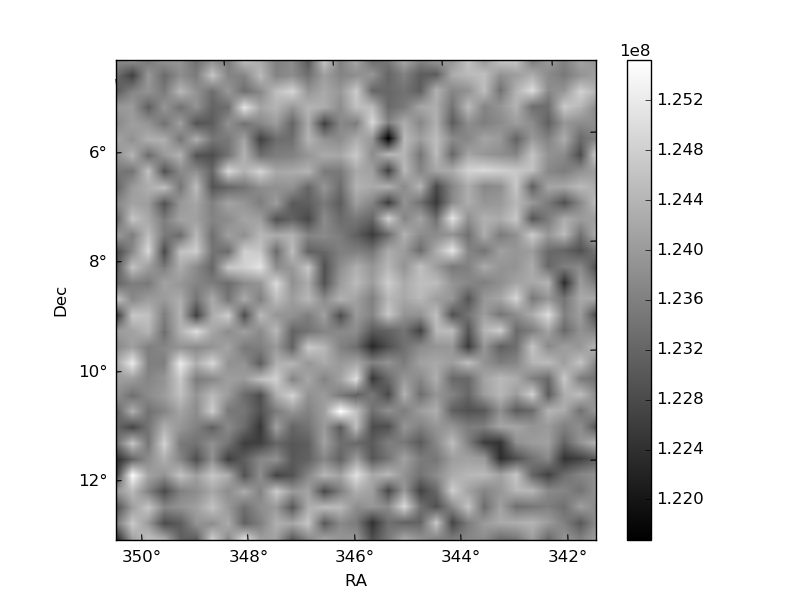
Quadrant B |
|---|---|---|---|
| Quadrant D | 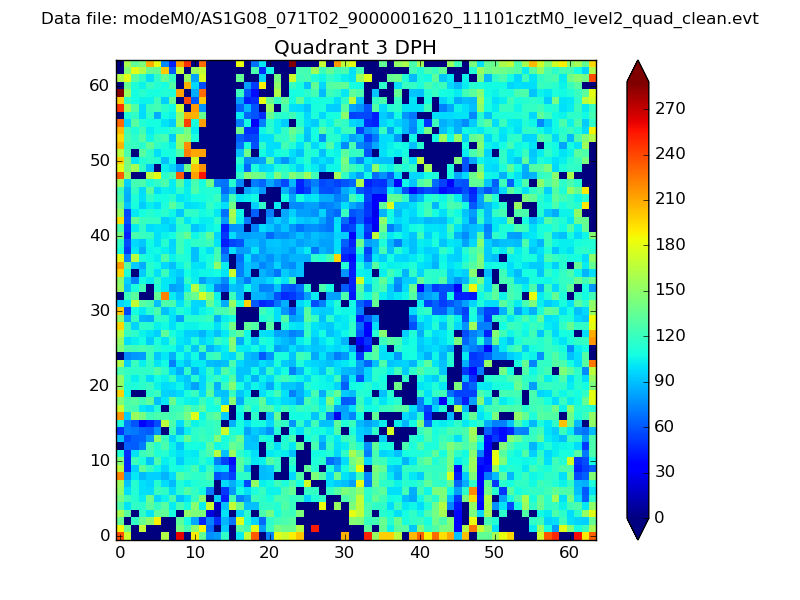 |
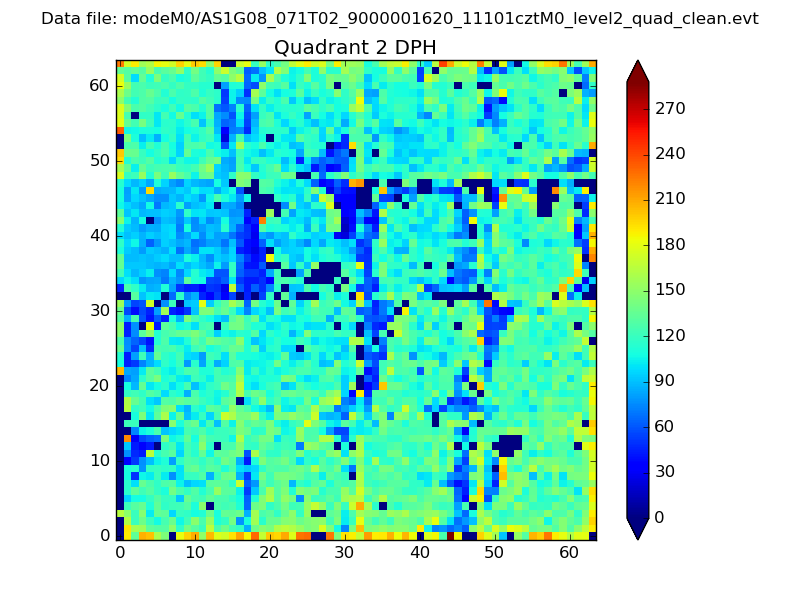 |
Quadrant C |
| Plot type | Count rate plots | Images |
|---|---|---|
| Comparison with Poisson distribution Blue bars denote a histogram of data divided into 1 sec bins. Red curve is a Poisson curve with rate = median count rate of data. |
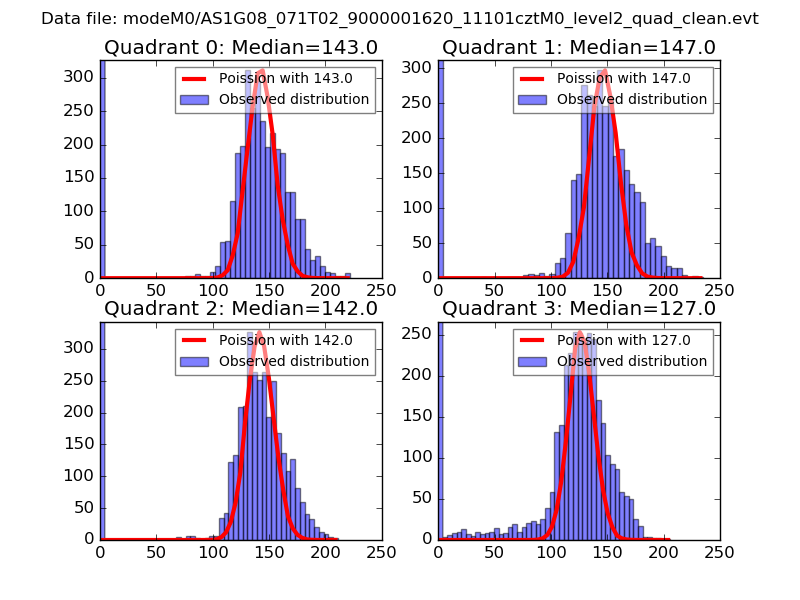 |
 |
| Quadrant-wise count rates Data is divided into 100 sec bins |
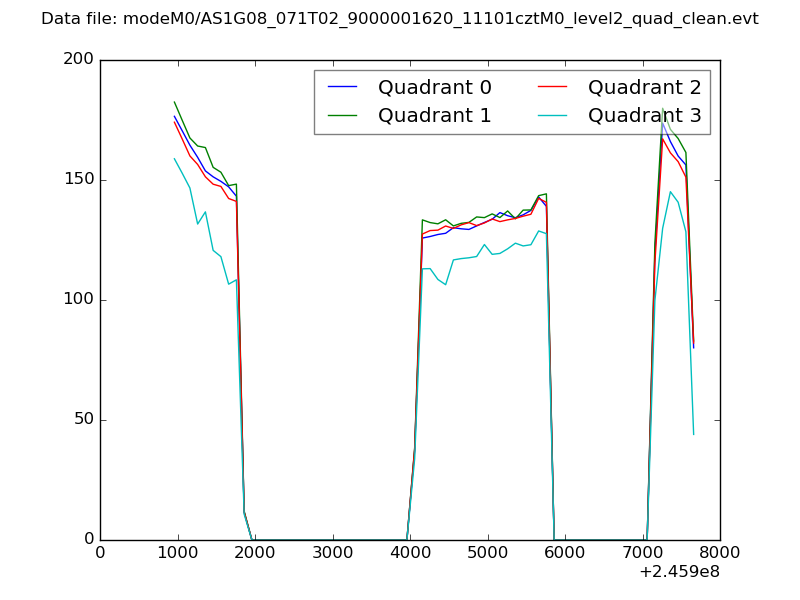 |
|
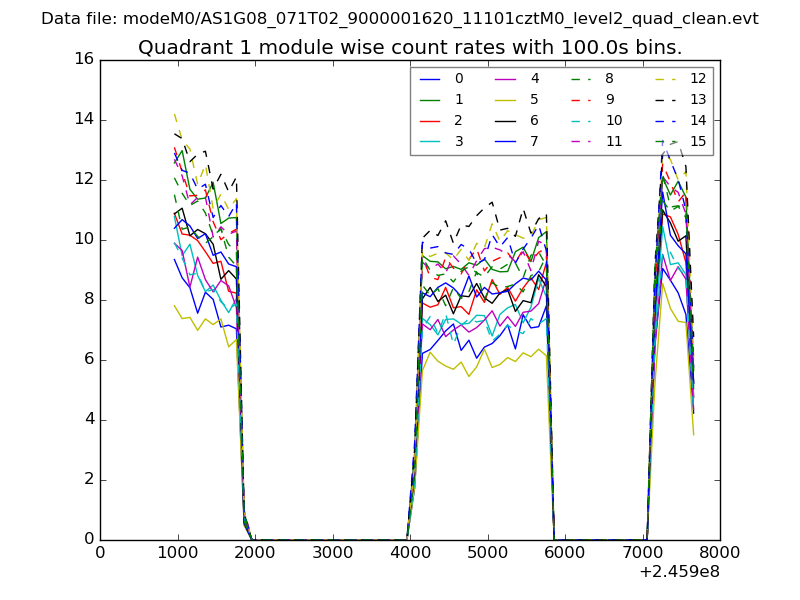
| Module-wise count rates for Quadrant A Data is divided into 100 sec bins |
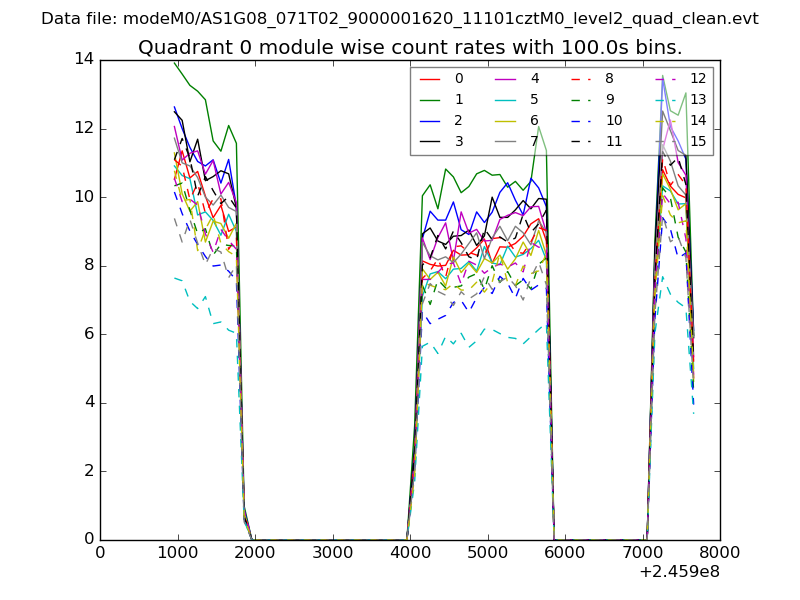 |
 |
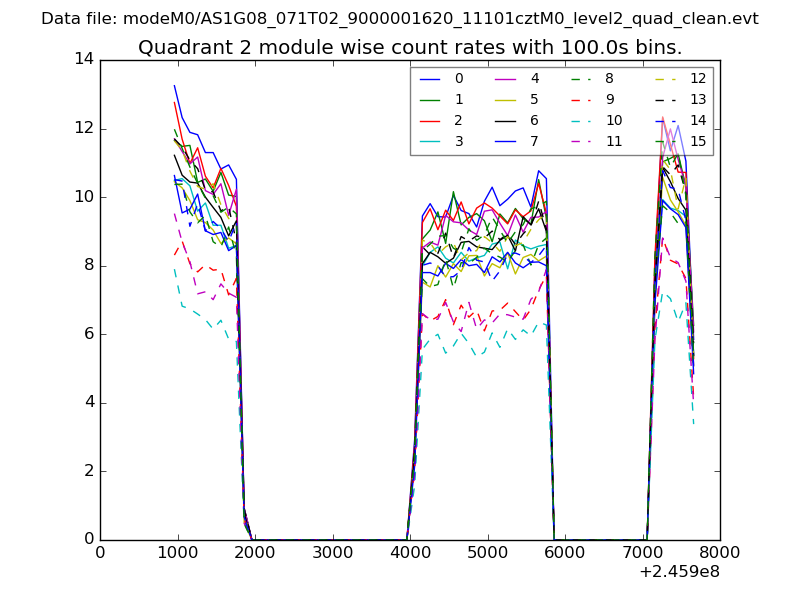
| Module-wise count rates for Quadrant B Data is divided into 100 sec bins |
 |
 |
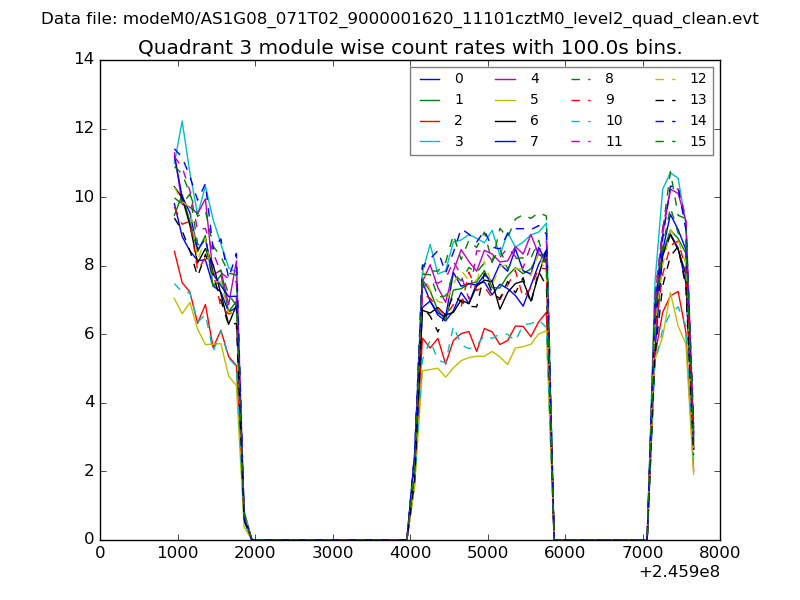
| Module-wise count rates for Quadrant C Data is divided into 100 sec bins |
 |
 |
| Module-wise count rates for Quadrant D Data is divided into 100 sec bins |
 |
 |
| Parameter | Plot |
|---|---|
| CZT HV Monitor | 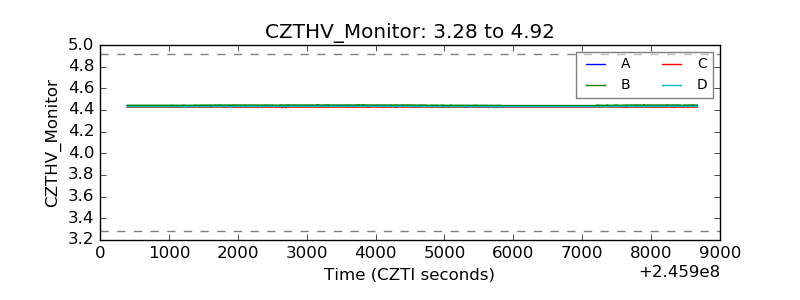 |
| D_VDD |  |
| Temperature 1 | 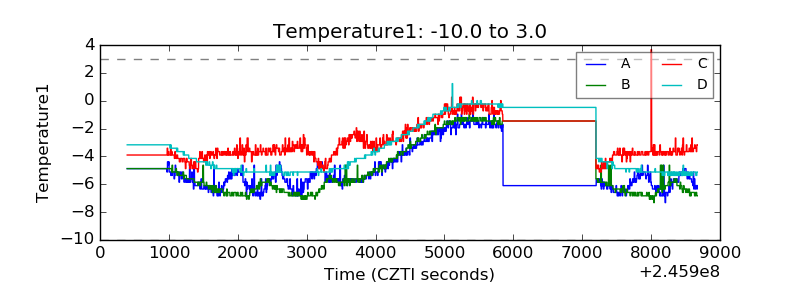 |
| Veto HV Monitor |  |
| Veto LLD | 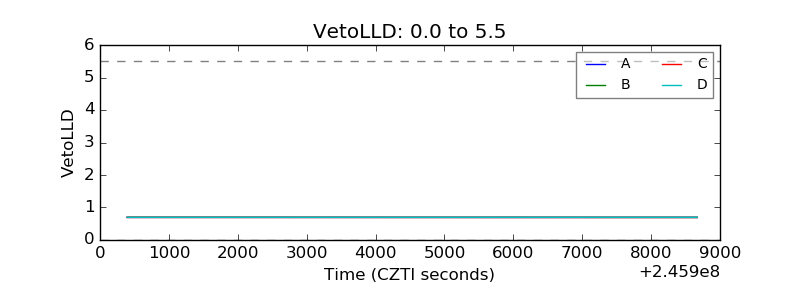 |
| Alpha Counter | 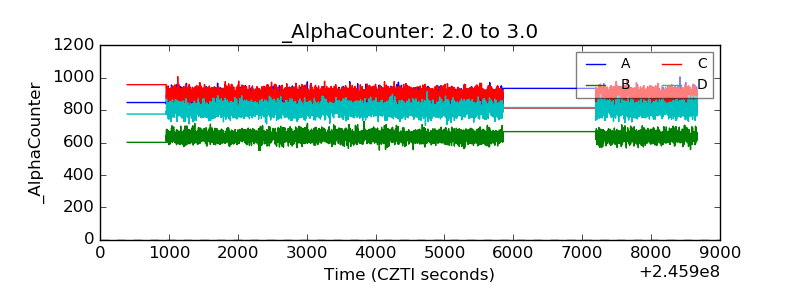 |
| _CPM_Rate | 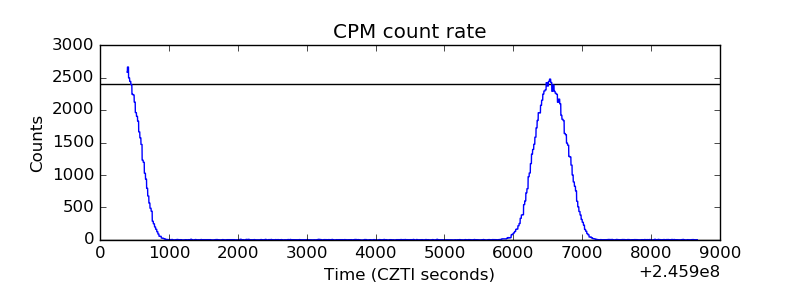 |
| CZT Counter | 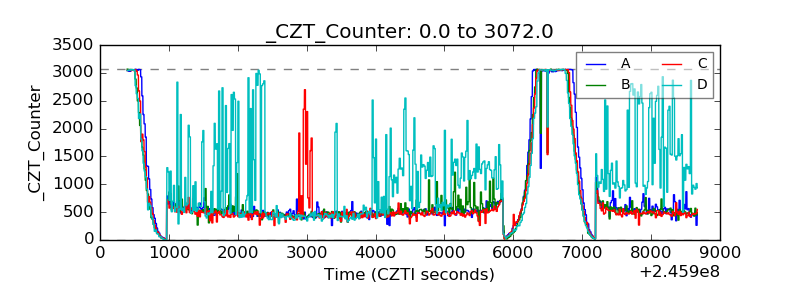 |
| +2.5 Volts monitor |  |
| +5 Volts monitor |  |
| _ROLL_ROT | 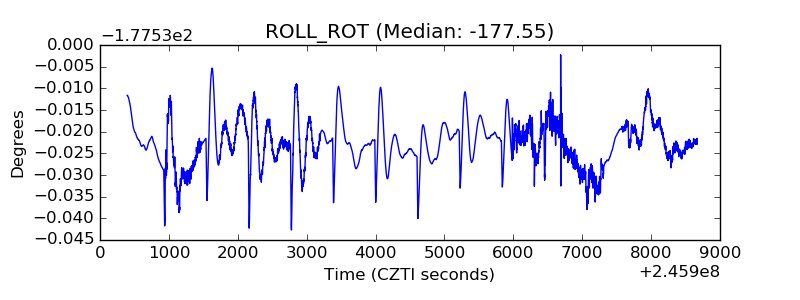 |
| _Roll_DEC | 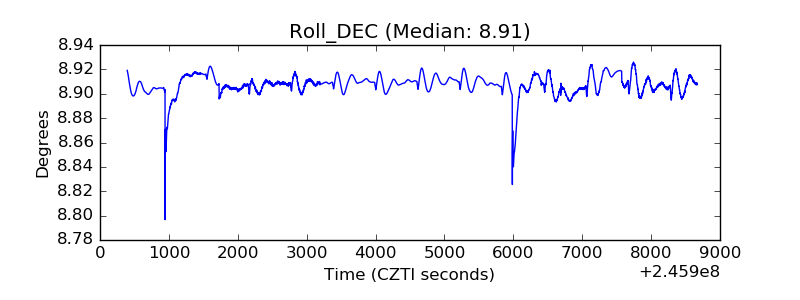 |
| _Roll_RA |  |
| Veto Counter | 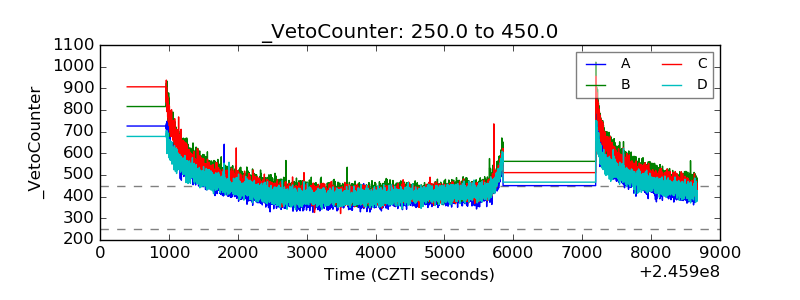 |