| Param | Original file | Final file |
|---|---|---|
| Filename | modeM0/AS1G08_071T02_9000001620_11103cztM0_level2.evt | modeM0/AS1G08_071T02_9000001620_11103cztM0_level2_quad_clean.evt |
| Size (bytes) | 523,828,800 | 61,344,000 |
| Size | 499.6 MB | 58.5 MB |
| Events in quadrant A | 3,305,240 | 358,000 |
| Events in quadrant B | 3,688,865 | 362,060 |
| Events in quadrant C | 3,085,902 | 357,137 |
| Events in quadrant D | 5,343,178 | 326,286 |
| Mode SS | |||
|---|---|---|---|
| Quadrant | BADHDUFLAG | Total packets | Discarded packets |
| A | 0 | 132 | 0 |
| B | 0 | 132 | 0 |
| C | 0 | 132 | 0 |
| D | 0 | 132 | 0 |
| Mode M9 | |||
|---|---|---|---|
| Quadrant | BADHDUFLAG | Total packets | Discarded packets |
| A | 0 | 11 | 0 |
| B | 0 | 11 | 0 |
| C | 0 | 11 | 0 |
| D | 0 | 11 | 0 |
| Mode M0 | |||
|---|---|---|---|
| Quadrant | BADHDUFLAG | Total packets | Discarded packets |
| A | 0 | 13702 | 2 |
| B | 0 | 14886 | 1 |
| C | 0 | 13373 | 1 |
| D | 0 | 20196 | 1 |
| Quadrant | Total seconds | Saturated seconds | Saturation percentage |
|---|---|---|---|
| A | 6503 | 75 | 1.153314% |
| B | 6503 | 162 | 2.491158% |
| C | 6503 | 44 | 0.676611% |
| D | 6503 | 459 | 7.058281% |
Noise dominated data is calculated using 1-second bins in cleaned event files. If a bin has >2000 counts, and if more than 50% of those come from <1% of pixels, then it is considered to be noise-dominated and hence unusable.
| Quadrant | # 1 sec bins | Bins with >0 counts | Bins with >2000 counts | High rate bins dominated by noise | Noise dominated (total time) | Noise dominated (detector-on time) | Marked lightcurve |
|---|---|---|---|---|---|---|---|
| A | 7678 | 6504 | 3 | 3 | 0.04% | 0.05% | 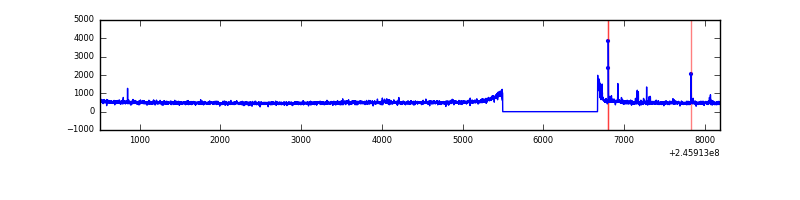 |
| B | 7678 | 6504 | 56 | 56 | 0.73% | 0.86% | 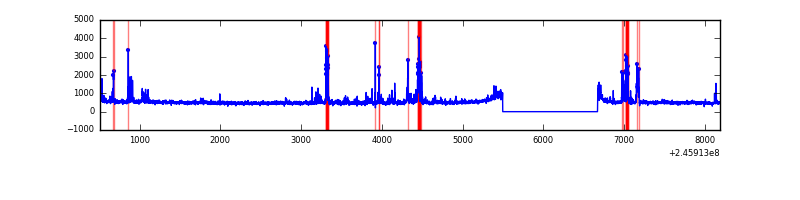 |
| C | 7678 | 6504 | 0 | 0 | 0.00% | 0.00% | 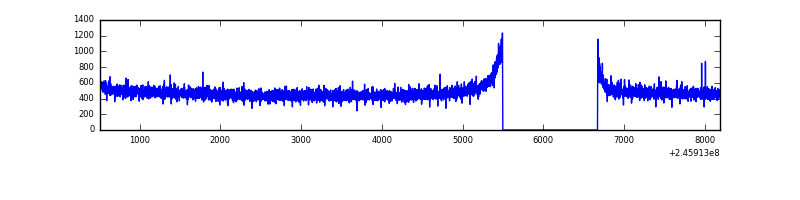 |
| D | 7678 | 6504 | 356 | 356 | 4.64% | 5.47% | 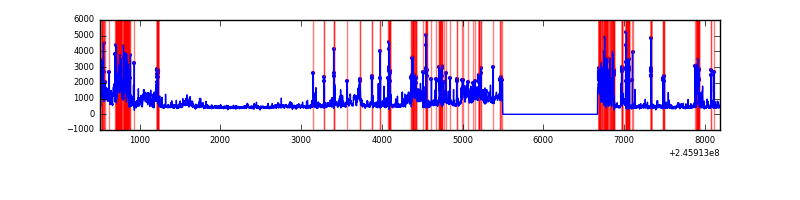 |
Top three noisy pixels from each quadrant. If the there are fewer than three noisy pixels in the level2.evt file, extra rows are filled as -1
| Pixel properties | Quadrant properties | ||||||
|---|---|---|---|---|---|---|---|
| Quadrant | DetID | PixID | Counts | Sigma | Mean | Median | Sigma |
| A | 8 | 15 | 90998 | 541.89 | 814 | 798 | 166.5 |
| A | 14 | 254 | 53202 | 314.82 | 814 | 798 | 166.5 |
| A | 11 | 29 | 26419 | 153.92 | 814 | 798 | 166.5 |
| B | 4 | 239 | 257424 | 1650.07 | 817 | 797 | 155.5 |
| B | 10 | 16 | 148444 | 949.34 | 817 | 797 | 155.5 |
| B | 15 | 204 | 32207 | 201.96 | 817 | 797 | 155.5 |
| C | 13 | 61 | 5814 | 27.23 | 789 | 792 | 184.4 |
| C | 8 | 128 | 4701 | 21.19 | 789 | 792 | 184.4 |
| C | 8 | 112 | 2558 | 9.57 | 789 | 792 | 184.4 |
| D | 1 | 52 | 1091047 | 5947.49 | 752 | 733 | 183.3 |
| D | 10 | 253 | 792760 | 4320.38 | 752 | 733 | 183.3 |
| D | 8 | 195 | 300126 | 1633.14 | 752 | 733 | 183.3 |
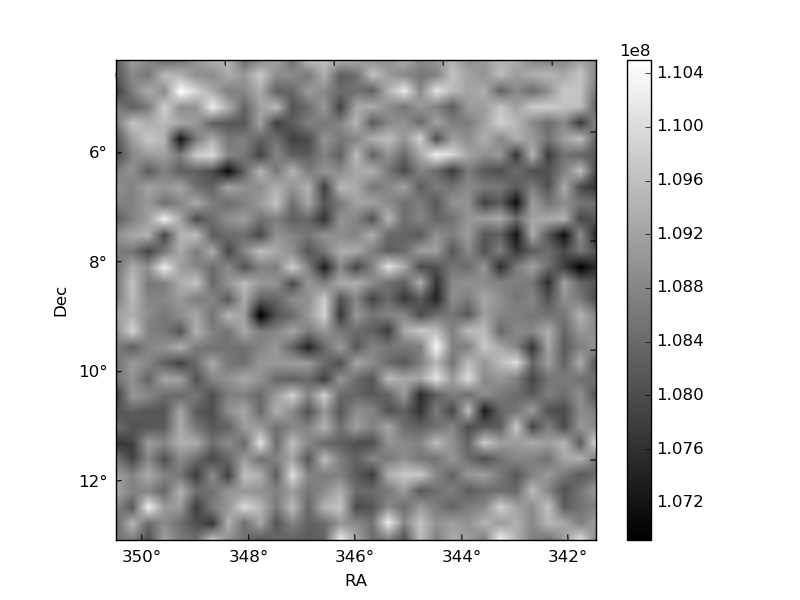
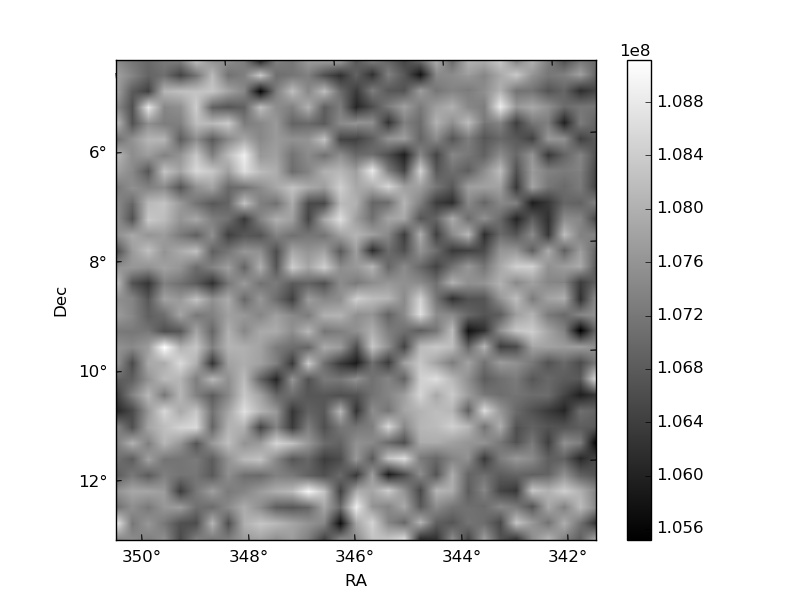
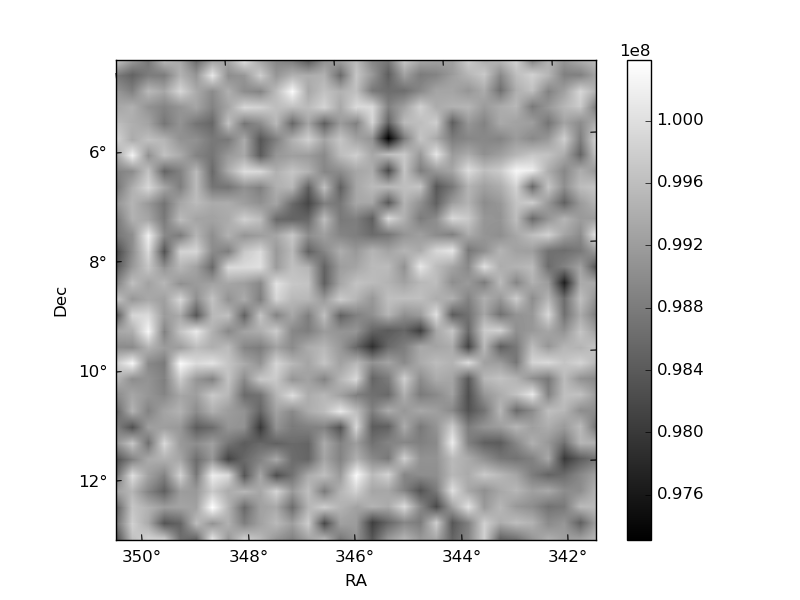
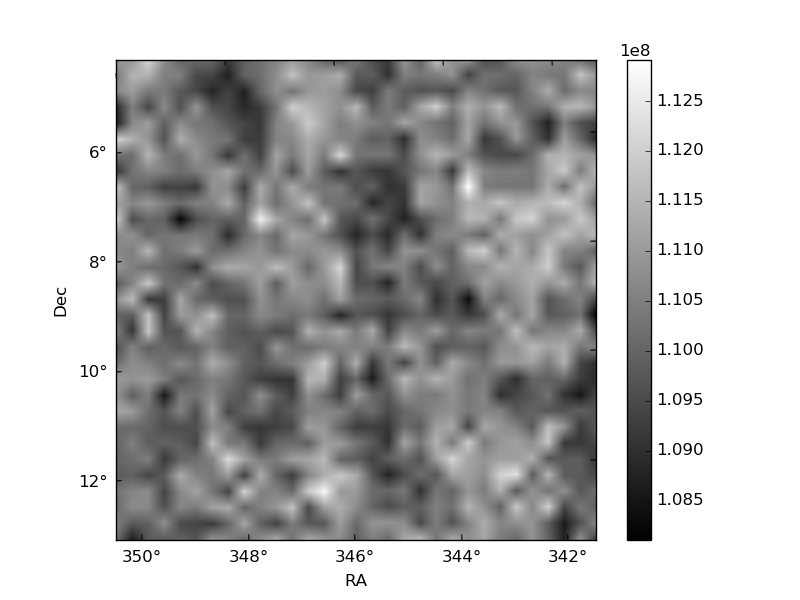
Histogram calculated using DETX and DETY for each event in the final _common_clean file
| Quadrant A | 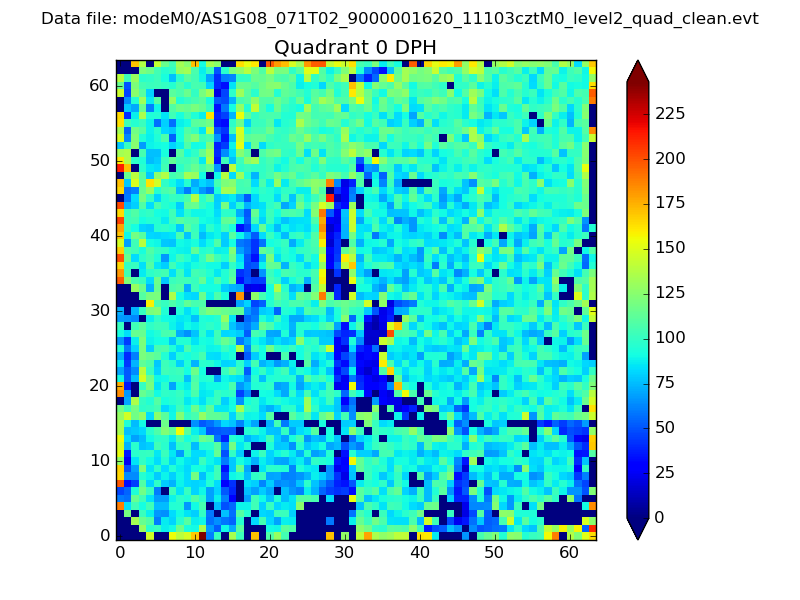 |
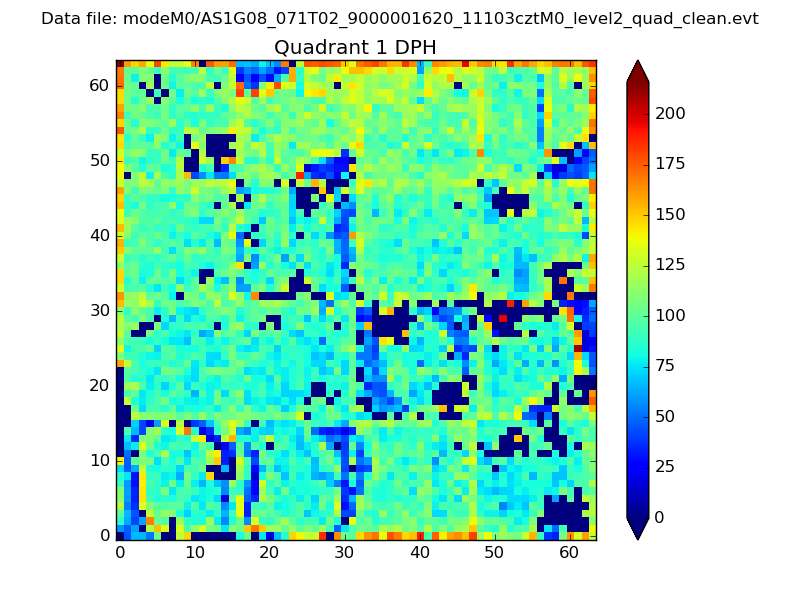 |
Quadrant B |
|---|---|---|---|
| Quadrant D | 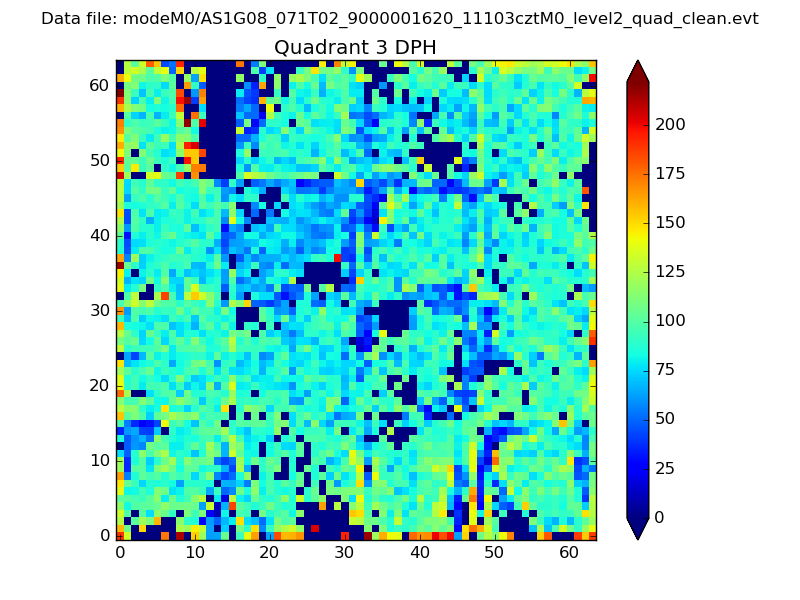 |
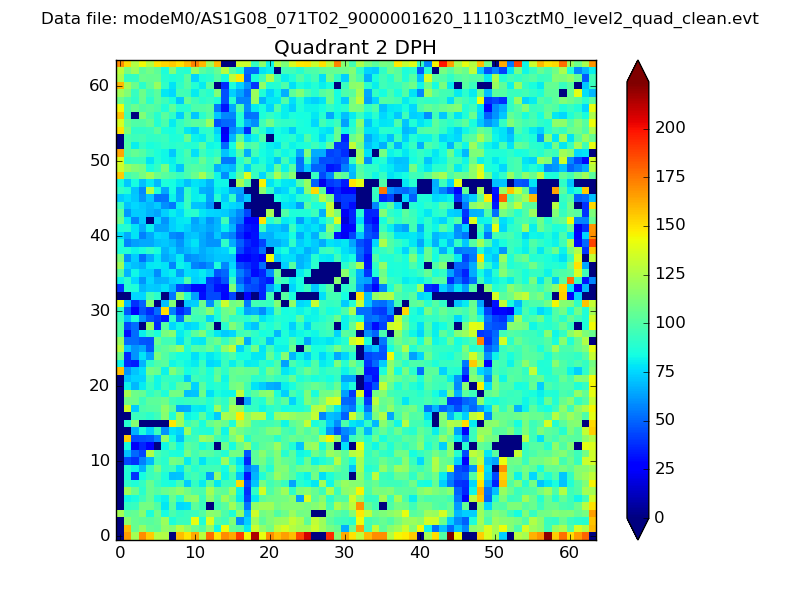 |
Quadrant C |
| Plot type | Count rate plots | Images |
|---|---|---|
| Comparison with Poisson distribution Blue bars denote a histogram of data divided into 1 sec bins. Red curve is a Poisson curve with rate = median count rate of data. |
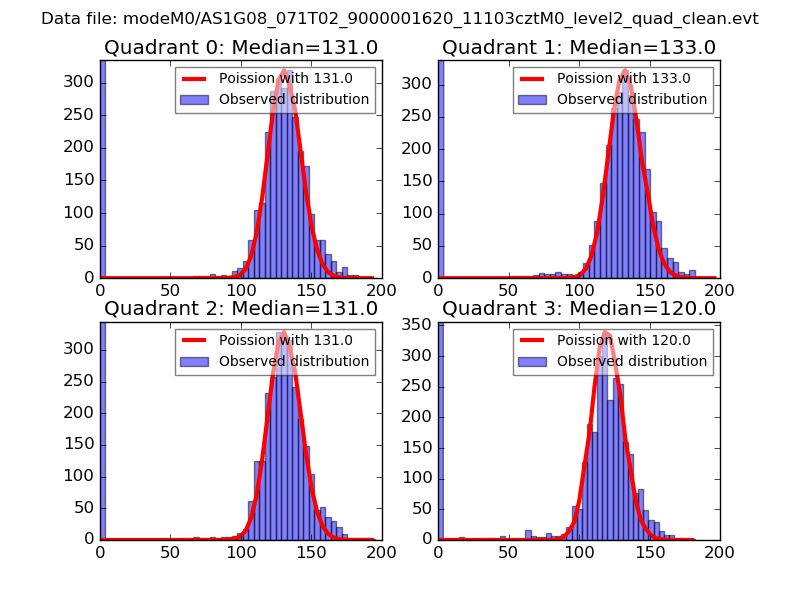 |
 |
| Quadrant-wise count rates Data is divided into 100 sec bins |
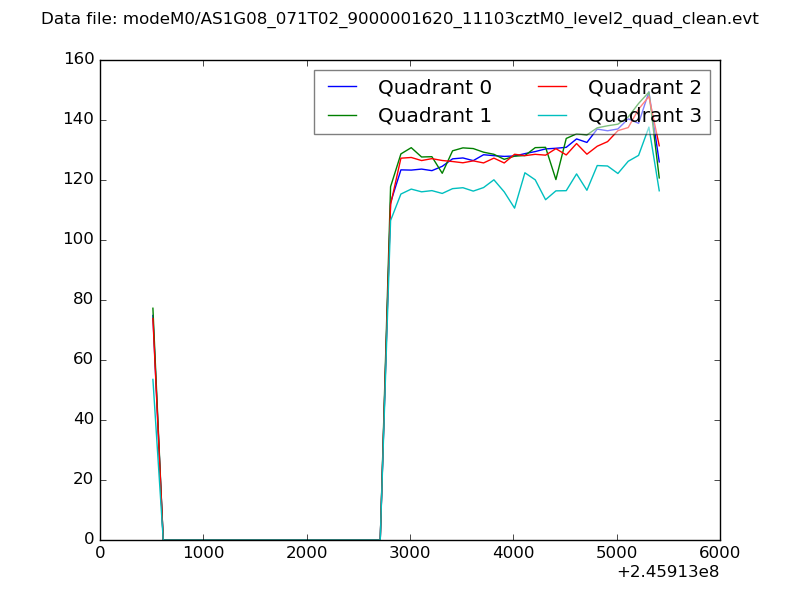 |
|
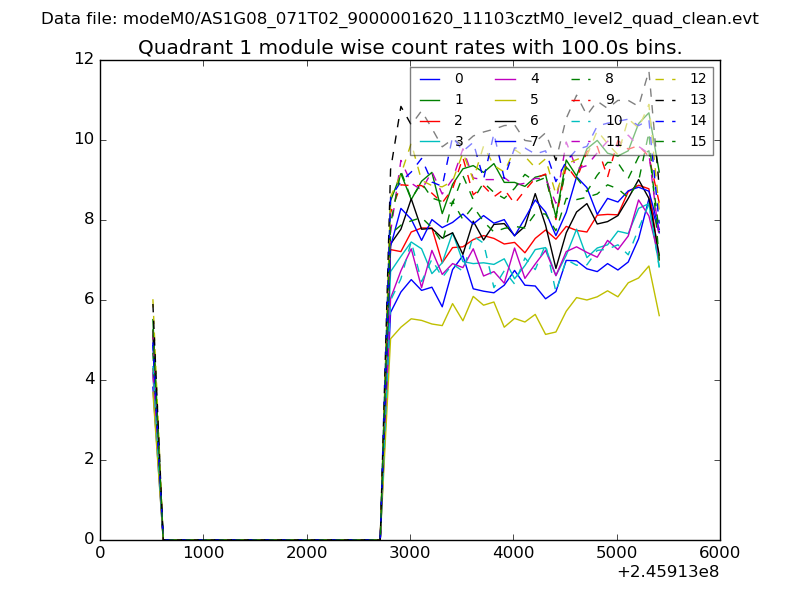
| Module-wise count rates for Quadrant A Data is divided into 100 sec bins |
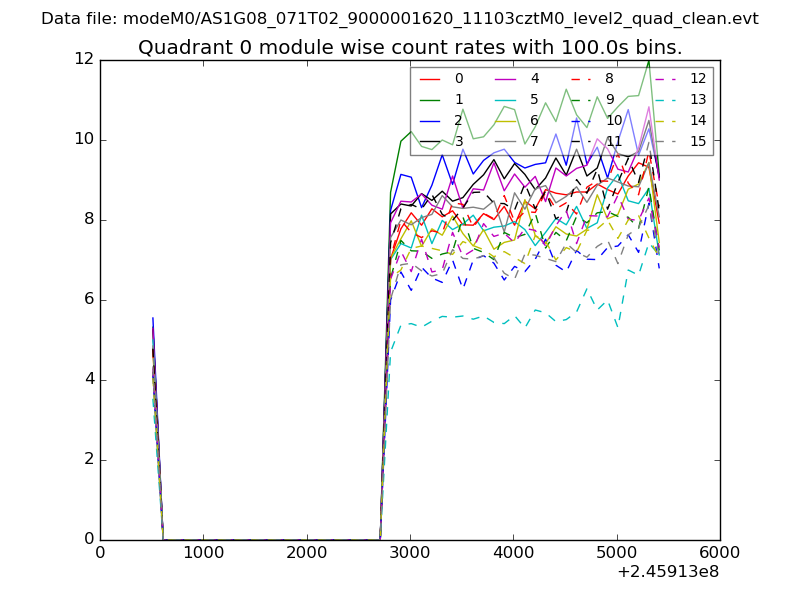 |
 |
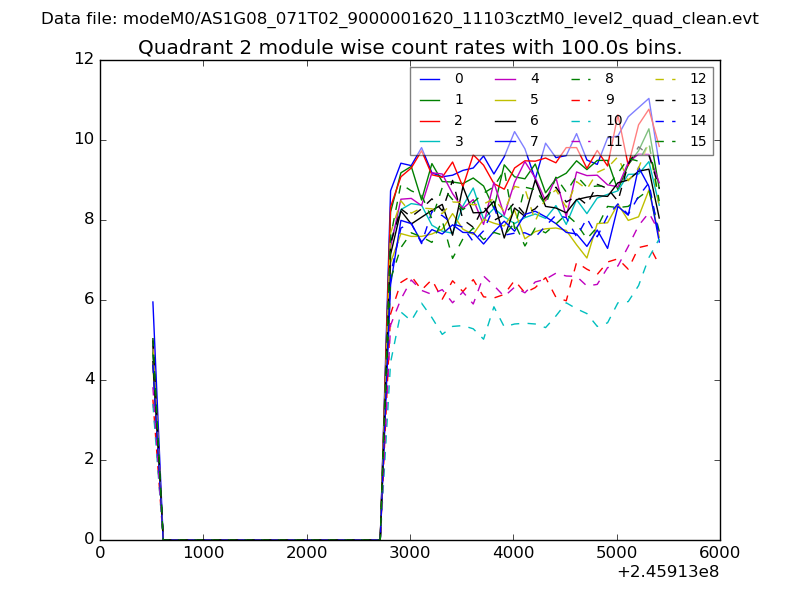
| Module-wise count rates for Quadrant B Data is divided into 100 sec bins |
 |
 |
| Module-wise count rates for Quadrant C Data is divided into 100 sec bins |
 |
 |
| Module-wise count rates for Quadrant D Data is divided into 100 sec bins |
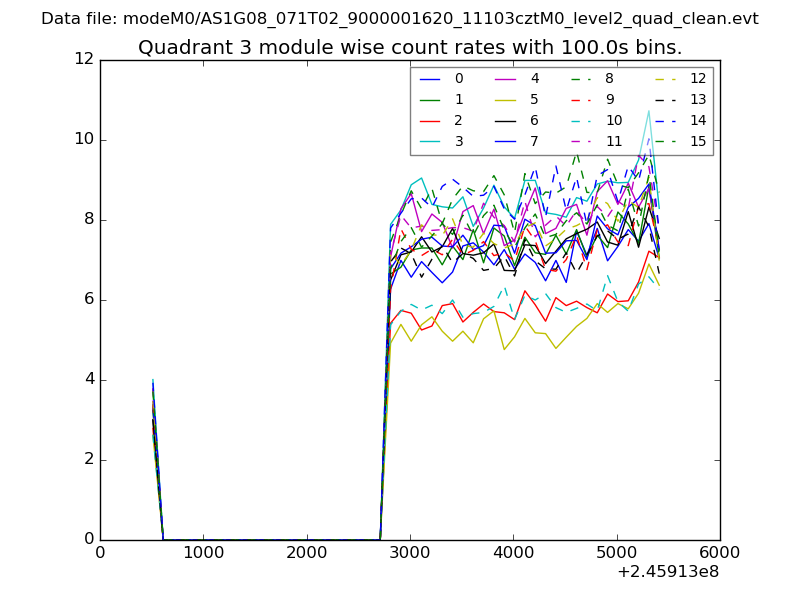 |
 |
| Parameter | Plot |
|---|---|
| CZT HV Monitor | 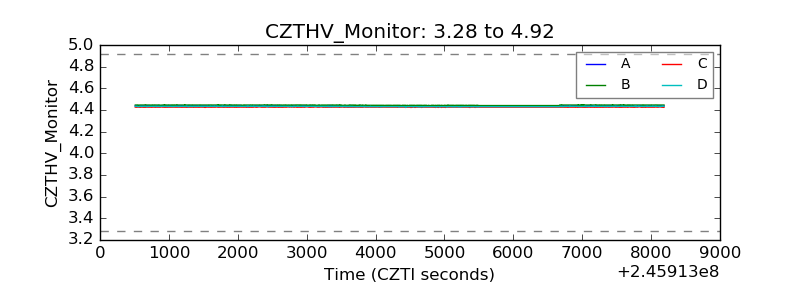 |
| D_VDD |  |
| Temperature 1 | 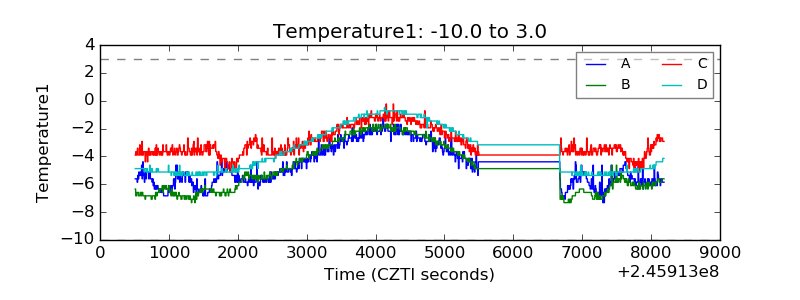 |
| Veto HV Monitor |  |
| Veto LLD | 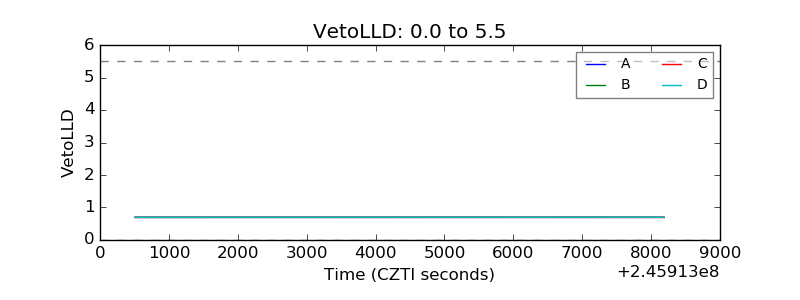 |
| Alpha Counter | 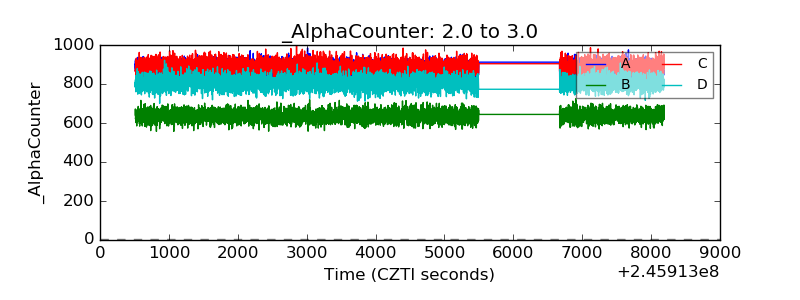 |
| _CPM_Rate | 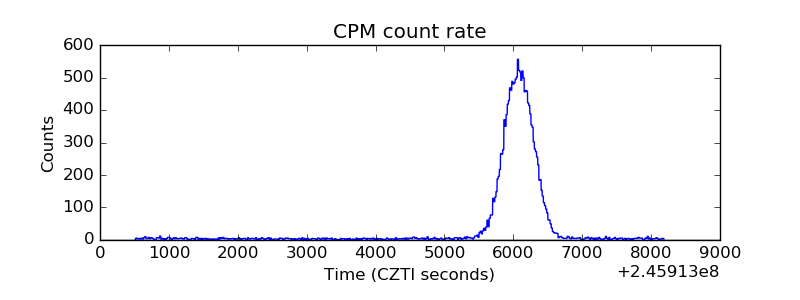 |
| CZT Counter | 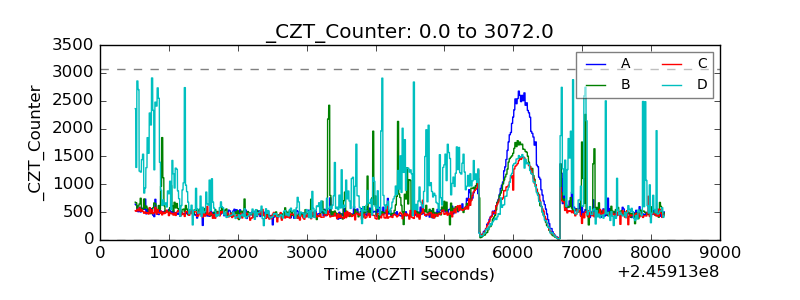 |
| +2.5 Volts monitor |  |
| +5 Volts monitor |  |
| _ROLL_ROT | 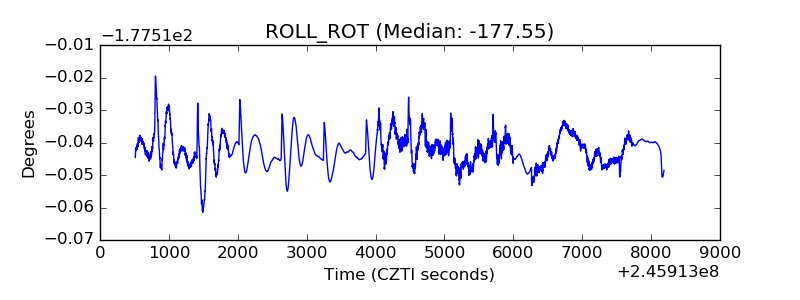 |
| _Roll_DEC | 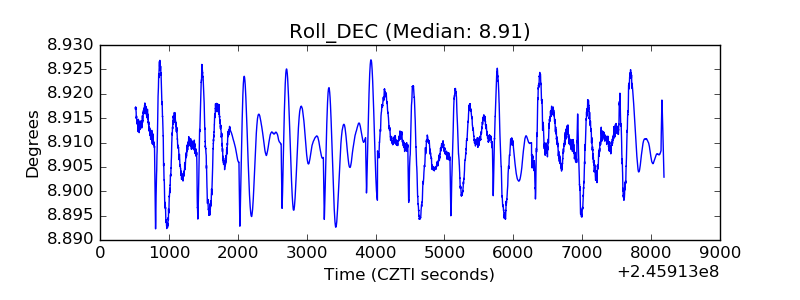 |
| _Roll_RA |  |
| Veto Counter | 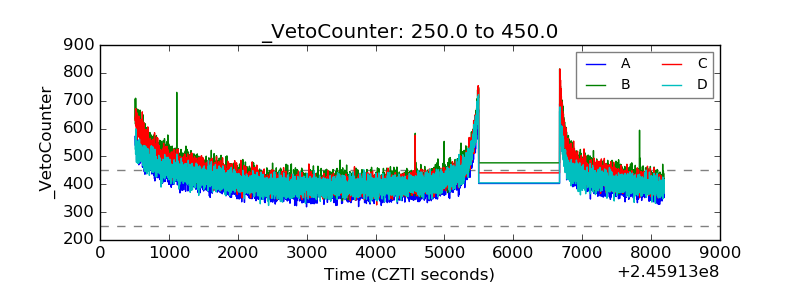 |