| Param | Original file | Final file |
|---|---|---|
| Filename | modeM0/AS1G08_071T02_9000001620_11113cztM0_level2.evt | modeM0/AS1G08_071T02_9000001620_11113cztM0_level2_quad_clean.evt |
| Size (bytes) | 581,014,080 | 85,340,160 |
| Size | 554.1 MB | 81.4 MB |
| Events in quadrant A | 5,828,100 | 518,284 |
| Events in quadrant B | 3,456,055 | 556,477 |
| Events in quadrant C | 2,920,441 | 549,095 |
| Events in quadrant D | 4,956,050 | 511,766 |
| Mode SS | |||
|---|---|---|---|
| Quadrant | BADHDUFLAG | Total packets | Discarded packets |
| A | 0 | 128 | 0 |
| B | 0 | 128 | 0 |
| C | 0 | 128 | 0 |
| D | 0 | 128 | 0 |
| Mode M9 | |||
|---|---|---|---|
| Quadrant | BADHDUFLAG | Total packets | Discarded packets |
| A | 0 | 16 | 0 |
| B | 0 | 16 | 0 |
| C | 0 | 16 | 0 |
| D | 0 | 17 | 0 |
| Mode M0 | |||
|---|---|---|---|
| Quadrant | BADHDUFLAG | Total packets | Discarded packets |
| A | 0 | 21730 | 3 |
| B | 0 | 14461 | 2 |
| C | 0 | 13091 | 2 |
| D | 0 | 18906 | 2 |
| Quadrant | Total seconds | Saturated seconds | Saturation percentage |
|---|---|---|---|
| A | 6437 | 605 | 9.398788% |
| B | 6437 | 95 | 1.475843% |
| C | 6437 | 15 | 0.233028% |
| D | 6437 | 450 | 6.990834% |
Noise dominated data is calculated using 1-second bins in cleaned event files. If a bin has >2000 counts, and if more than 50% of those come from <1% of pixels, then it is considered to be noise-dominated and hence unusable.
| Quadrant | # 1 sec bins | Bins with >0 counts | Bins with >2000 counts | High rate bins dominated by noise | Noise dominated (total time) | Noise dominated (detector-on time) | Marked lightcurve |
|---|---|---|---|---|---|---|---|
| A | 7547 | 6438 | 500 | 500 | 6.63% | 7.77% | 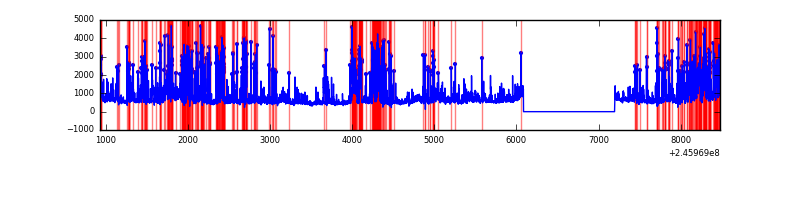 |
| B | 7547 | 6438 | 42 | 42 | 0.56% | 0.65% | 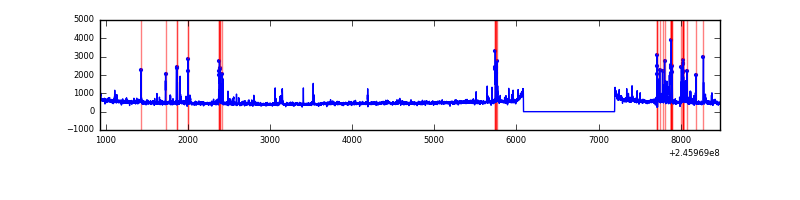 |
| C | 7547 | 6438 | 0 | 0 | 0.00% | 0.00% | 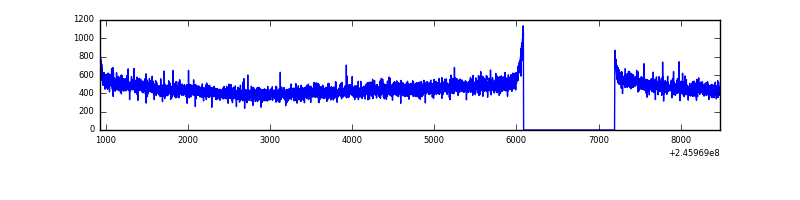 |
| D | 7547 | 6438 | 399 | 399 | 5.29% | 6.20% | 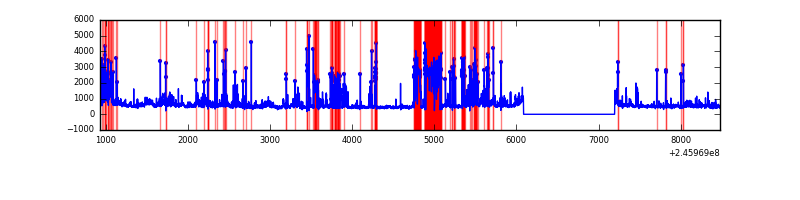 |
Top three noisy pixels from each quadrant. If the there are fewer than three noisy pixels in the level2.evt file, extra rows are filled as -1
| Pixel properties | Quadrant properties | ||||||
|---|---|---|---|---|---|---|---|
| Quadrant | DetID | PixID | Counts | Sigma | Mean | Median | Sigma |
| A | 8 | 5 | 2583835 | 17217.62 | 736 | 721 | 150.0 |
| A | 8 | 15 | 346207 | 2302.82 | 736 | 721 | 150.0 |
| A | 11 | 29 | 31220 | 203.29 | 736 | 721 | 150.0 |
| B | 4 | 239 | 259636 | 1757.24 | 774 | 756 | 147.3 |
| B | 15 | 204 | 76640 | 515.09 | 774 | 756 | 147.3 |
| B | 0 | 219 | 25714 | 169.41 | 774 | 756 | 147.3 |
| C | 13 | 61 | 5648 | 28.09 | 747 | 753 | 174.2 |
| C | 8 | 222 | 2765 | 11.55 | 747 | 753 | 174.2 |
| C | 1 | 3 | 2486 | 9.95 | 747 | 753 | 174.2 |
| D | 10 | 253 | 957383 | 5495.51 | 717 | 696 | 174.1 |
| D | 1 | 52 | 766693 | 4400.12 | 717 | 696 | 174.1 |
| D | 8 | 195 | 244578 | 1400.93 | 717 | 696 | 174.1 |
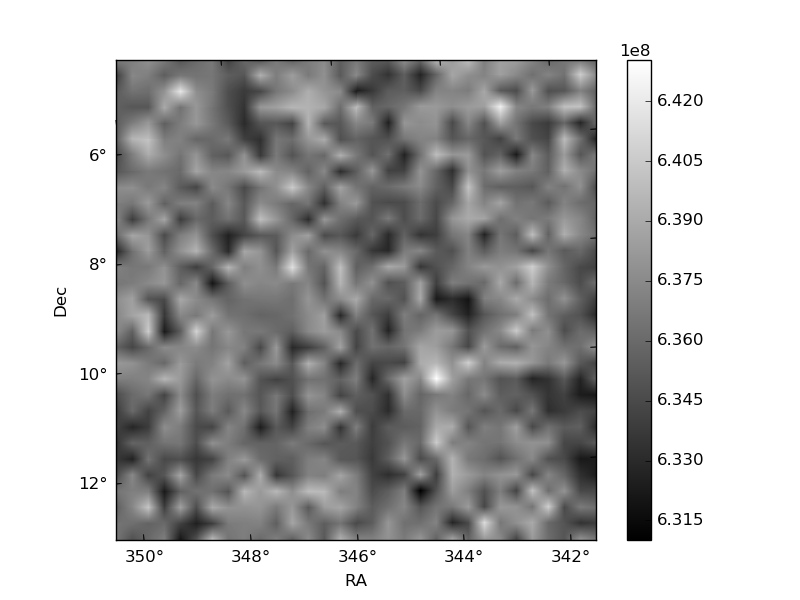
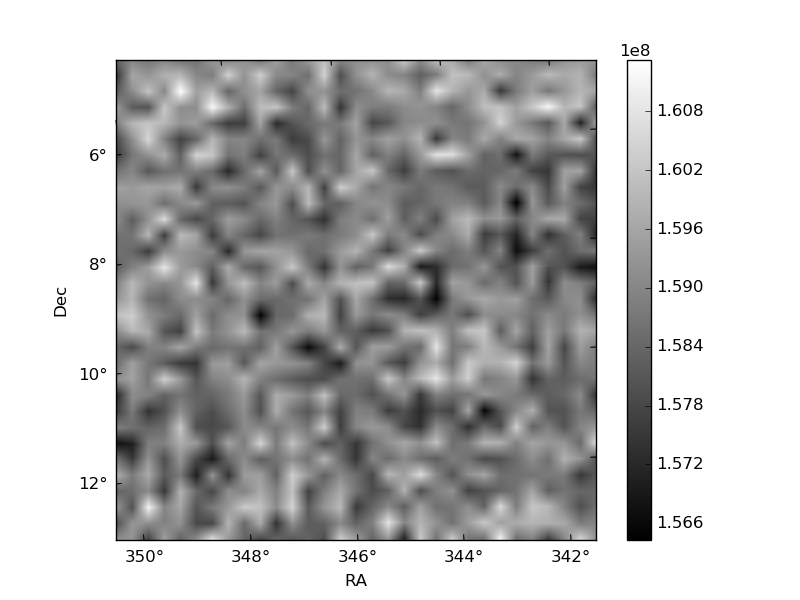
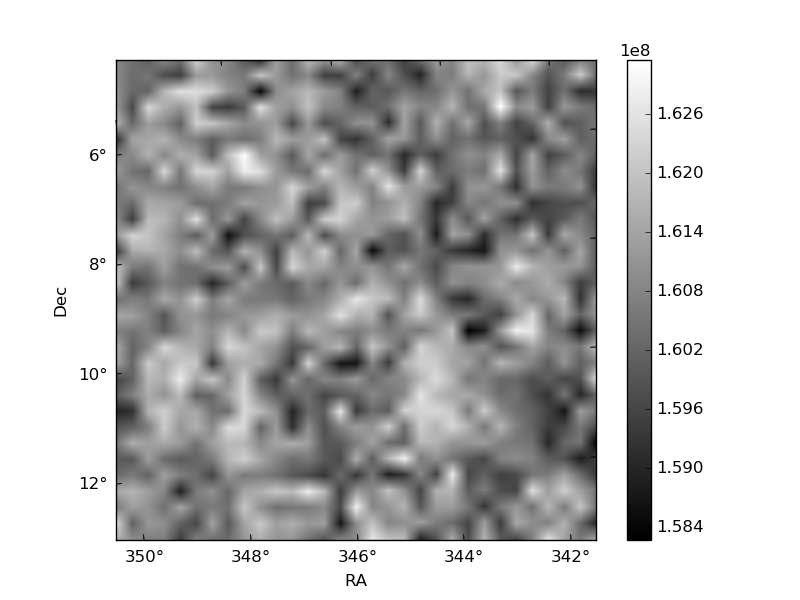
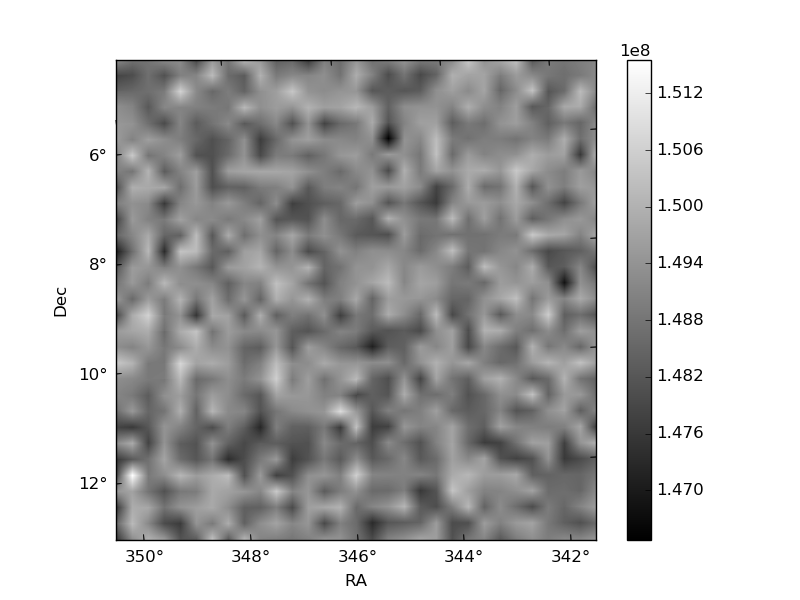
Histogram calculated using DETX and DETY for each event in the final _common_clean file
| Quadrant A | 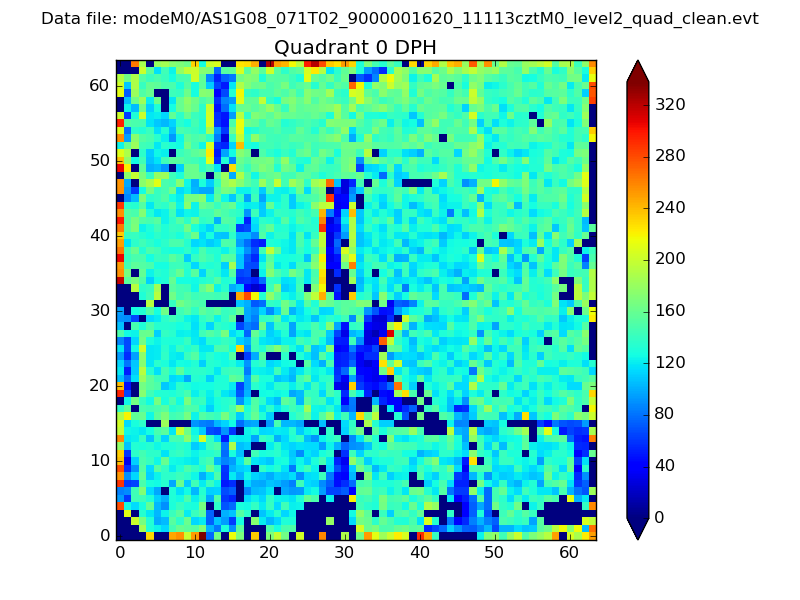 |
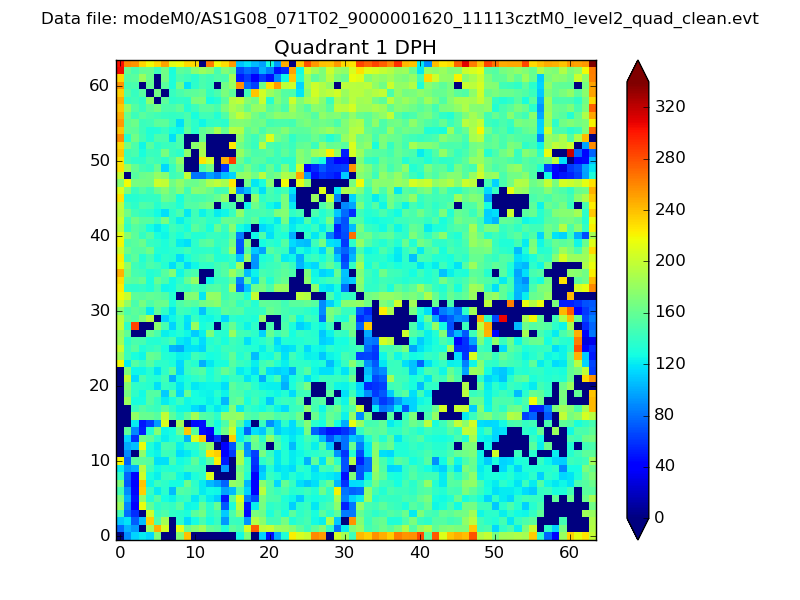 |
Quadrant B |
|---|---|---|---|
| Quadrant D |  |
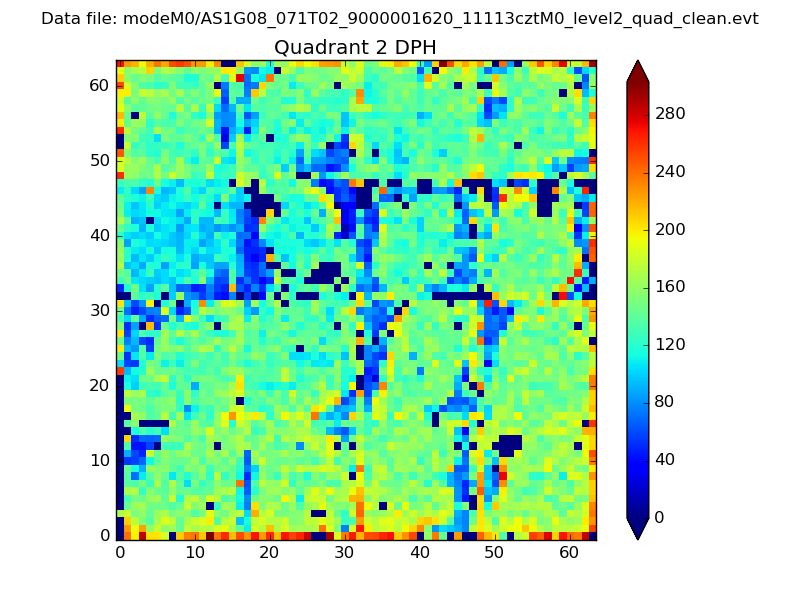 |
Quadrant C |
| Plot type | Count rate plots | Images |
|---|---|---|
| Comparison with Poisson distribution Blue bars denote a histogram of data divided into 1 sec bins. Red curve is a Poisson curve with rate = median count rate of data. |
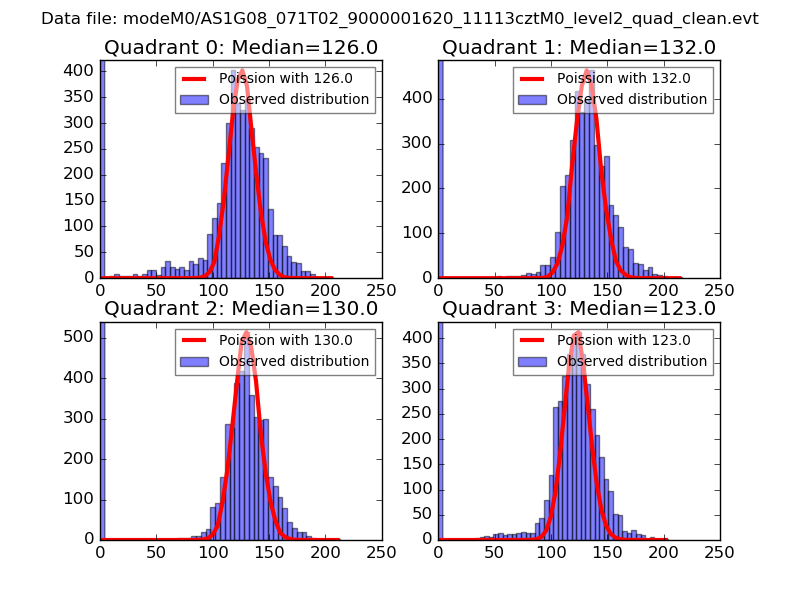 |
 |
| Quadrant-wise count rates Data is divided into 100 sec bins |
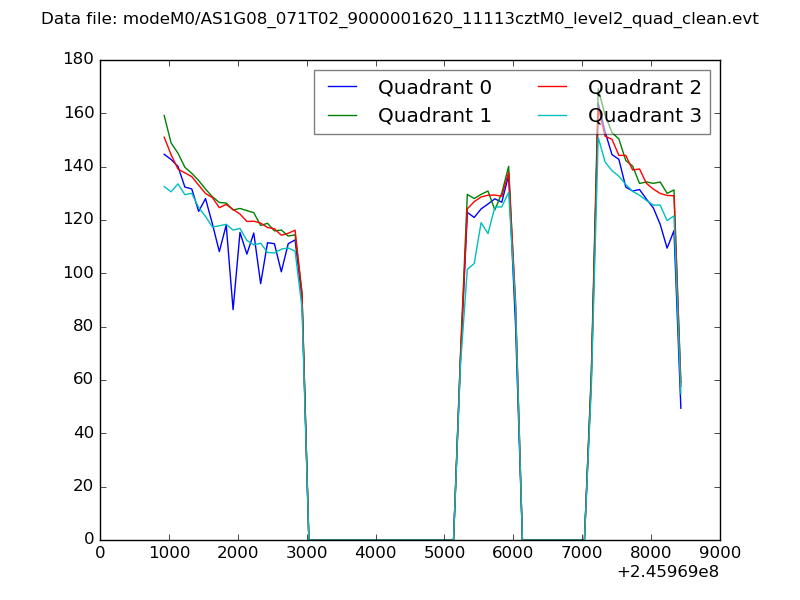 |
|
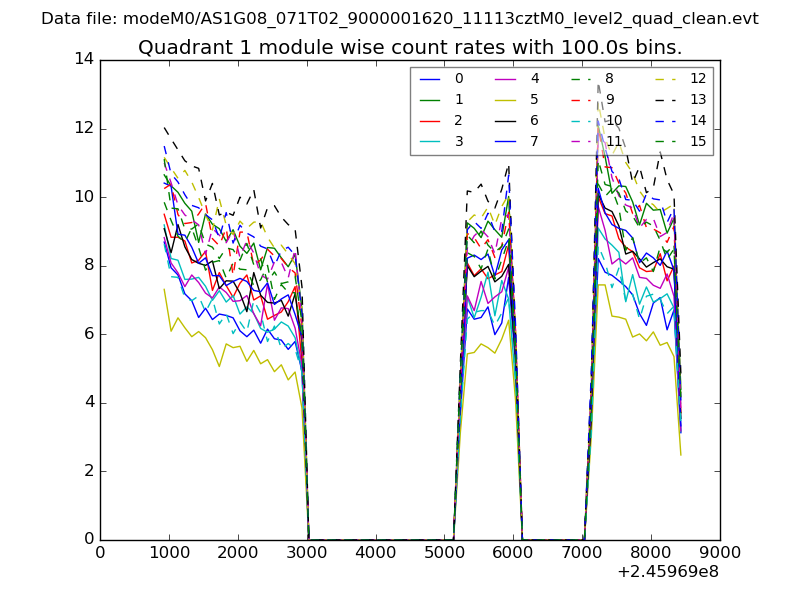
| Module-wise count rates for Quadrant A Data is divided into 100 sec bins |
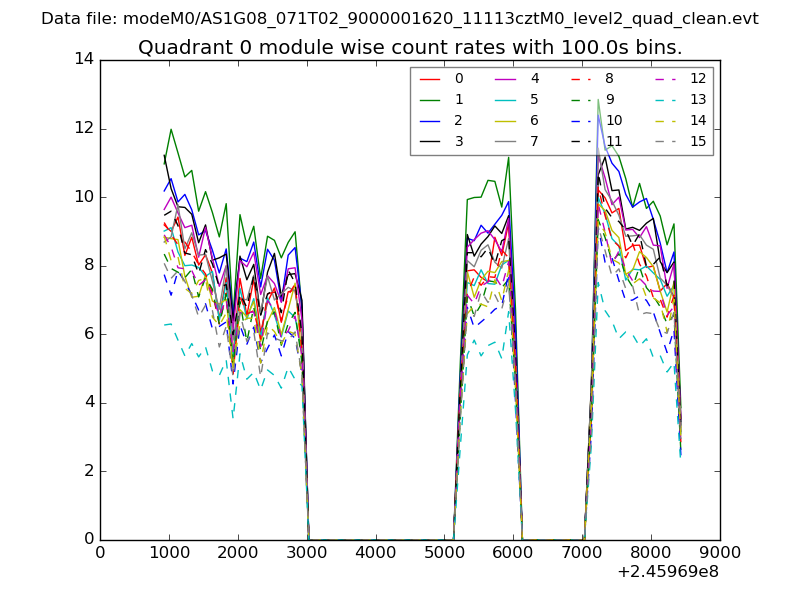 |
 |
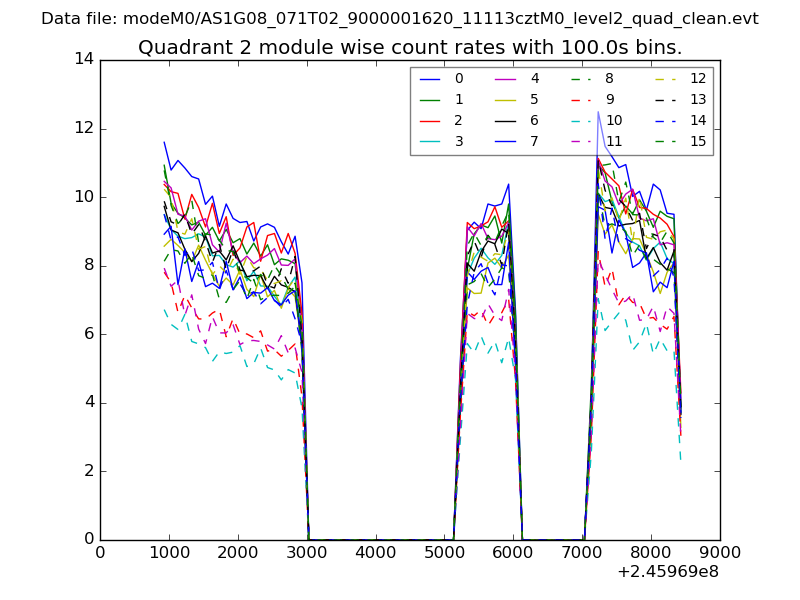
| Module-wise count rates for Quadrant B Data is divided into 100 sec bins |
 |
 |
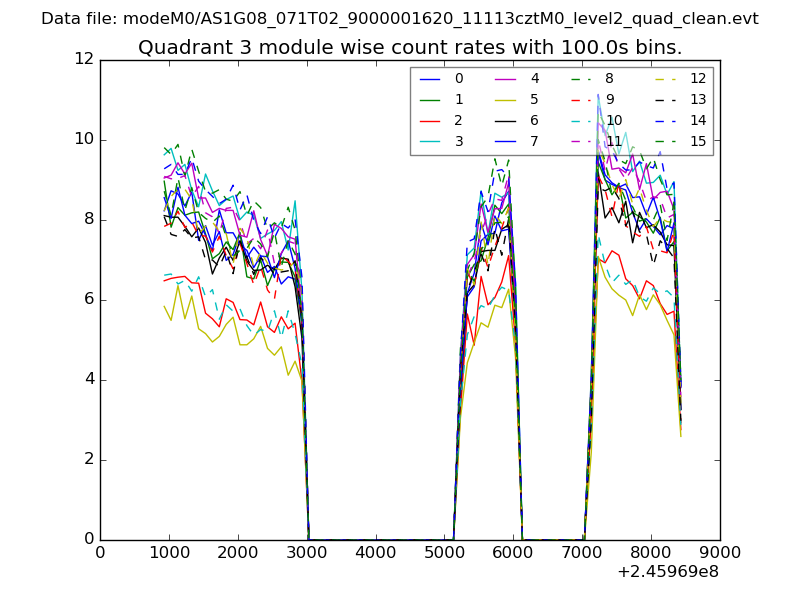
| Module-wise count rates for Quadrant C Data is divided into 100 sec bins |
 |
 |
| Module-wise count rates for Quadrant D Data is divided into 100 sec bins |
 |
 |
| Parameter | Plot |
|---|---|
| CZT HV Monitor | 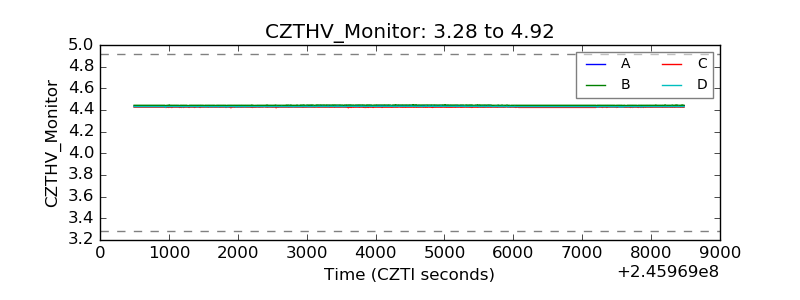 |
| D_VDD |  |
| Temperature 1 |  |
| Veto HV Monitor | 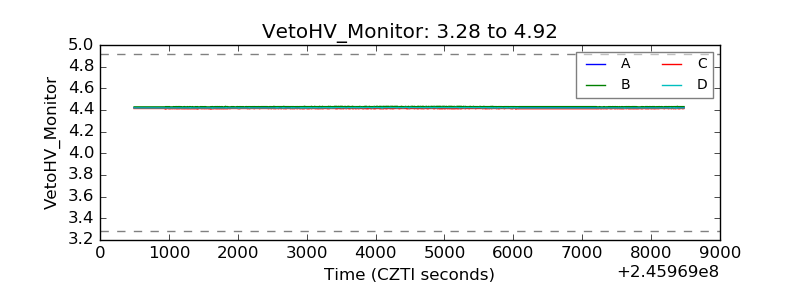 |
| Veto LLD | 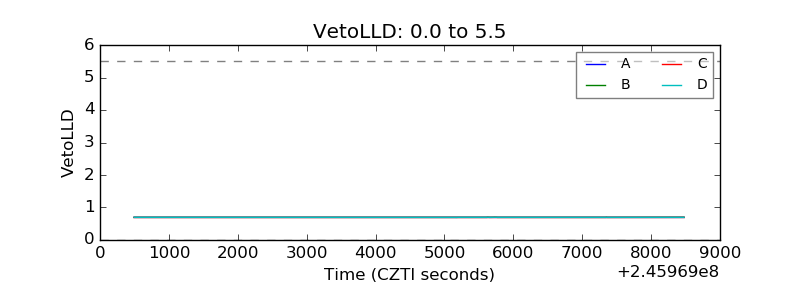 |
| Alpha Counter |  |
| _CPM_Rate | 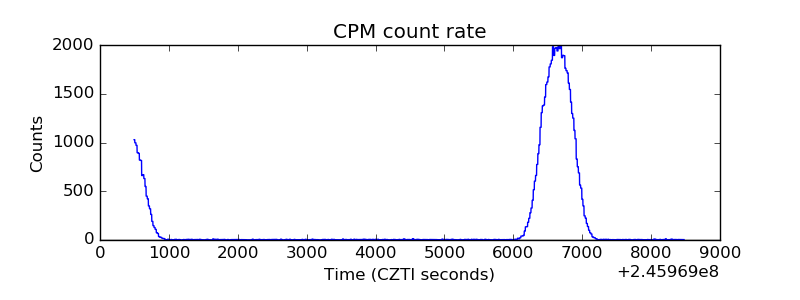 |
| CZT Counter | 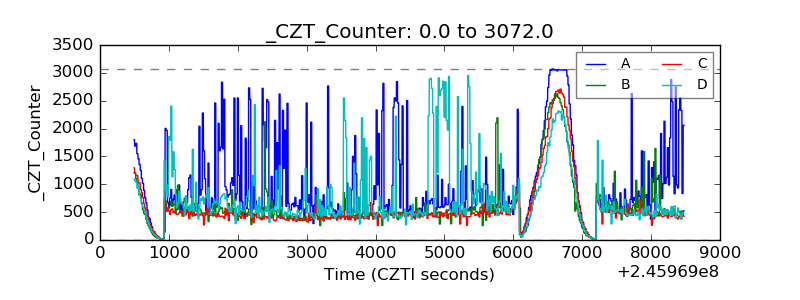 |
| +2.5 Volts monitor |  |
| +5 Volts monitor | 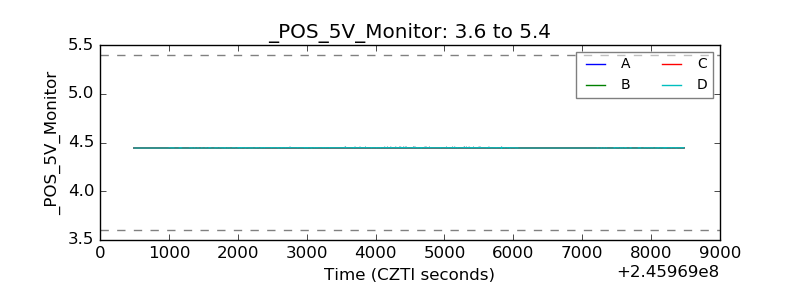 |
| _ROLL_ROT | 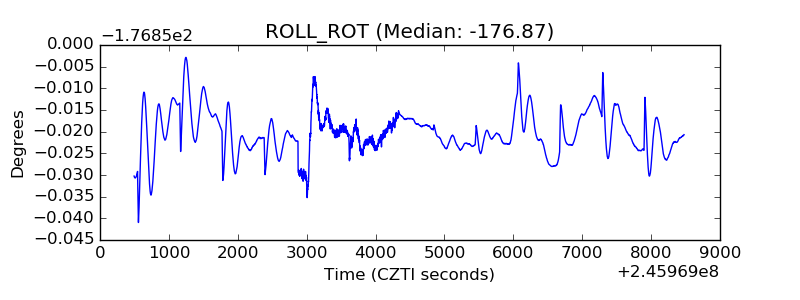 |
| _Roll_DEC | 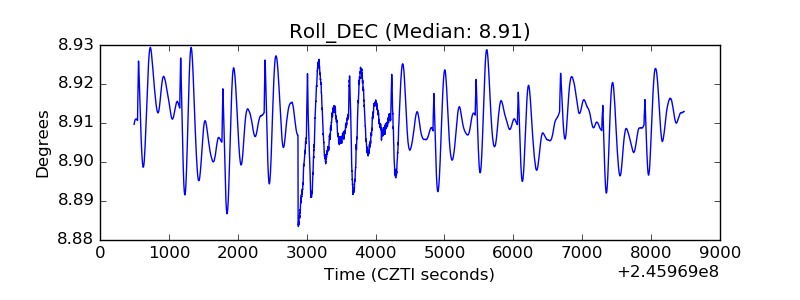 |
| _Roll_RA | 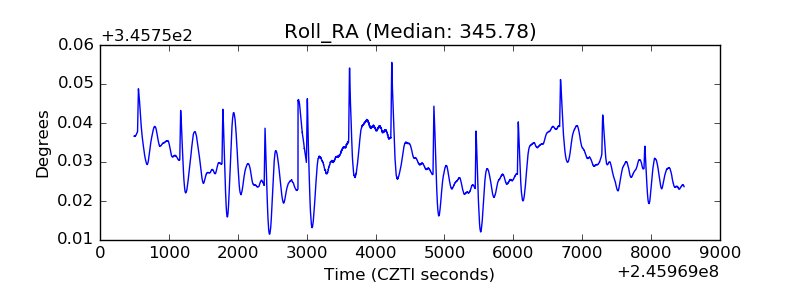 |
| Veto Counter | 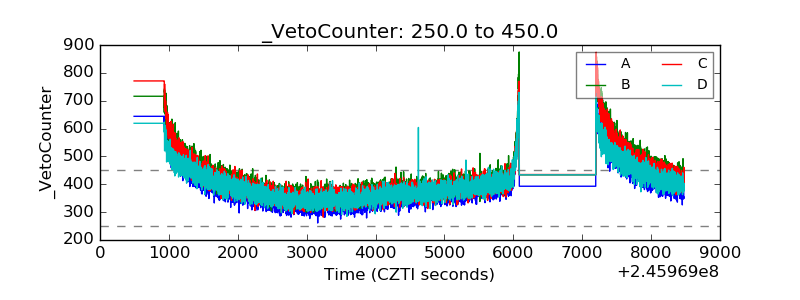 |