| Param | Original file | Final file |
|---|---|---|
| Filename | modeM0/AS1G08_071T02_9000001620_11114cztM0_level2.evt | modeM0/AS1G08_071T02_9000001620_11114cztM0_level2_quad_clean.evt |
| Size (bytes) | 597,107,520 | 84,965,760 |
| Size | 569.4 MB | 81.0 MB |
| Events in quadrant A | 6,389,783 | 522,418 |
| Events in quadrant B | 3,681,025 | 561,155 |
| Events in quadrant C | 2,899,156 | 550,788 |
| Events in quadrant D | 4,689,821 | 501,257 |
| Mode SS | |||
|---|---|---|---|
| Quadrant | BADHDUFLAG | Total packets | Discarded packets |
| A | 0 | 128 | 0 |
| B | 0 | 128 | 0 |
| C | 0 | 128 | 0 |
| D | 0 | 128 | 0 |
| Mode M9 | |||
|---|---|---|---|
| Quadrant | BADHDUFLAG | Total packets | Discarded packets |
| A | 0 | 15 | 0 |
| B | 0 | 15 | 0 |
| C | 0 | 15 | 0 |
| D | 0 | 16 | 0 |
| Mode M0 | |||
|---|---|---|---|
| Quadrant | BADHDUFLAG | Total packets | Discarded packets |
| A | 0 | 23332 | 3 |
| B | 0 | 14936 | 2 |
| C | 0 | 12729 | 2 |
| D | 0 | 18017 | 2 |
| Quadrant | Total seconds | Saturated seconds | Saturation percentage |
|---|---|---|---|
| A | 6257 | 722 | 11.539076% |
| B | 6257 | 114 | 1.821959% |
| C | 6257 | 7 | 0.111875% |
| D | 6257 | 412 | 6.584625% |
Noise dominated data is calculated using 1-second bins in cleaned event files. If a bin has >2000 counts, and if more than 50% of those come from <1% of pixels, then it is considered to be noise-dominated and hence unusable.
| Quadrant | # 1 sec bins | Bins with >0 counts | Bins with >2000 counts | High rate bins dominated by noise | Noise dominated (total time) | Noise dominated (detector-on time) | Marked lightcurve |
|---|---|---|---|---|---|---|---|
| A | 7517 | 6258 | 565 | 565 | 7.52% | 9.03% | 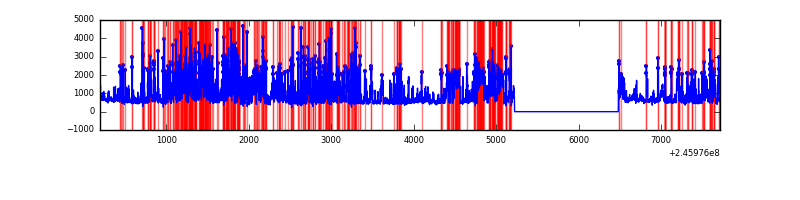 |
| B | 7517 | 6258 | 57 | 57 | 0.76% | 0.91% | 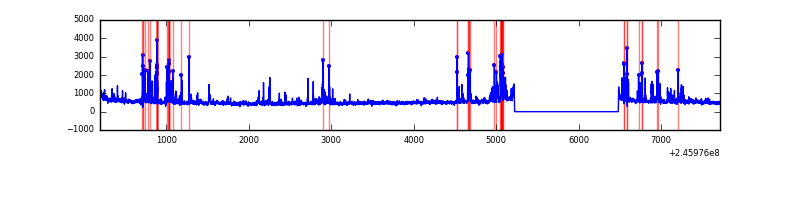 |
| C | 7517 | 6258 | 0 | 0 | 0.00% | 0.00% | 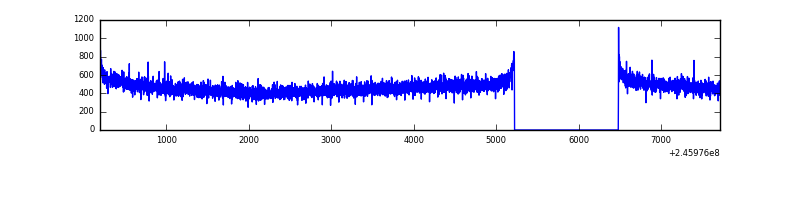 |
| D | 7517 | 6258 | 338 | 338 | 4.50% | 5.40% | 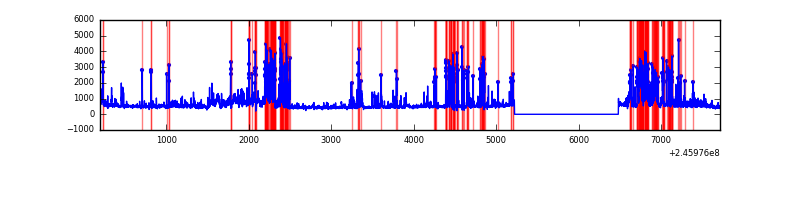 |
Top three noisy pixels from each quadrant. If the there are fewer than three noisy pixels in the level2.evt file, extra rows are filled as -1
| Pixel properties | Quadrant properties | ||||||
|---|---|---|---|---|---|---|---|
| Quadrant | DetID | PixID | Counts | Sigma | Mean | Median | Sigma |
| A | 8 | 5 | 3387791 | 22756.35 | 738 | 725 | 148.8 |
| A | 8 | 15 | 108695 | 725.41 | 738 | 725 | 148.8 |
| A | 11 | 29 | 27685 | 181.13 | 738 | 725 | 148.8 |
| B | 4 | 239 | 465963 | 3205.29 | 769 | 752 | 145.1 |
| B | 0 | 219 | 52509 | 356.6 | 769 | 752 | 145.1 |
| B | 15 | 204 | 44697 | 302.78 | 769 | 752 | 145.1 |
| C | 13 | 61 | 5562 | 27.9 | 742 | 747 | 172.6 |
| C | 5 | 32 | 2712 | 11.39 | 742 | 747 | 172.6 |
| C | 1 | 3 | 2479 | 10.04 | 742 | 747 | 172.6 |
| D | 10 | 253 | 766656 | 4449.61 | 713 | 694 | 172.1 |
| D | 1 | 52 | 483518 | 2804.81 | 713 | 694 | 172.1 |
| D | 2 | 120 | 288932 | 1674.42 | 713 | 694 | 172.1 |
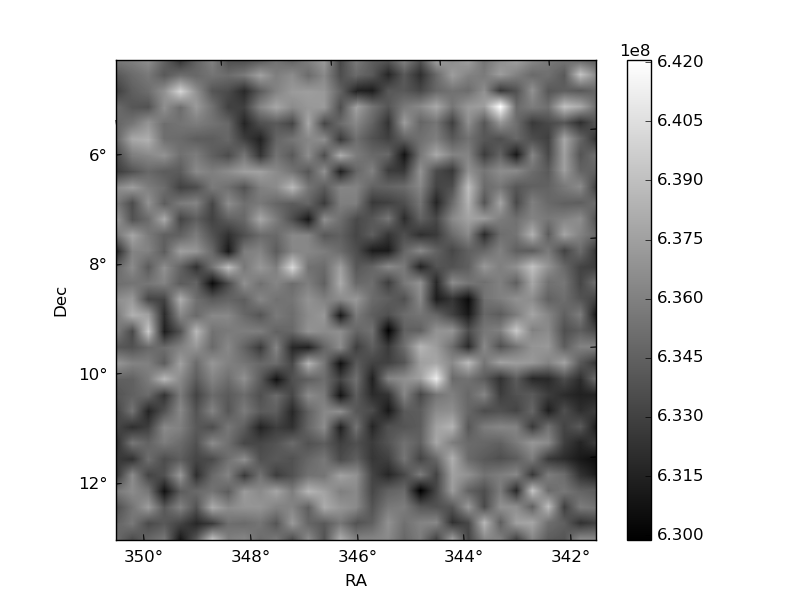
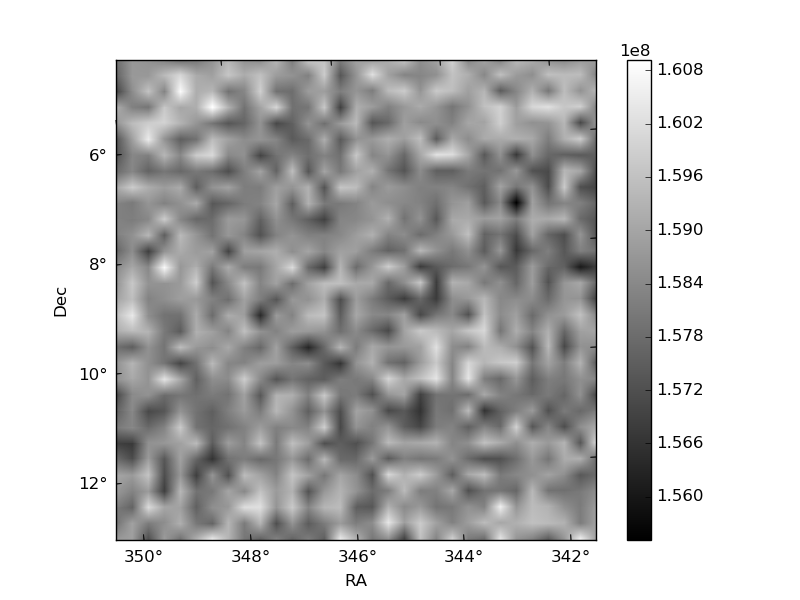
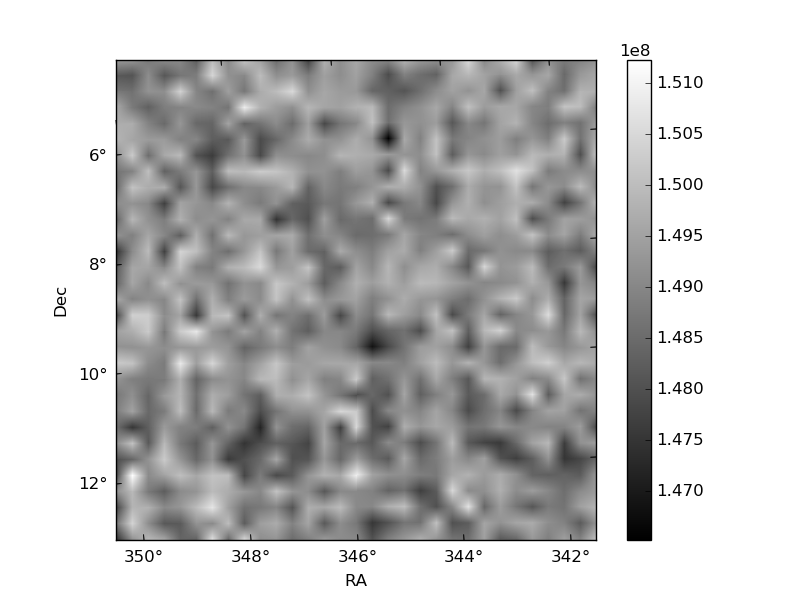
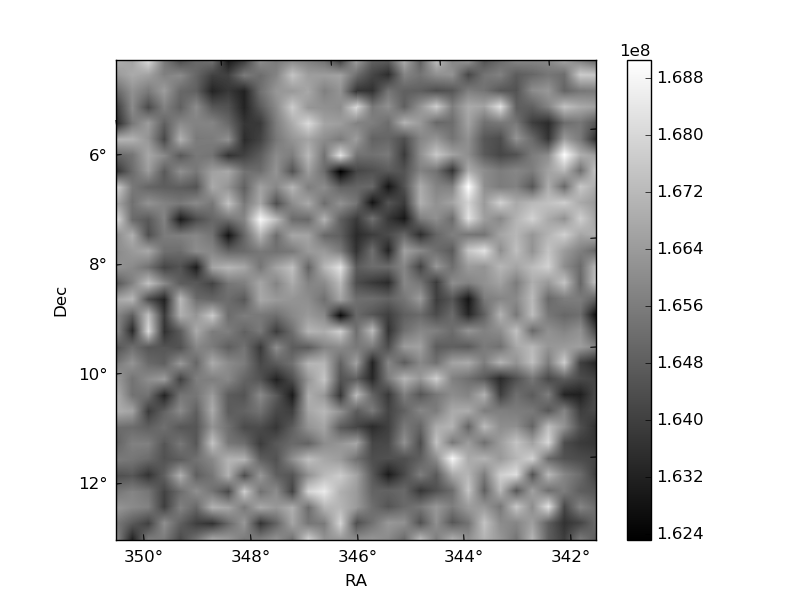
Histogram calculated using DETX and DETY for each event in the final _common_clean file
| Quadrant A | 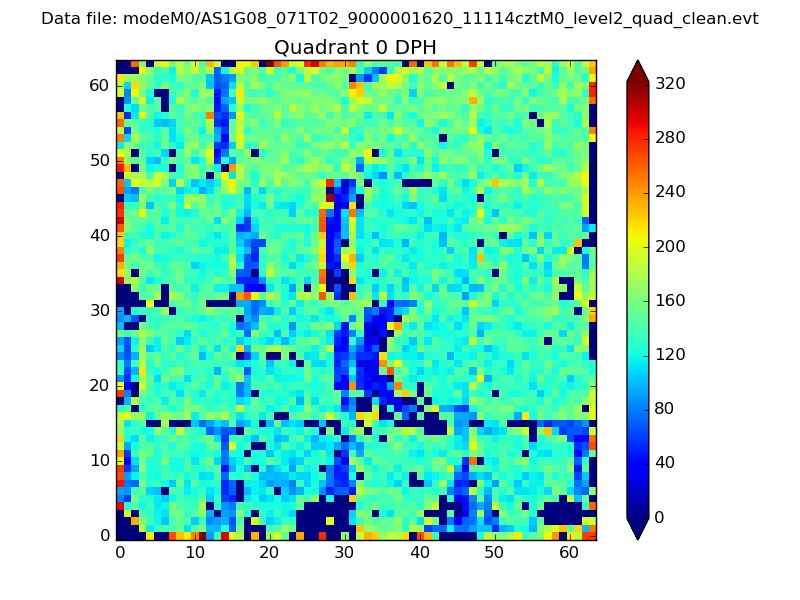 |
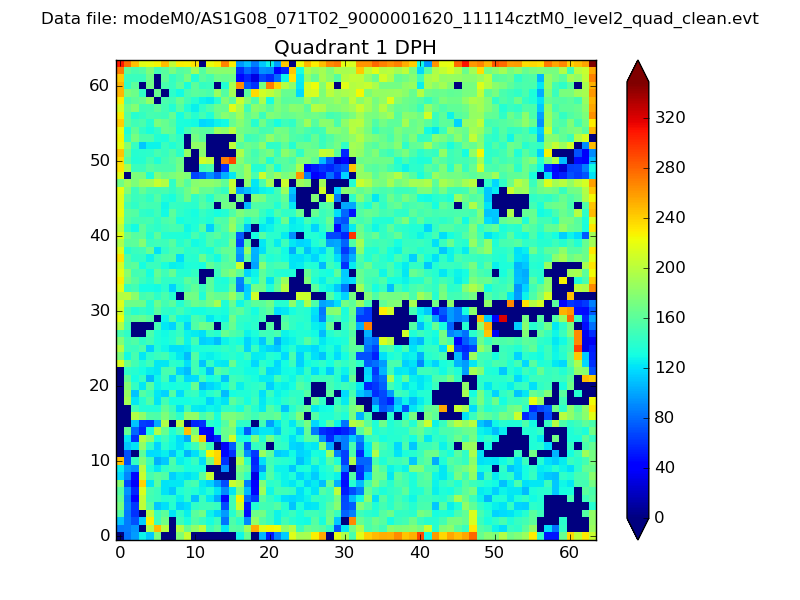 |
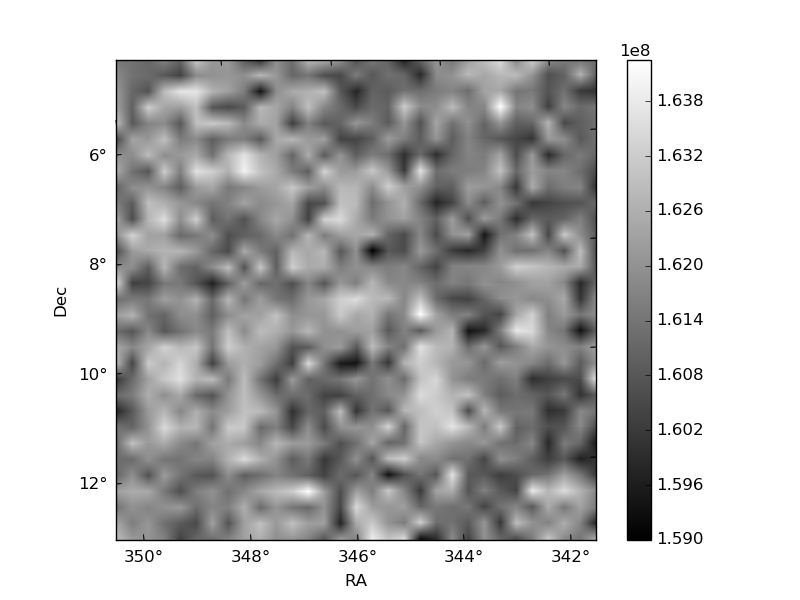
Quadrant B |
|---|---|---|---|
| Quadrant D | 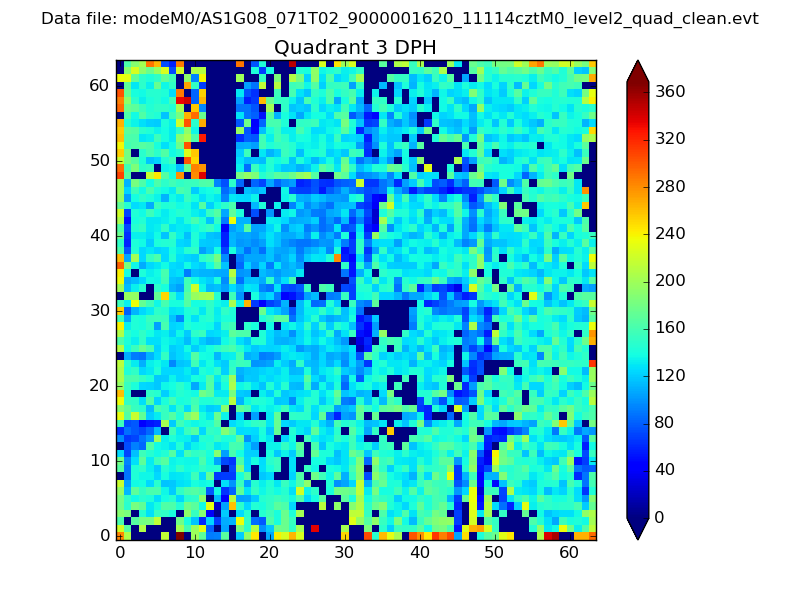 |
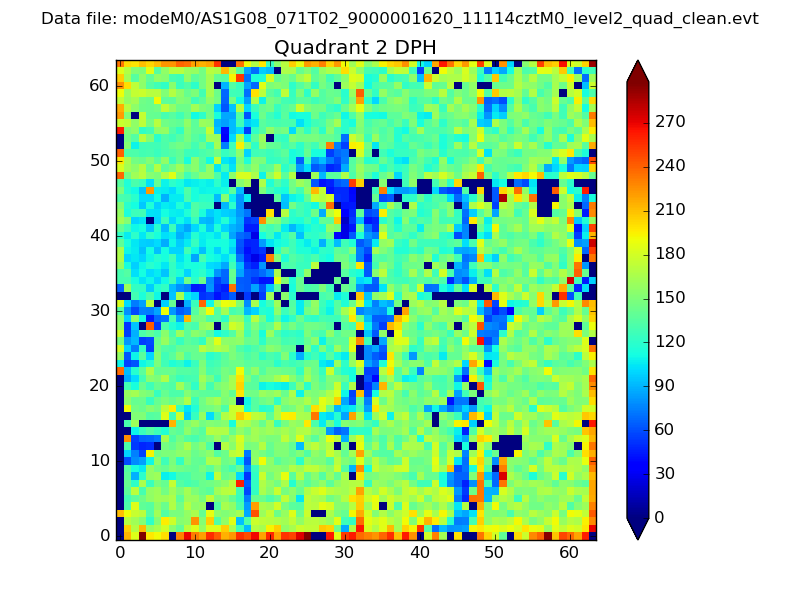 |
Quadrant C |
| Plot type | Count rate plots | Images |
|---|---|---|
| Comparison with Poisson distribution Blue bars denote a histogram of data divided into 1 sec bins. Red curve is a Poisson curve with rate = median count rate of data. |
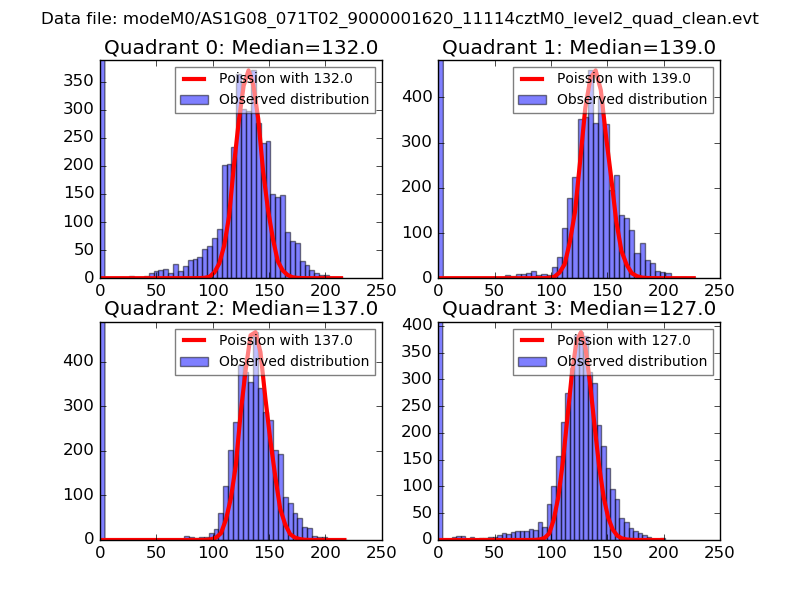 |
 |
| Quadrant-wise count rates Data is divided into 100 sec bins |
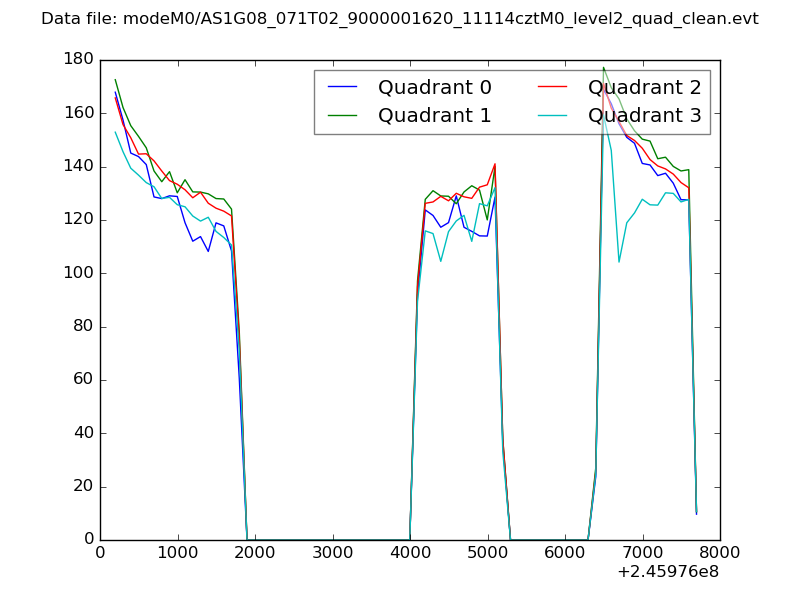 |
|
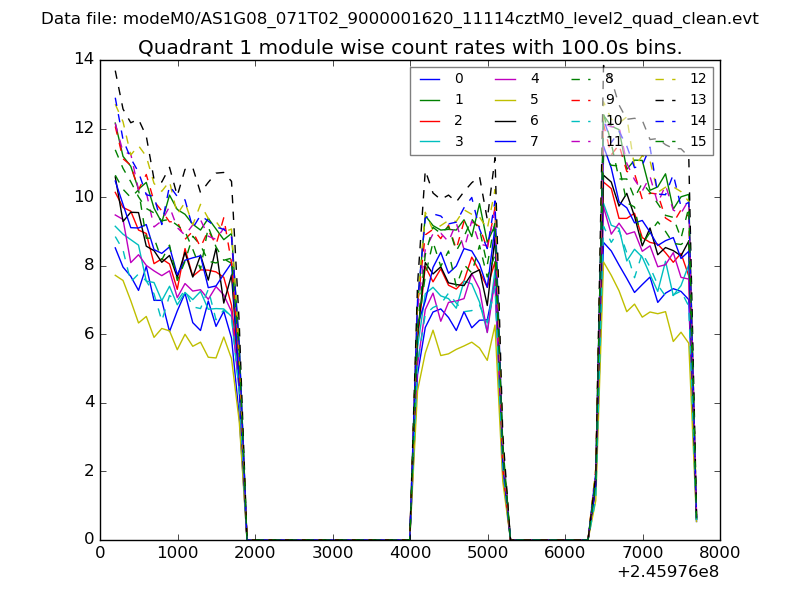
| Module-wise count rates for Quadrant A Data is divided into 100 sec bins |
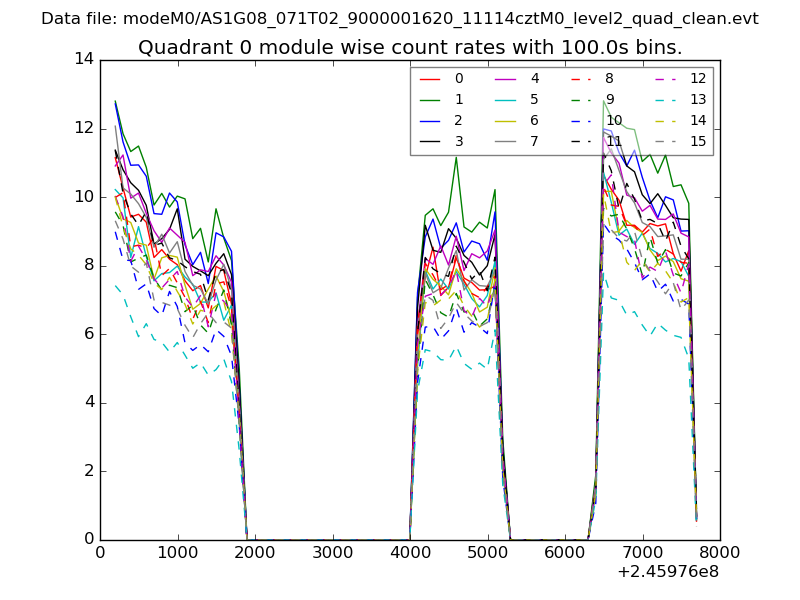 |
 |
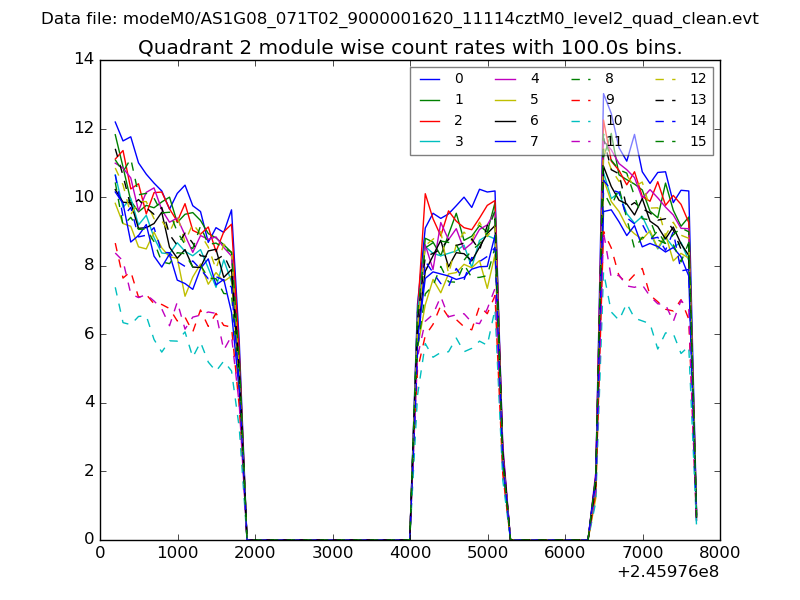
| Module-wise count rates for Quadrant B Data is divided into 100 sec bins |
 |
 |
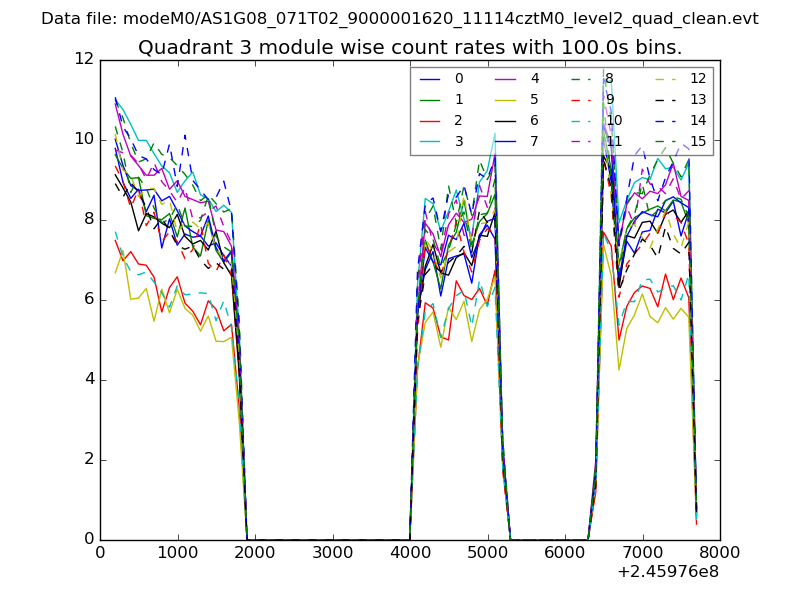
| Module-wise count rates for Quadrant C Data is divided into 100 sec bins |
 |
 |
| Module-wise count rates for Quadrant D Data is divided into 100 sec bins |
 |
 |
| Parameter | Plot |
|---|---|
| CZT HV Monitor | 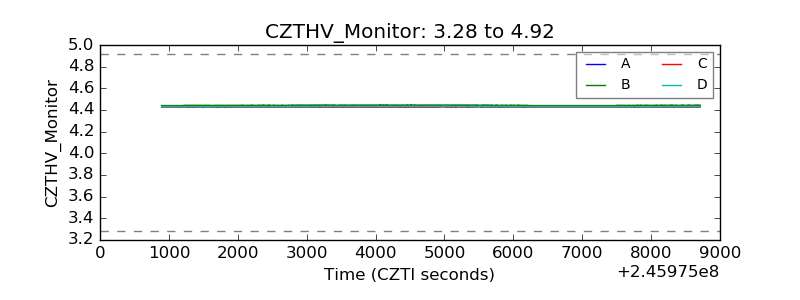 |
| D_VDD | 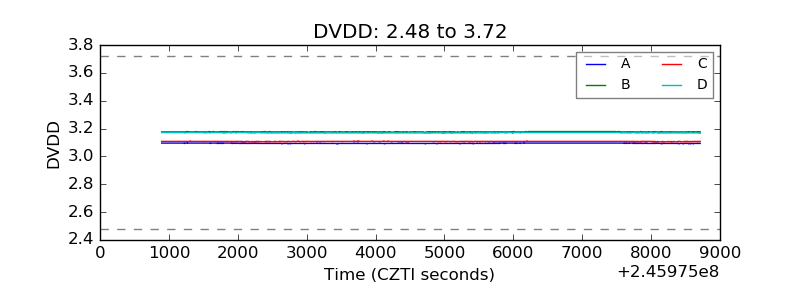 |
| Temperature 1 | 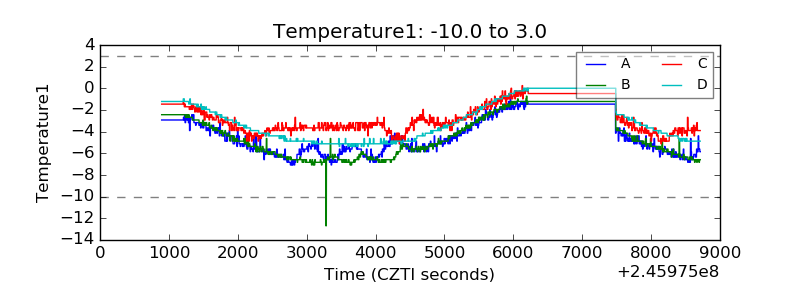 |
| Veto HV Monitor | 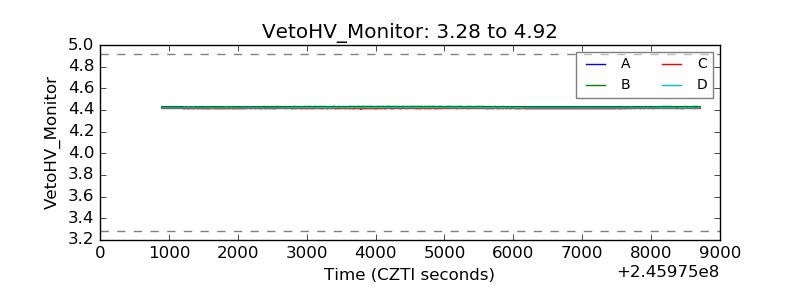 |
| Veto LLD |  |
| Alpha Counter | 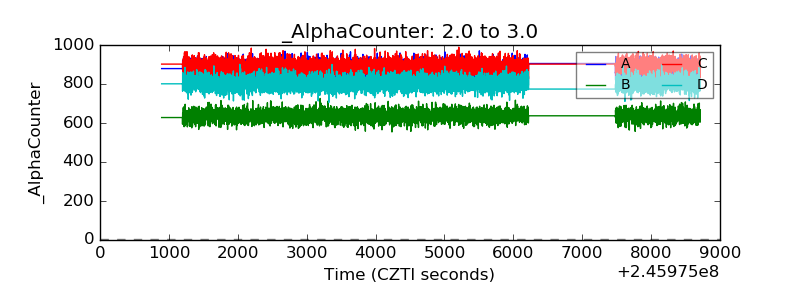 |
| _CPM_Rate | 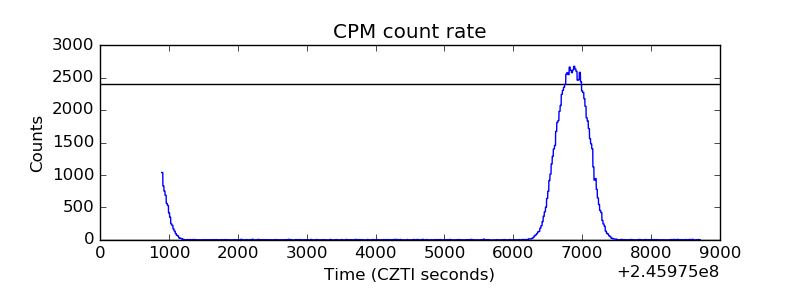 |
| CZT Counter | 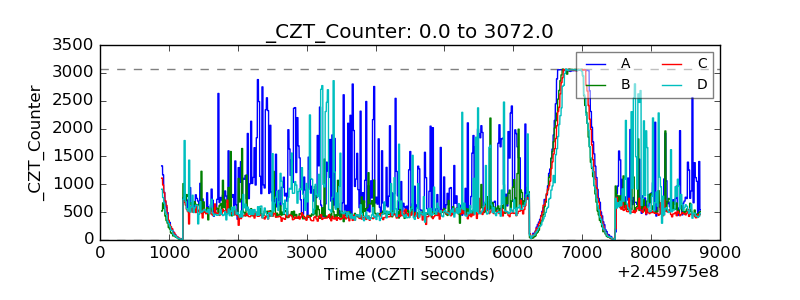 |
| +2.5 Volts monitor |  |
| +5 Volts monitor |  |
| _ROLL_ROT | 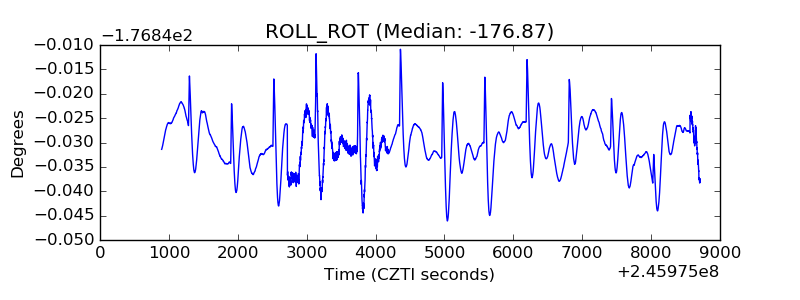 |
| _Roll_DEC | 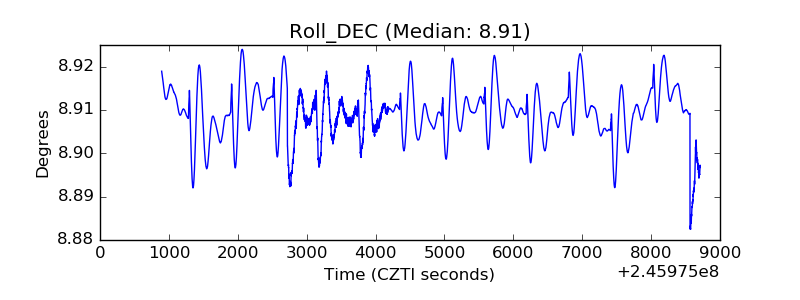 |
| _Roll_RA | 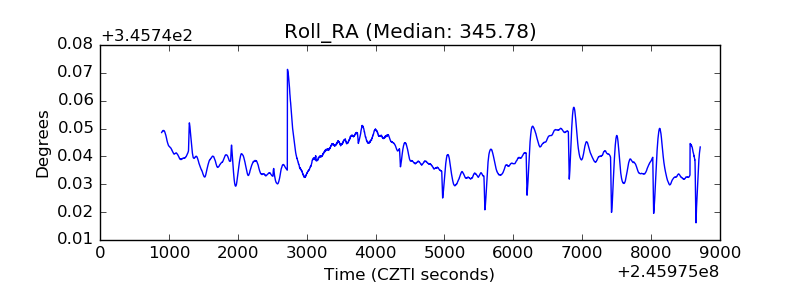 |
| Veto Counter | 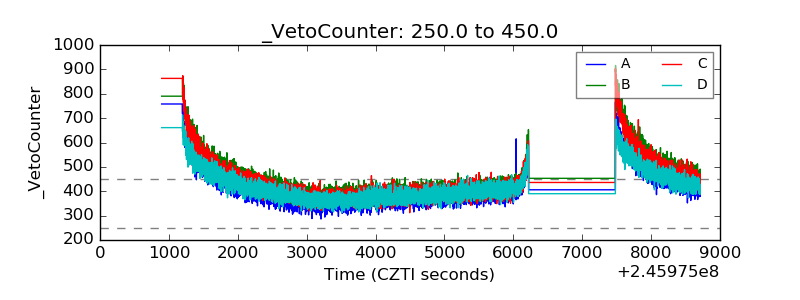 |