| Param | Original file | Final file |
|---|---|---|
| Filename | modeM0/AS1G08_071T02_9000001620_11115cztM0_level2.evt | modeM0/AS1G08_071T02_9000001620_11115cztM0_level2_quad_clean.evt |
| Size (bytes) | 576,475,200 | 78,200,640 |
| Size | 549.8 MB | 74.6 MB |
| Events in quadrant A | 5,592,797 | 483,010 |
| Events in quadrant B | 3,664,585 | 510,602 |
| Events in quadrant C | 2,939,156 | 497,453 |
| Events in quadrant D | 4,846,921 | 448,469 |
| Mode SS | |||
|---|---|---|---|
| Quadrant | BADHDUFLAG | Total packets | Discarded packets |
| A | 0 | 126 | 0 |
| B | 0 | 126 | 0 |
| C | 0 | 126 | 0 |
| D | 0 | 126 | 0 |
| Mode M9 | |||
|---|---|---|---|
| Quadrant | BADHDUFLAG | Total packets | Discarded packets |
| A | 0 | 15 | 0 |
| B | 0 | 15 | 0 |
| C | 0 | 15 | 0 |
| D | 0 | 16 | 0 |
| Mode M0 | |||
|---|---|---|---|
| Quadrant | BADHDUFLAG | Total packets | Discarded packets |
| A | 0 | 20833 | 3 |
| B | 0 | 14779 | 2 |
| C | 0 | 12604 | 2 |
| D | 0 | 18552 | 2 |
| Quadrant | Total seconds | Saturated seconds | Saturation percentage |
|---|---|---|---|
| A | 6131 | 469 | 7.649649% |
| B | 6131 | 96 | 1.565813% |
| C | 6131 | 13 | 0.212037% |
| D | 6131 | 459 | 7.486544% |
Noise dominated data is calculated using 1-second bins in cleaned event files. If a bin has >2000 counts, and if more than 50% of those come from <1% of pixels, then it is considered to be noise-dominated and hence unusable.
| Quadrant | # 1 sec bins | Bins with >0 counts | Bins with >2000 counts | High rate bins dominated by noise | Noise dominated (total time) | Noise dominated (detector-on time) | Marked lightcurve |
|---|---|---|---|---|---|---|---|
| A | 7461 | 6132 | 345 | 345 | 4.62% | 5.63% | 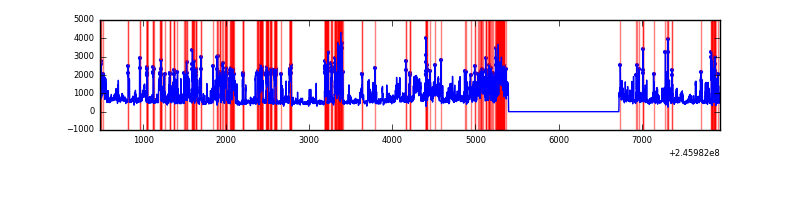 |
| B | 7461 | 6132 | 61 | 61 | 0.82% | 0.99% | 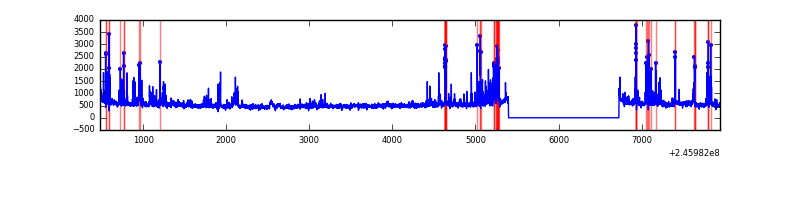 |
| C | 7461 | 6132 | 8 | 8 | 0.11% | 0.13% | 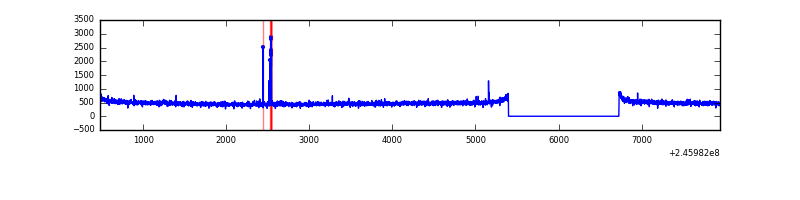 |
| D | 7461 | 6132 | 404 | 404 | 5.41% | 6.59% | 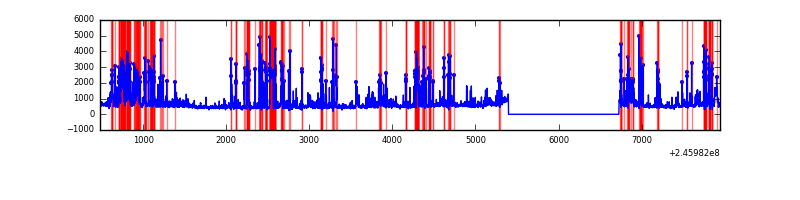 |
Top three noisy pixels from each quadrant. If the there are fewer than three noisy pixels in the level2.evt file, extra rows are filled as -1
| Pixel properties | Quadrant properties | ||||||
|---|---|---|---|---|---|---|---|
| Quadrant | DetID | PixID | Counts | Sigma | Mean | Median | Sigma |
| A | 8 | 5 | 2444754 | 16170.06 | 750 | 734 | 151.1 |
| A | 8 | 15 | 217524 | 1434.32 | 750 | 734 | 151.1 |
| A | 11 | 29 | 20666 | 131.87 | 750 | 734 | 151.1 |
| B | 4 | 239 | 456173 | 3118.27 | 774 | 759 | 146.0 |
| B | 0 | 187 | 31521 | 210.63 | 774 | 759 | 146.0 |
| B | 0 | 219 | 30737 | 205.26 | 774 | 759 | 146.0 |
| C | 14 | 234 | 32695 | 185.31 | 745 | 752 | 172.4 |
| C | 13 | 61 | 5461 | 27.32 | 745 | 752 | 172.4 |
| C | 5 | 32 | 3495 | 15.91 | 745 | 752 | 172.4 |
| D | 10 | 253 | 821605 | 4786.22 | 707 | 687 | 171.5 |
| D | 1 | 52 | 515467 | 3001.34 | 707 | 687 | 171.5 |
| D | 2 | 120 | 302653 | 1760.56 | 707 | 687 | 171.5 |
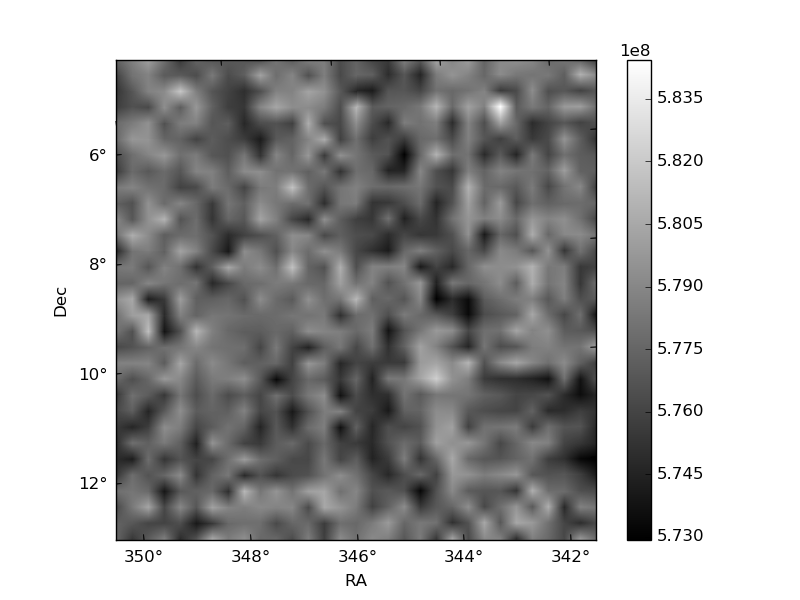
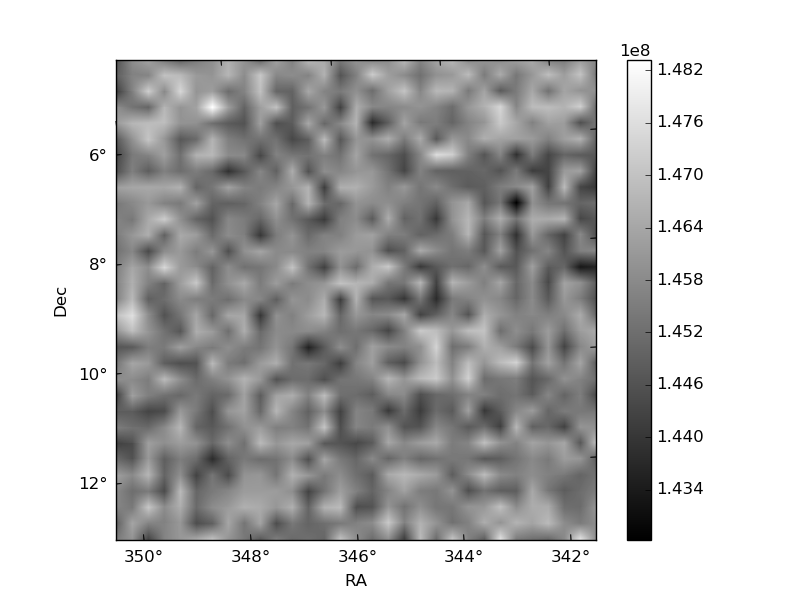
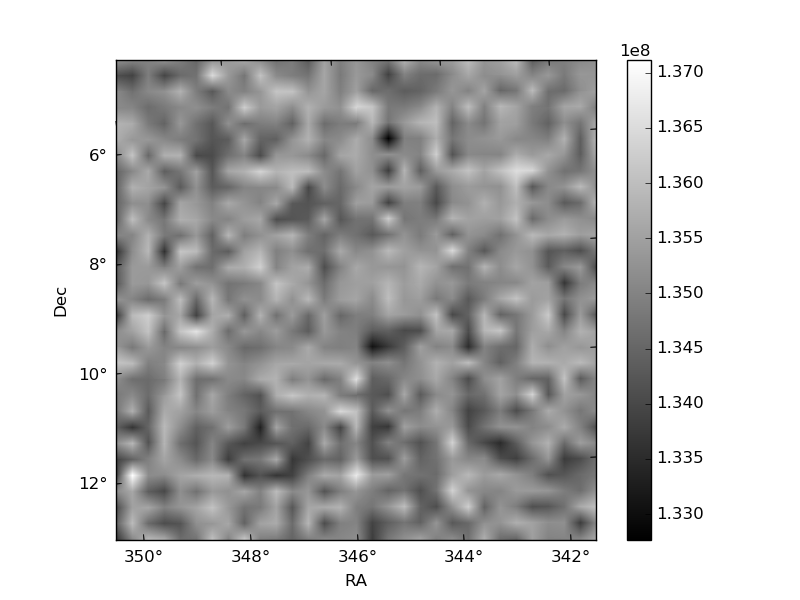
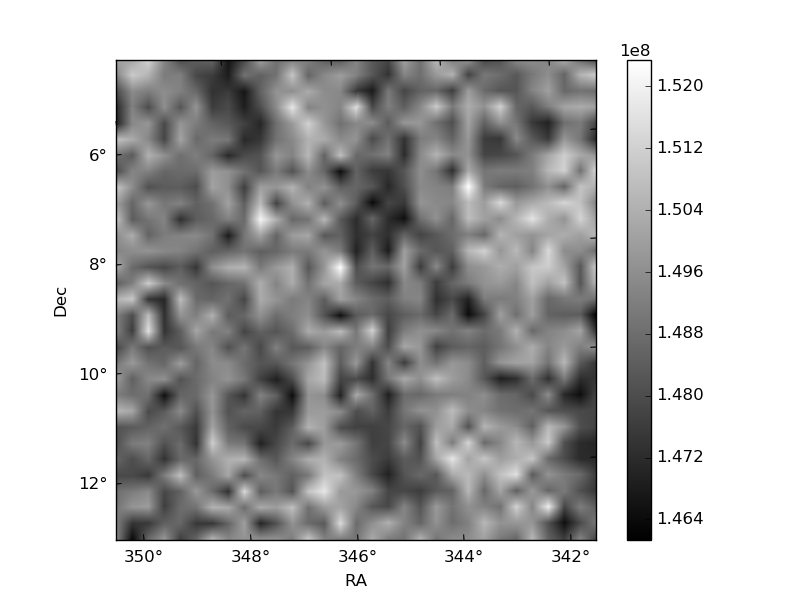
Histogram calculated using DETX and DETY for each event in the final _common_clean file
| Quadrant A | 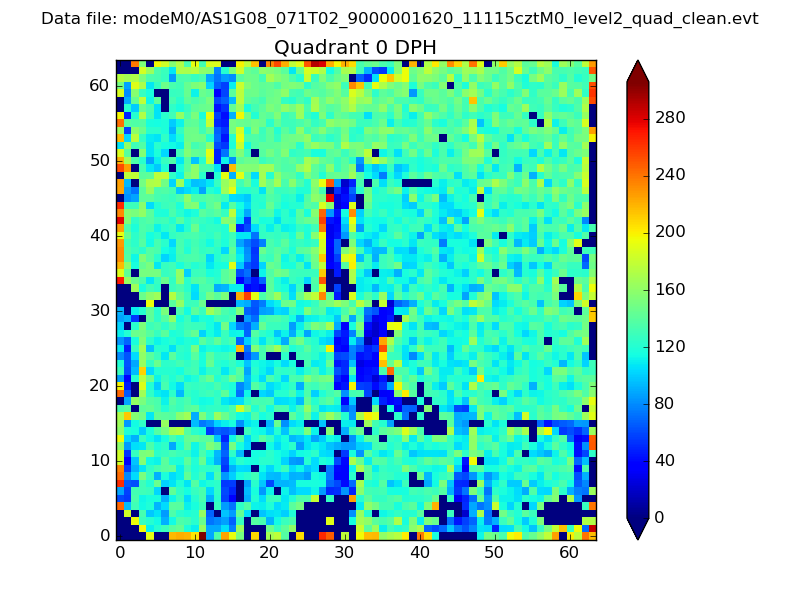 |
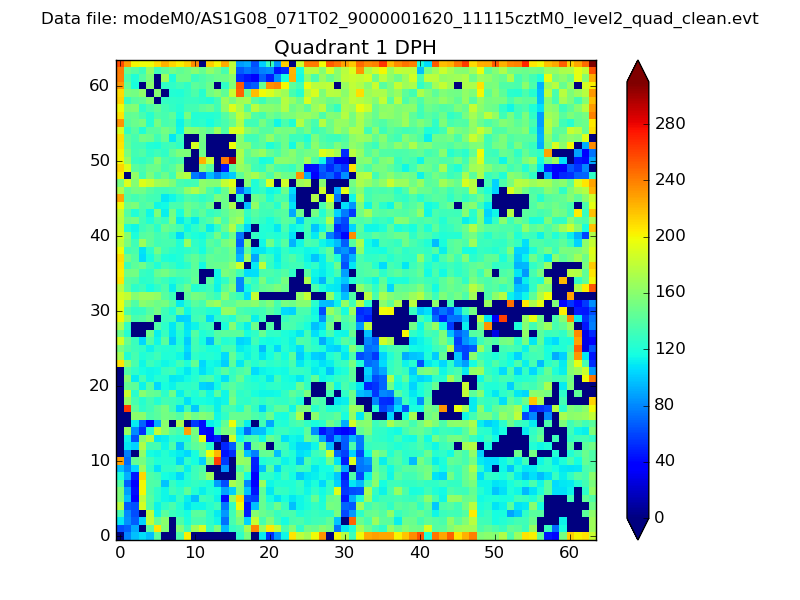 |
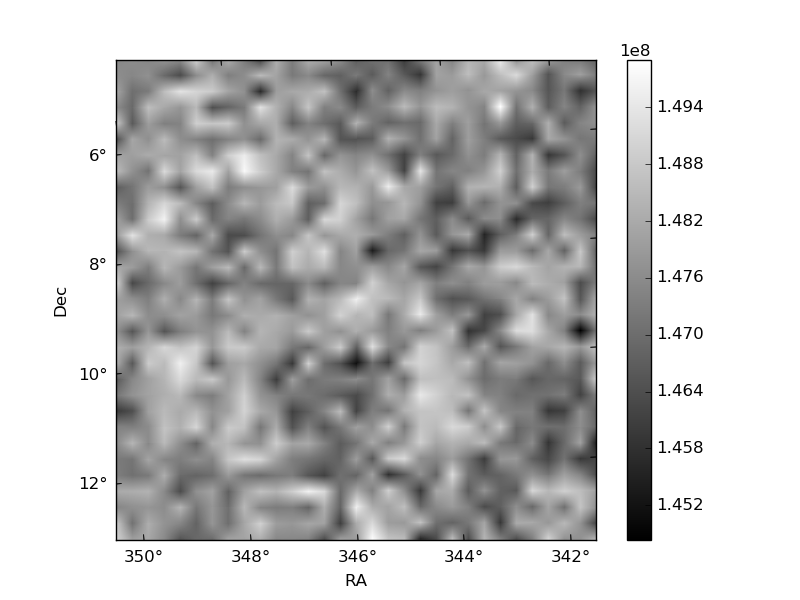
Quadrant B |
|---|---|---|---|
| Quadrant D | 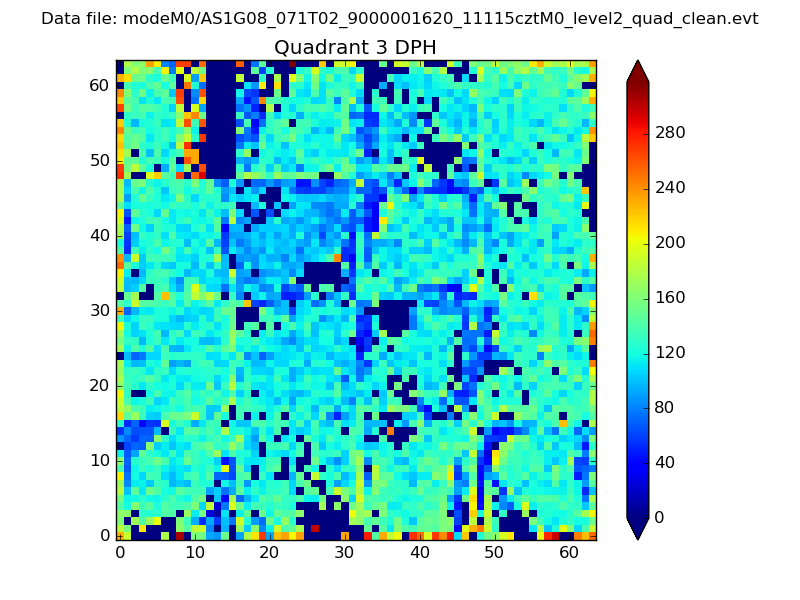 |
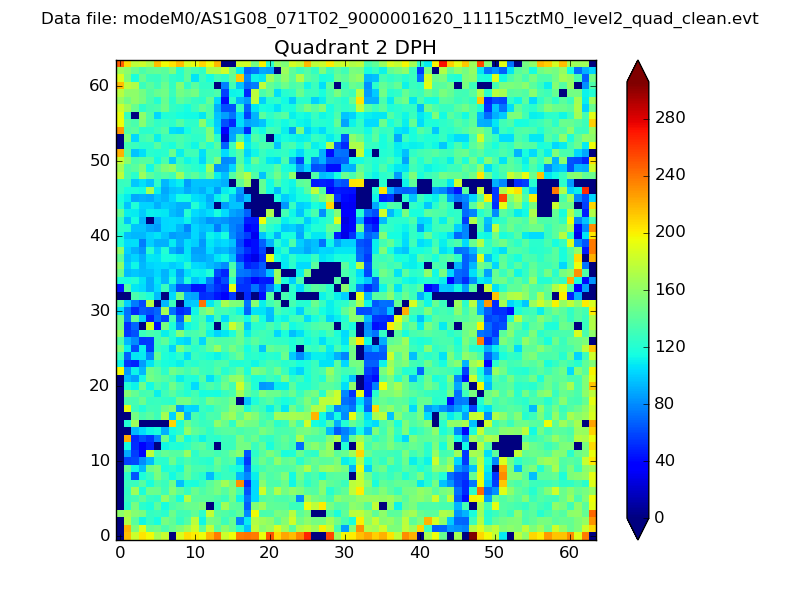 |
Quadrant C |
| Plot type | Count rate plots | Images |
|---|---|---|
| Comparison with Poisson distribution Blue bars denote a histogram of data divided into 1 sec bins. Red curve is a Poisson curve with rate = median count rate of data. |
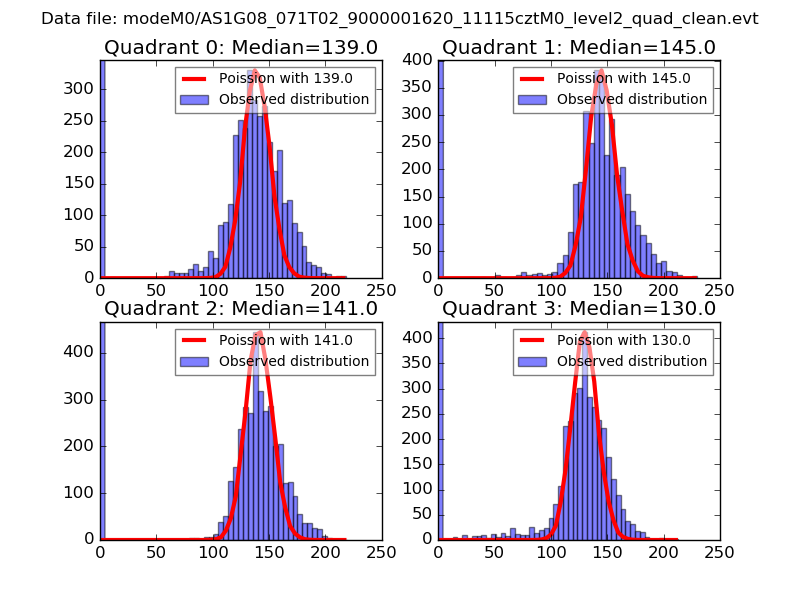 |
 |
| Quadrant-wise count rates Data is divided into 100 sec bins |
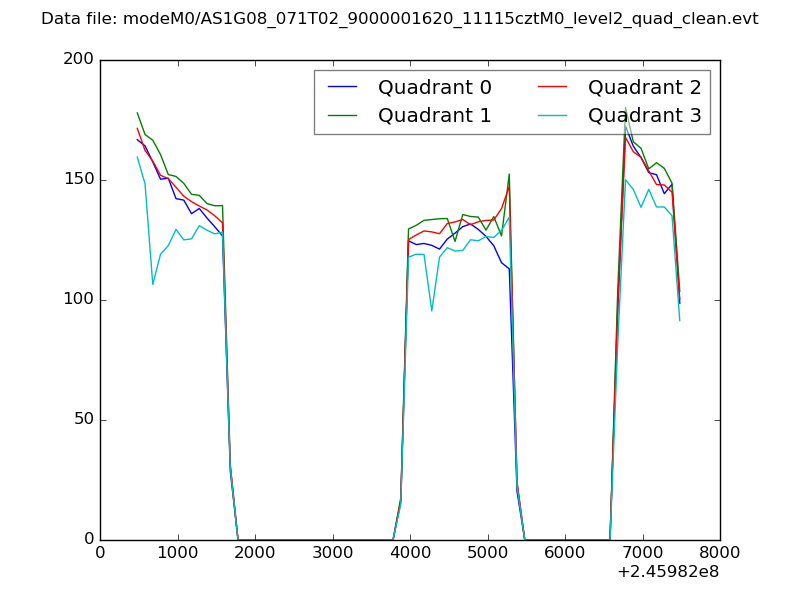 |
|
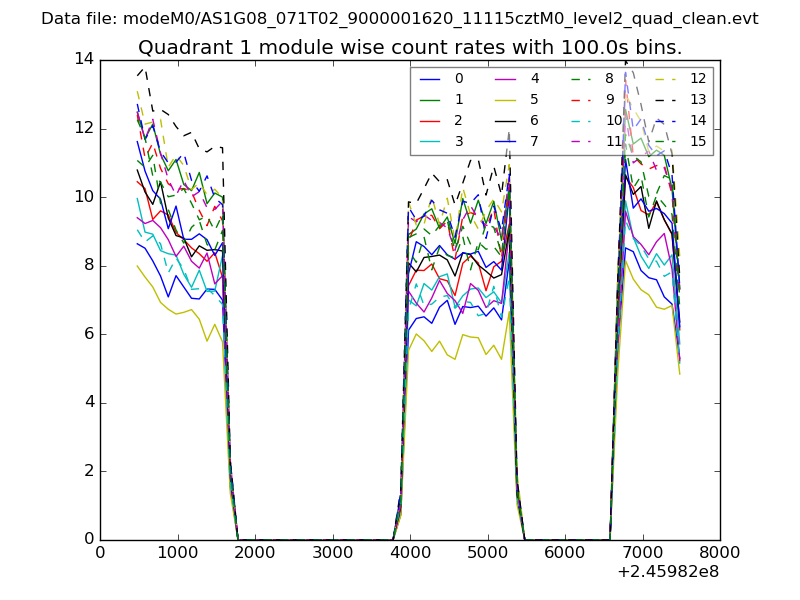
| Module-wise count rates for Quadrant A Data is divided into 100 sec bins |
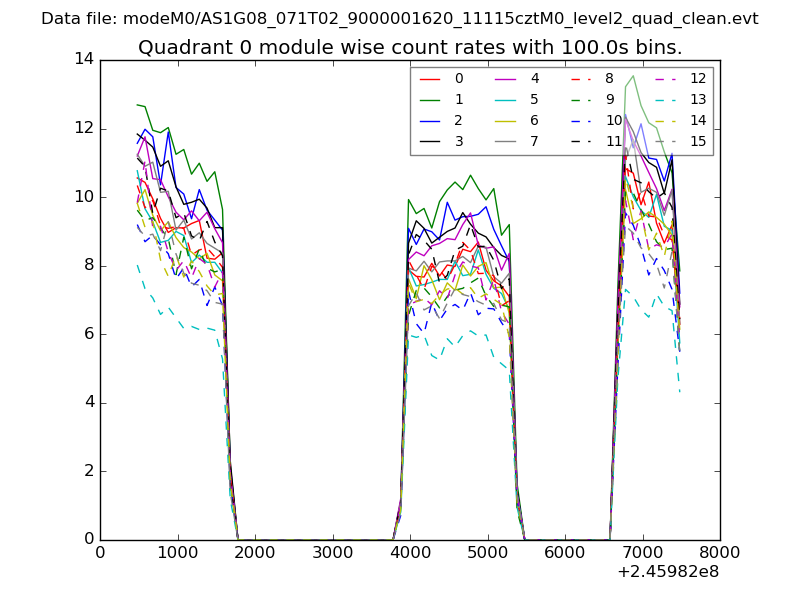 |
 |
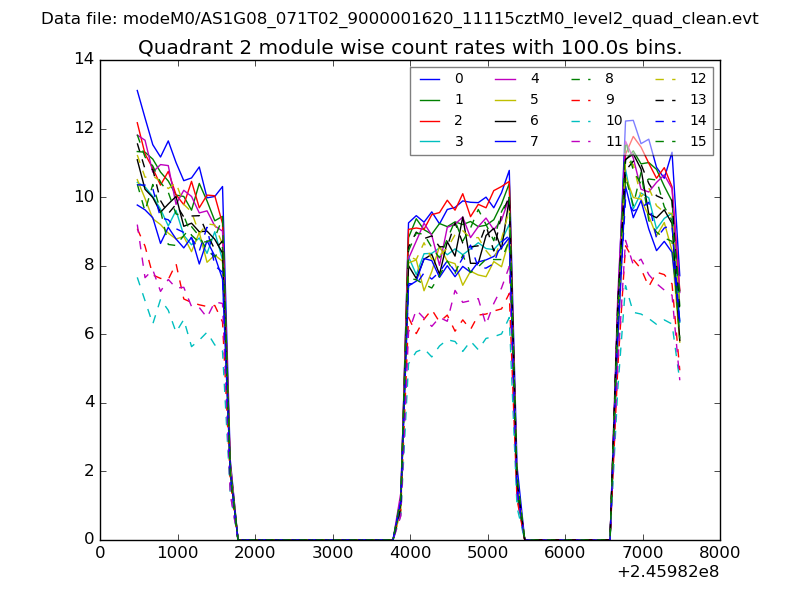
| Module-wise count rates for Quadrant B Data is divided into 100 sec bins |
 |
 |
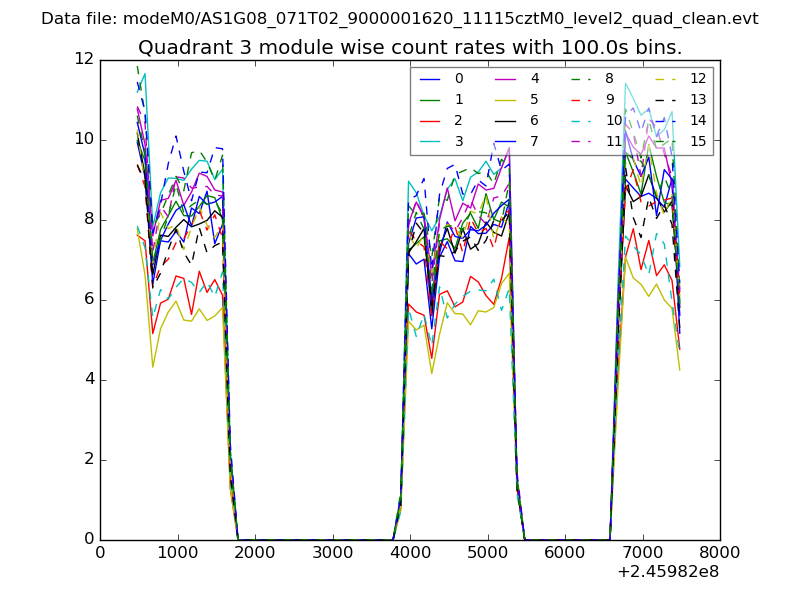
| Module-wise count rates for Quadrant C Data is divided into 100 sec bins |
 |
 |
| Module-wise count rates for Quadrant D Data is divided into 100 sec bins |
 |
 |
| Parameter | Plot |
|---|---|
| CZT HV Monitor | 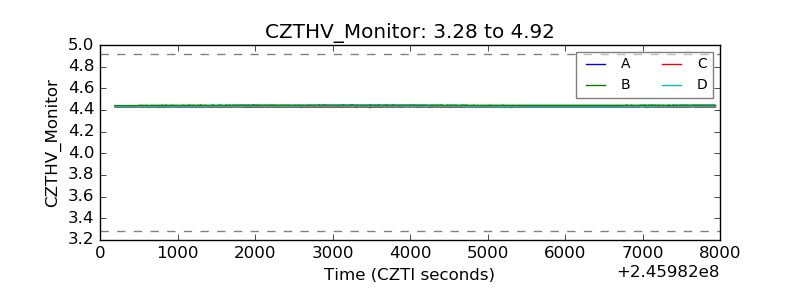 |
| D_VDD | 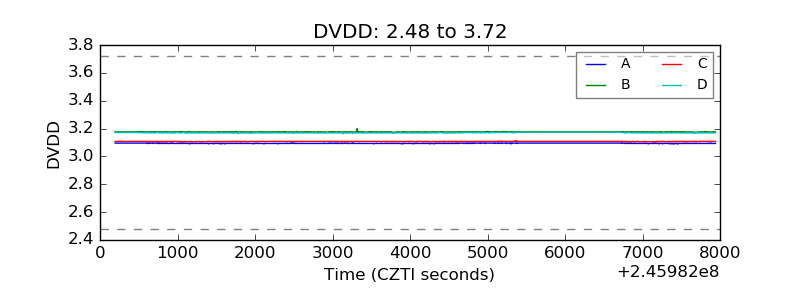 |
| Temperature 1 |  |
| Veto HV Monitor | 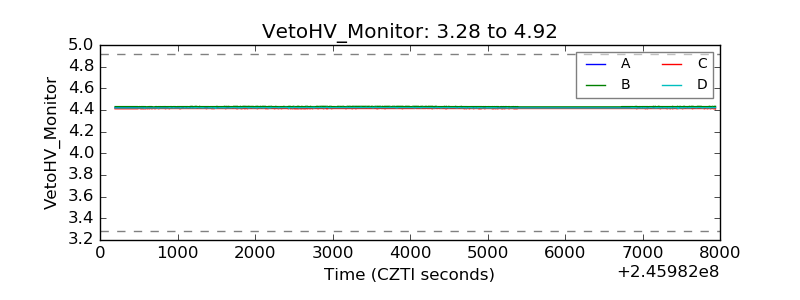 |
| Veto LLD | 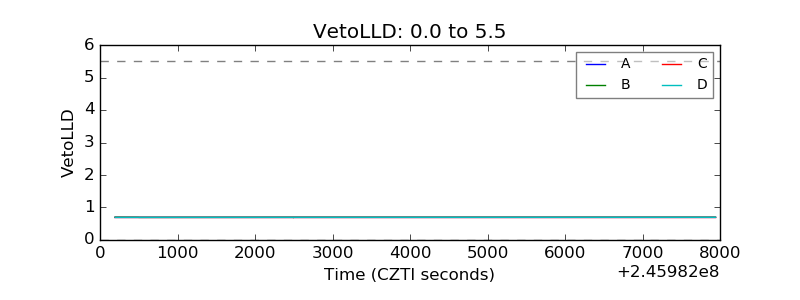 |
| Alpha Counter | 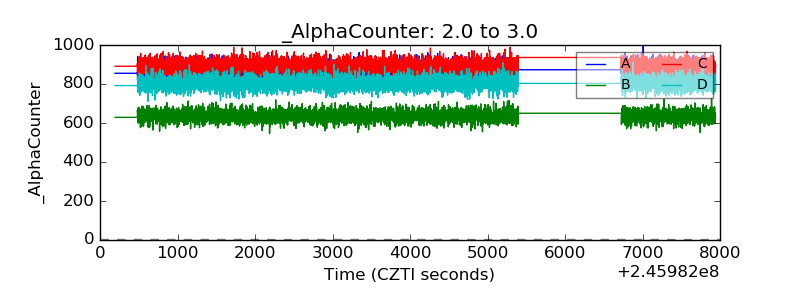 |
| _CPM_Rate | 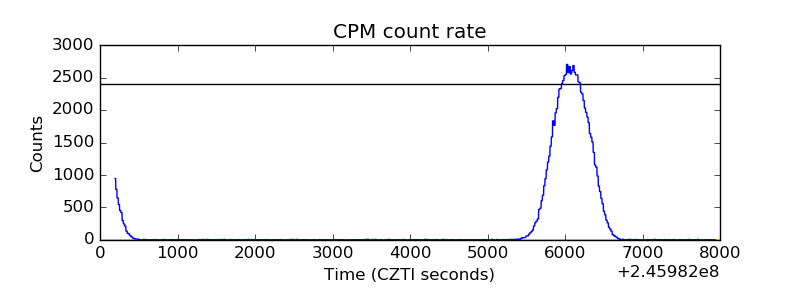 |
| CZT Counter | 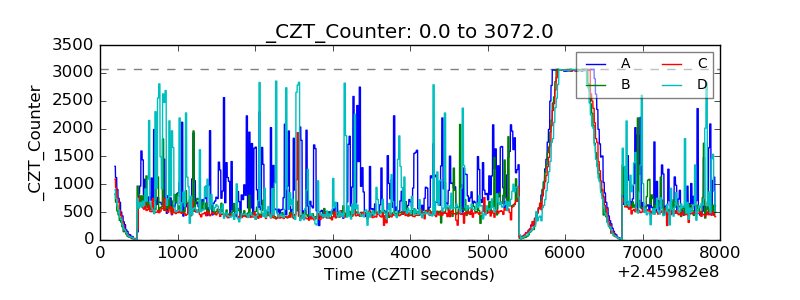 |
| +2.5 Volts monitor |  |
| +5 Volts monitor |  |
| _ROLL_ROT | 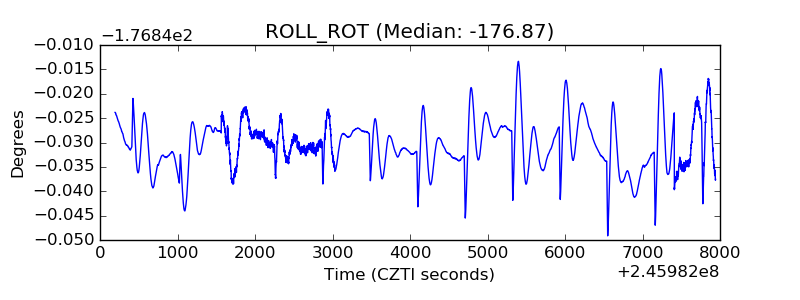 |
| _Roll_DEC | 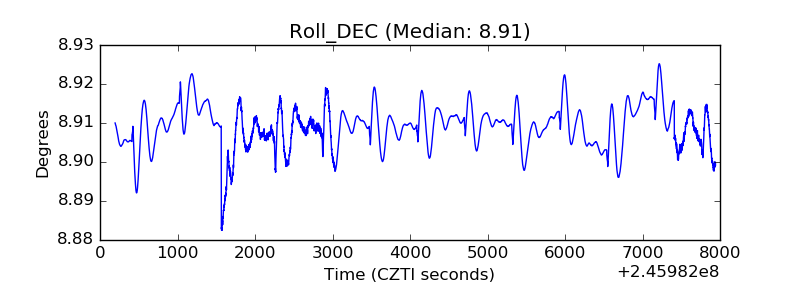 |
| _Roll_RA | 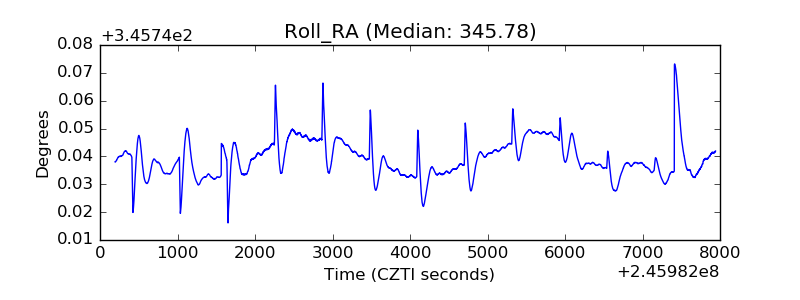 |
| Veto Counter | 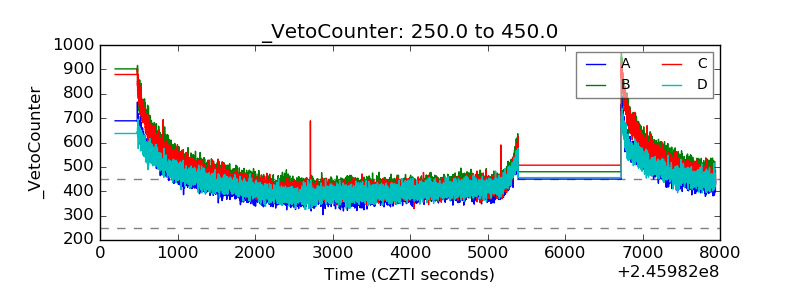 |