| Param | Original file | Final file |
|---|---|---|
| Filename | modeM0/AS1G08_071T02_9000001620_11118cztM0_level2.evt | modeM0/AS1G08_071T02_9000001620_11118cztM0_level2_quad_clean.evt |
| Size (bytes) | 562,426,560 | 63,725,760 |
| Size | 536.4 MB | 60.8 MB |
| Events in quadrant A | 4,271,526 | 370,239 |
| Events in quadrant B | 4,034,714 | 367,780 |
| Events in quadrant C | 3,104,458 | 376,428 |
| Events in quadrant D | 5,172,483 | 351,932 |
| Mode SS | |||
|---|---|---|---|
| Quadrant | BADHDUFLAG | Total packets | Discarded packets |
| A | 0 | 134 | 0 |
| B | 0 | 134 | 0 |
| C | 0 | 134 | 0 |
| D | 0 | 134 | 0 |
| Mode M9 | |||
|---|---|---|---|
| Quadrant | BADHDUFLAG | Total packets | Discarded packets |
| A | 0 | 18 | 0 |
| B | 0 | 18 | 0 |
| C | 0 | 18 | 0 |
| D | 0 | 19 | 0 |
| Mode M0 | |||
|---|---|---|---|
| Quadrant | BADHDUFLAG | Total packets | Discarded packets |
| A | 0 | 16813 | 3 |
| B | 0 | 16122 | 2 |
| C | 0 | 13648 | 2 |
| D | 0 | 19796 | 2 |
| Quadrant | Total seconds | Saturated seconds | Saturation percentage |
|---|---|---|---|
| A | 6640 | 254 | 3.825301% |
| B | 6640 | 287 | 4.322289% |
| C | 6640 | 31 | 0.466867% |
| D | 6640 | 538 | 8.102410% |
Noise dominated data is calculated using 1-second bins in cleaned event files. If a bin has >2000 counts, and if more than 50% of those come from <1% of pixels, then it is considered to be noise-dominated and hence unusable.
| Quadrant | # 1 sec bins | Bins with >0 counts | Bins with >2000 counts | High rate bins dominated by noise | Noise dominated (total time) | Noise dominated (detector-on time) | Marked lightcurve |
|---|---|---|---|---|---|---|---|
| A | 7680 | 6641 | 164 | 164 | 2.14% | 2.47% | 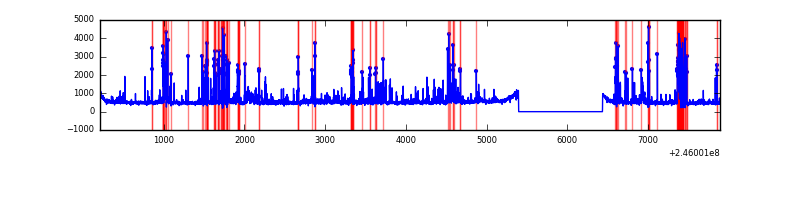 |
| B | 7680 | 6641 | 174 | 174 | 2.27% | 2.62% | 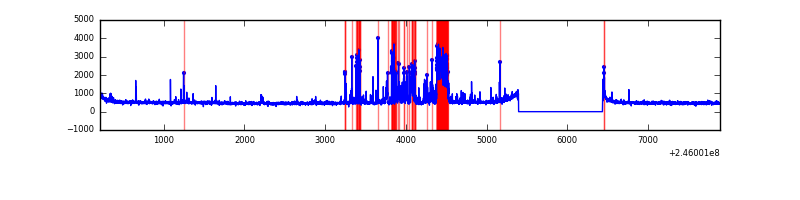 |
| C | 7680 | 6641 | 0 | 0 | 0.00% | 0.00% | 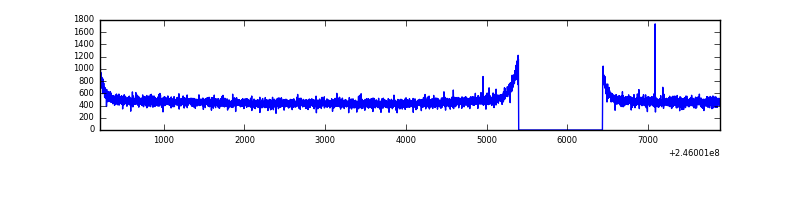 |
| D | 7680 | 6641 | 461 | 461 | 6.00% | 6.94% | 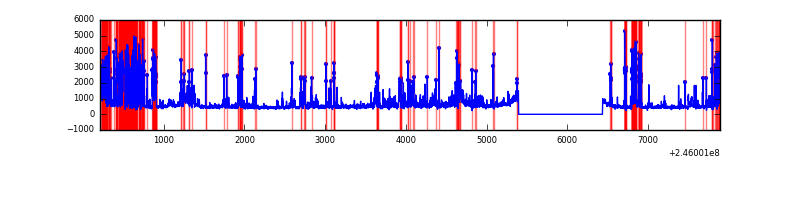 |
Top three noisy pixels from each quadrant. If the there are fewer than three noisy pixels in the level2.evt file, extra rows are filled as -1
| Pixel properties | Quadrant properties | ||||||
|---|---|---|---|---|---|---|---|
| Quadrant | DetID | PixID | Counts | Sigma | Mean | Median | Sigma |
| A | 8 | 5 | 1070608 | 6509.6 | 809 | 790 | 164.3 |
| A | 8 | 15 | 44944 | 268.67 | 809 | 790 | 164.3 |
| A | 14 | 254 | 11740 | 66.63 | 809 | 790 | 164.3 |
| B | 4 | 239 | 707613 | 4554.82 | 814 | 794 | 155.2 |
| B | 3 | 189 | 69445 | 442.39 | 814 | 794 | 155.2 |
| B | 15 | 204 | 38127 | 240.58 | 814 | 794 | 155.2 |
| C | 13 | 61 | 5807 | 26.88 | 795 | 801 | 186.2 |
| C | 12 | 4 | 4109 | 17.77 | 795 | 801 | 186.2 |
| C | 3 | 202 | 1909 | 5.95 | 795 | 801 | 186.2 |
| D | 10 | 253 | 1241473 | 6728.99 | 751 | 729 | 184.4 |
| D | 1 | 52 | 440067 | 2382.68 | 751 | 729 | 184.4 |
| D | 13 | 249 | 200602 | 1083.98 | 751 | 729 | 184.4 |
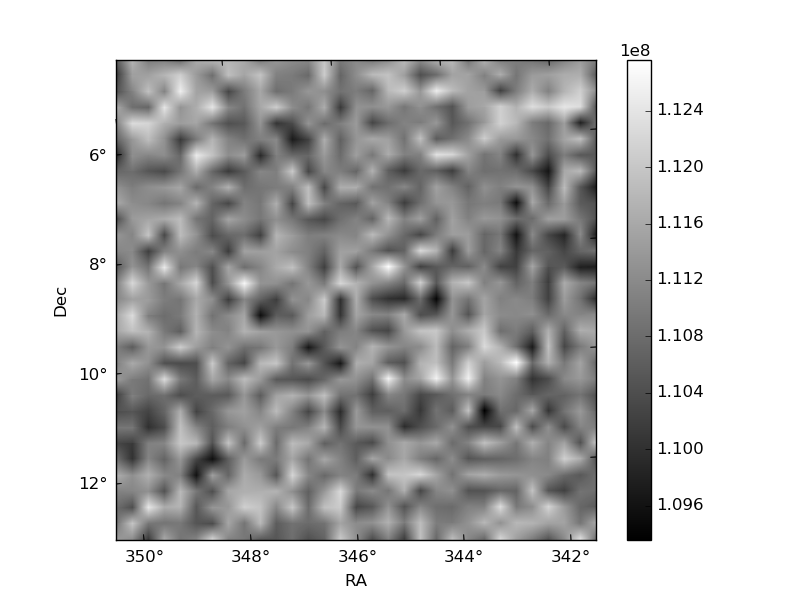
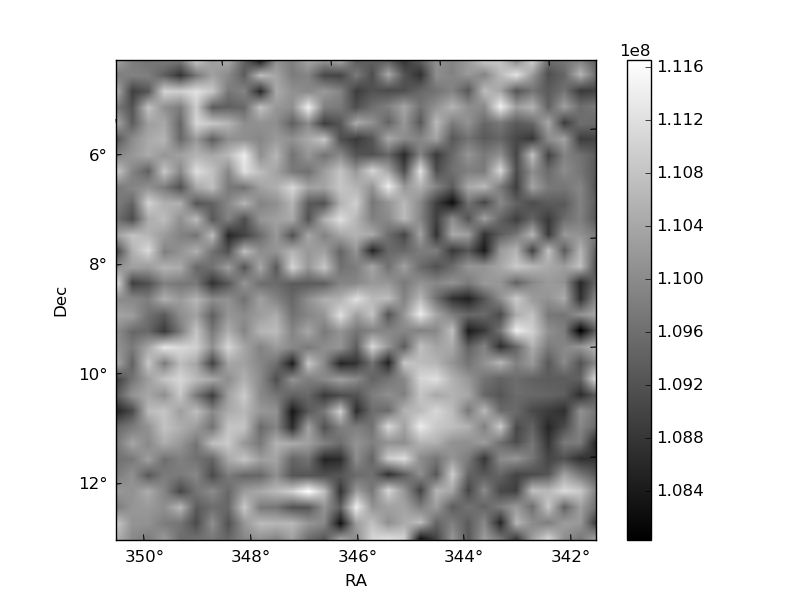
Histogram calculated using DETX and DETY for each event in the final _common_clean file
| Quadrant A |  |
 |
Quadrant B |
|---|---|---|---|
| Quadrant D |  |
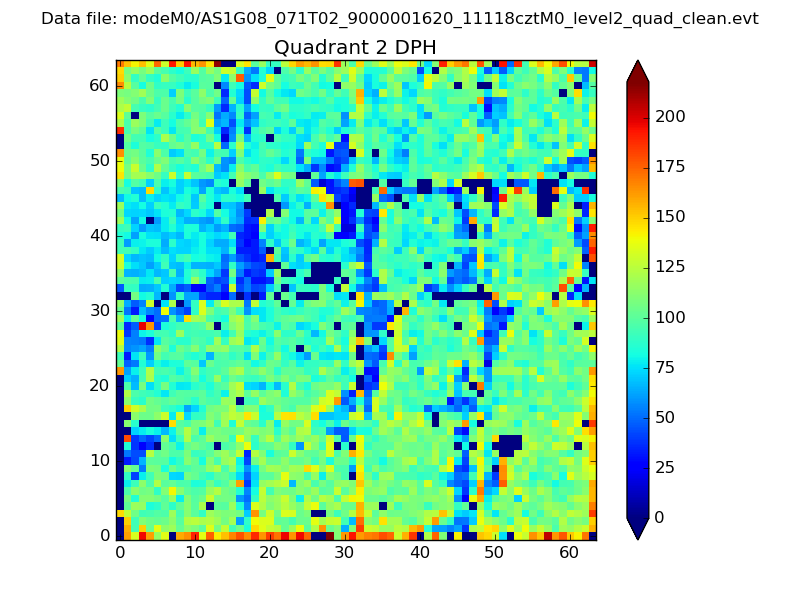 |
Quadrant C |
| Plot type | Count rate plots | Images |
|---|---|---|
| Comparison with Poisson distribution Blue bars denote a histogram of data divided into 1 sec bins. Red curve is a Poisson curve with rate = median count rate of data. |
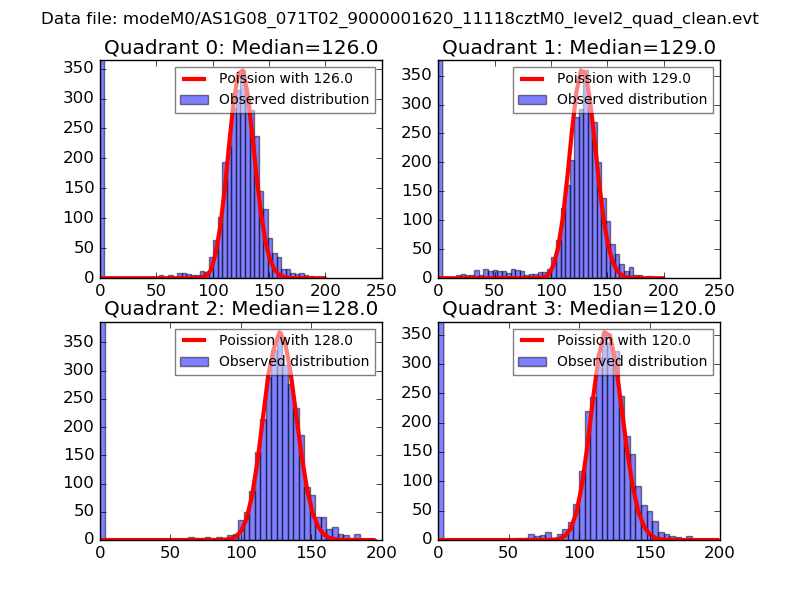 |
 |
| Quadrant-wise count rates Data is divided into 100 sec bins |
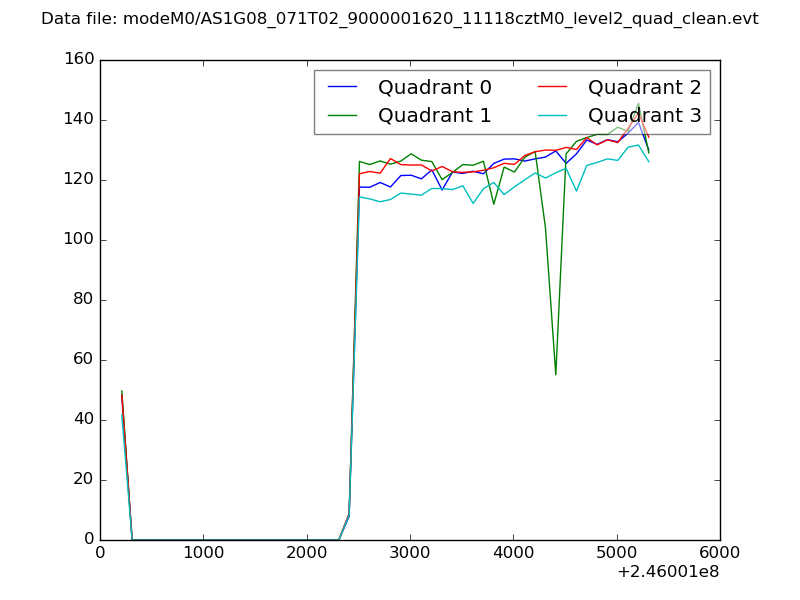 |
|
| Module-wise count rates for Quadrant A Data is divided into 100 sec bins |
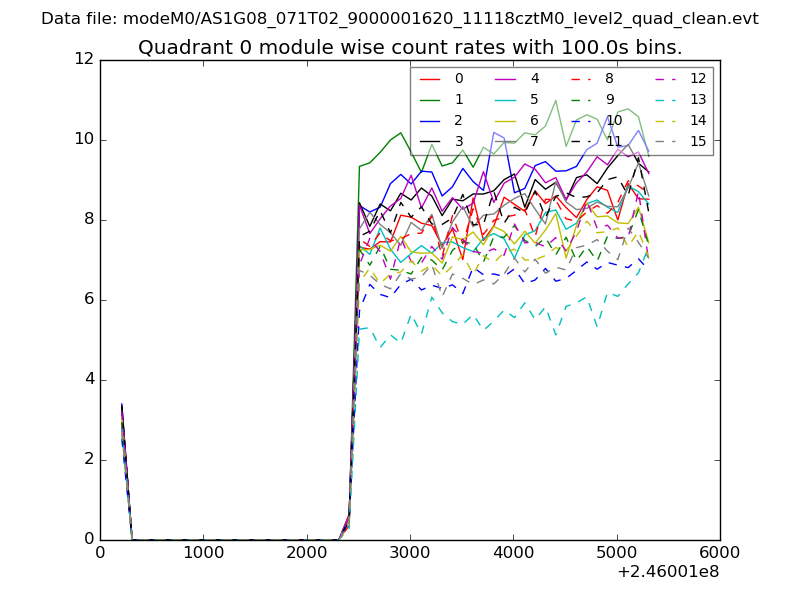 |
 |
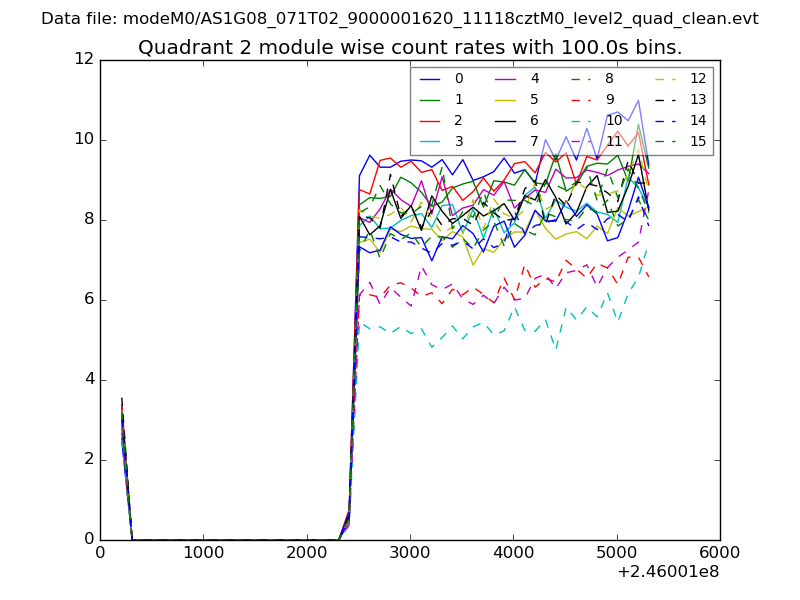
| Module-wise count rates for Quadrant B Data is divided into 100 sec bins |
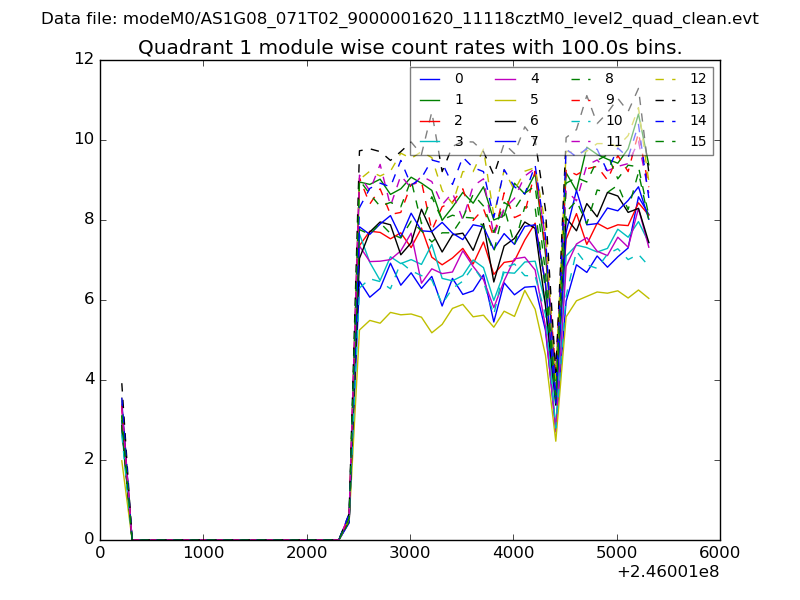 |
 |
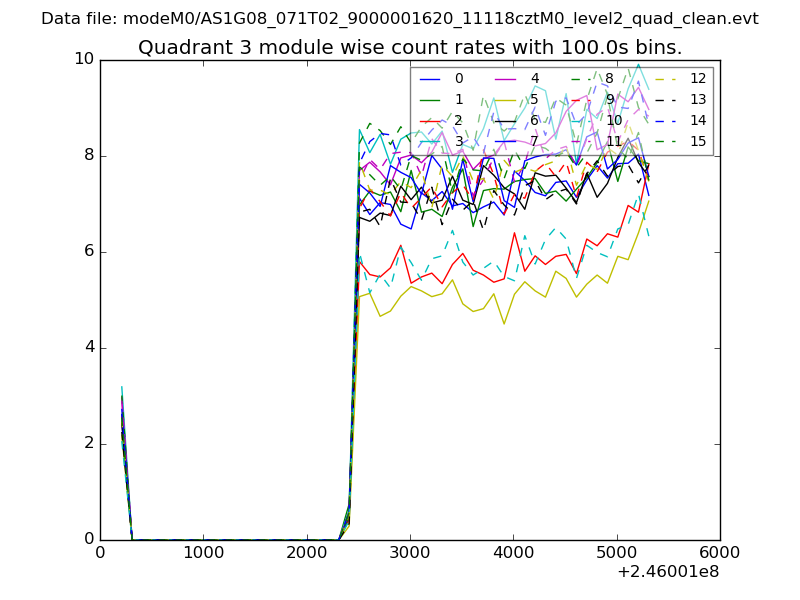
| Module-wise count rates for Quadrant C Data is divided into 100 sec bins |
 |
 |
| Module-wise count rates for Quadrant D Data is divided into 100 sec bins |
 |
 |
| Parameter | Plot |
|---|---|
| CZT HV Monitor | 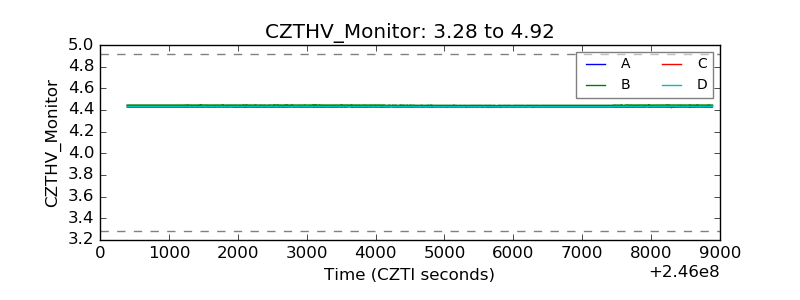 |
| D_VDD | 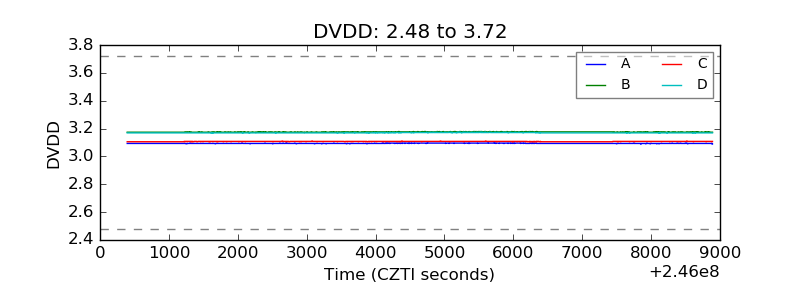 |
| Temperature 1 | 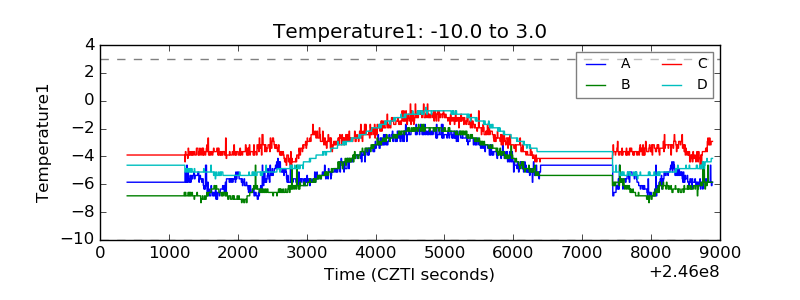 |
| Veto HV Monitor | 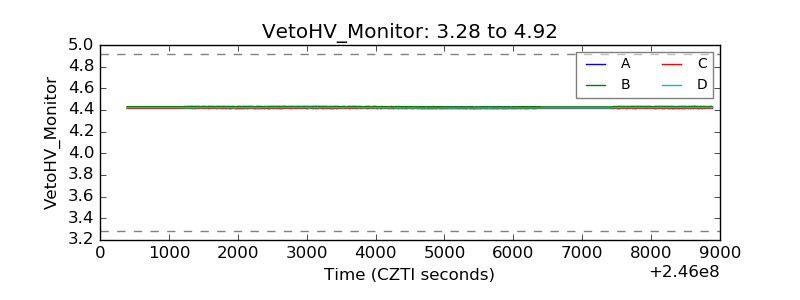 |
| Veto LLD | 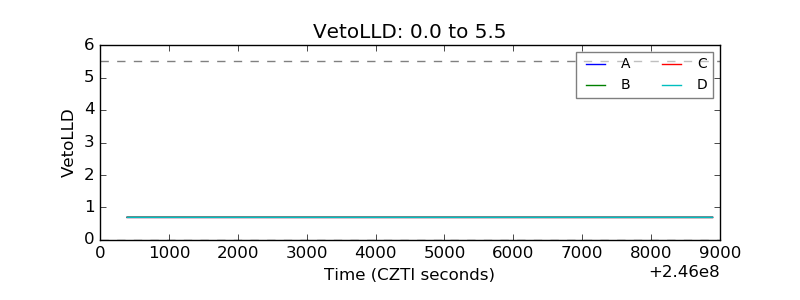 |
| Alpha Counter | 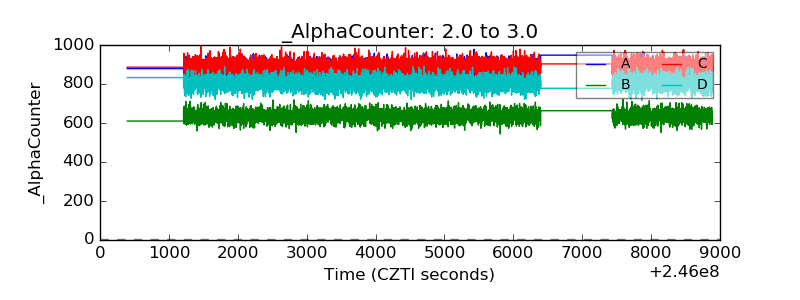 |
| _CPM_Rate | 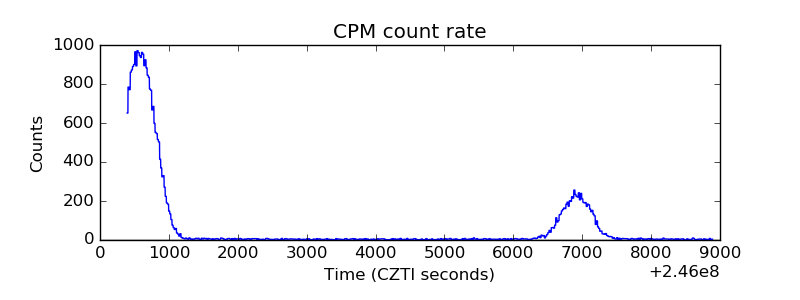 |
| CZT Counter | 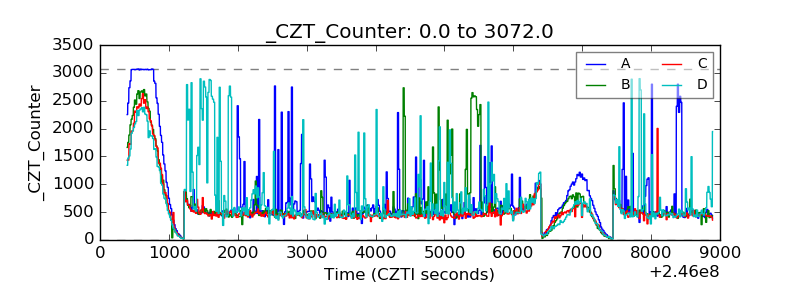 |
| +2.5 Volts monitor | 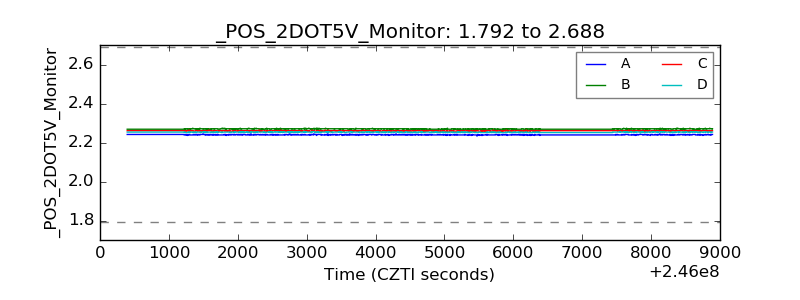 |
| +5 Volts monitor |  |
| _ROLL_ROT | 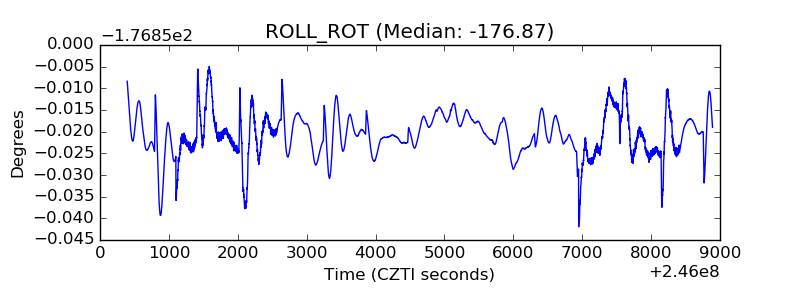 |
| _Roll_DEC | 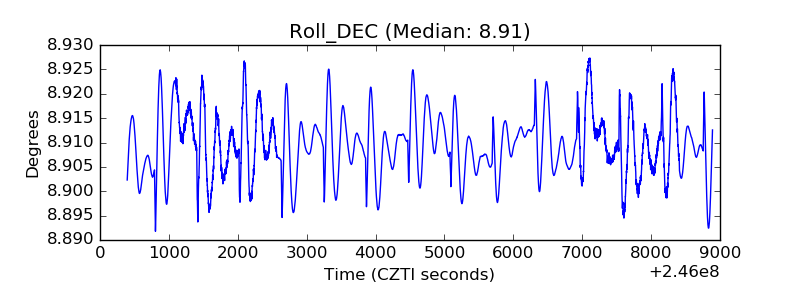 |
| _Roll_RA | 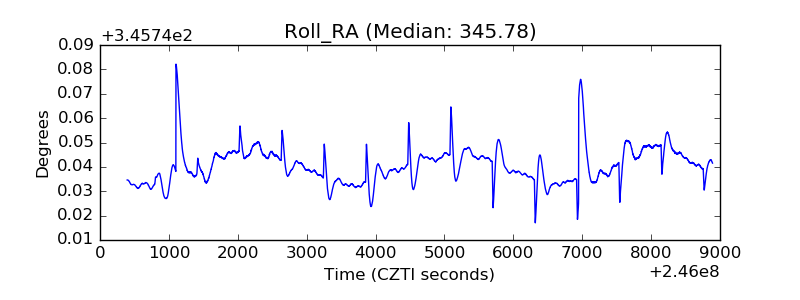 |
| Veto Counter | 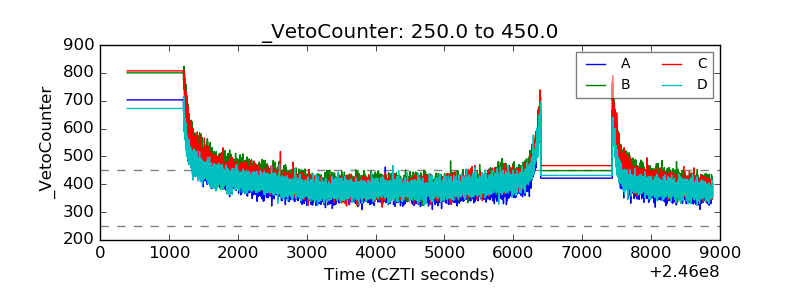 |