| Param | Original file | Final file |
|---|---|---|
| Filename | modeM0/AS1G08_071T02_9000001620_11119cztM0_level2.evt | modeM0/AS1G08_071T02_9000001620_11119cztM0_level2_quad_clean.evt |
| Size (bytes) | 574,254,720 | 73,782,720 |
| Size | 547.7 MB | 70.4 MB |
| Events in quadrant A | 4,464,327 | 436,290 |
| Events in quadrant B | 4,179,440 | 443,886 |
| Events in quadrant C | 3,289,379 | 444,152 |
| Events in quadrant D | 4,976,998 | 415,364 |
| Mode SS | |||
|---|---|---|---|
| Quadrant | BADHDUFLAG | Total packets | Discarded packets |
| A | 0 | 144 | 0 |
| B | 0 | 144 | 0 |
| C | 0 | 144 | 0 |
| D | 0 | 144 | 0 |
| Mode M9 | |||
|---|---|---|---|
| Quadrant | BADHDUFLAG | Total packets | Discarded packets |
| A | 0 | 6 | 0 |
| B | 0 | 6 | 0 |
| C | 0 | 6 | 0 |
| D | 0 | 7 | 0 |
| Mode M0 | |||
|---|---|---|---|
| Quadrant | BADHDUFLAG | Total packets | Discarded packets |
| A | 0 | 17754 | 3 |
| B | 0 | 16912 | 2 |
| C | 0 | 14626 | 2 |
| D | 0 | 19505 | 2 |
| Quadrant | Total seconds | Saturated seconds | Saturation percentage |
|---|---|---|---|
| A | 7097 | 378 | 5.326194% |
| B | 7097 | 261 | 3.677610% |
| C | 7097 | 74 | 1.042694% |
| D | 7097 | 460 | 6.481612% |
Noise dominated data is calculated using 1-second bins in cleaned event files. If a bin has >2000 counts, and if more than 50% of those come from <1% of pixels, then it is considered to be noise-dominated and hence unusable.
| Quadrant | # 1 sec bins | Bins with >0 counts | Bins with >2000 counts | High rate bins dominated by noise | Noise dominated (total time) | Noise dominated (detector-on time) | Marked lightcurve |
|---|---|---|---|---|---|---|---|
| A | 7722 | 7097 | 200 | 200 | 2.59% | 2.82% | 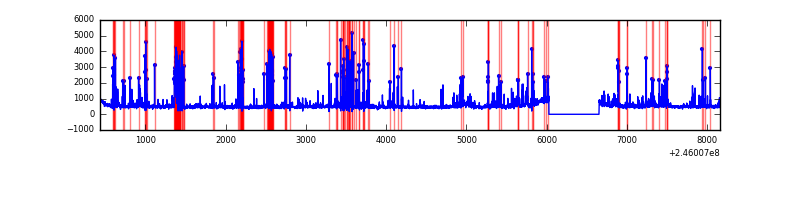 |
| B | 7722 | 7098 | 80 | 80 | 1.04% | 1.13% |  |
| C | 7722 | 7098 | 1 | 1 | 0.01% | 0.01% |  |
| D | 7722 | 7098 | 363 | 363 | 4.70% | 5.11% | 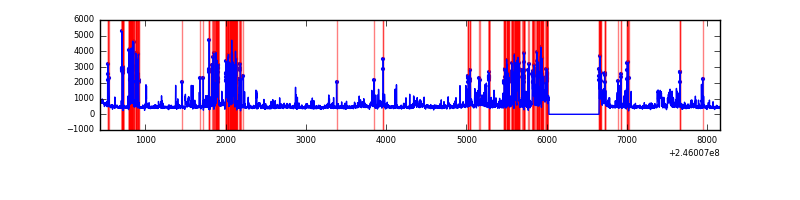 |
Top three noisy pixels from each quadrant. If the there are fewer than three noisy pixels in the level2.evt file, extra rows are filled as -1
| Pixel properties | Quadrant properties | ||||||
|---|---|---|---|---|---|---|---|
| Quadrant | DetID | PixID | Counts | Sigma | Mean | Median | Sigma |
| A | 8 | 5 | 1120421 | 6433.38 | 850 | 830 | 174.0 |
| A | 8 | 15 | 38810 | 218.24 | 850 | 830 | 174.0 |
| A | 15 | 174 | 15834 | 86.22 | 850 | 830 | 174.0 |
| B | 4 | 239 | 695239 | 4142.8 | 862 | 841 | 167.6 |
| B | 3 | 189 | 52053 | 305.53 | 862 | 841 | 167.6 |
| B | 15 | 204 | 33731 | 196.22 | 862 | 841 | 167.6 |
| C | 13 | 61 | 6054 | 26.39 | 840 | 845 | 197.4 |
| C | 12 | 4 | 5418 | 23.17 | 840 | 845 | 197.4 |
| C | 14 | 234 | 3865 | 15.3 | 840 | 845 | 197.4 |
| D | 1 | 52 | 915328 | 4644.13 | 806 | 783 | 196.9 |
| D | 10 | 253 | 672835 | 3412.73 | 806 | 783 | 196.9 |
| D | 14 | 34 | 62657 | 314.2 | 806 | 783 | 196.9 |
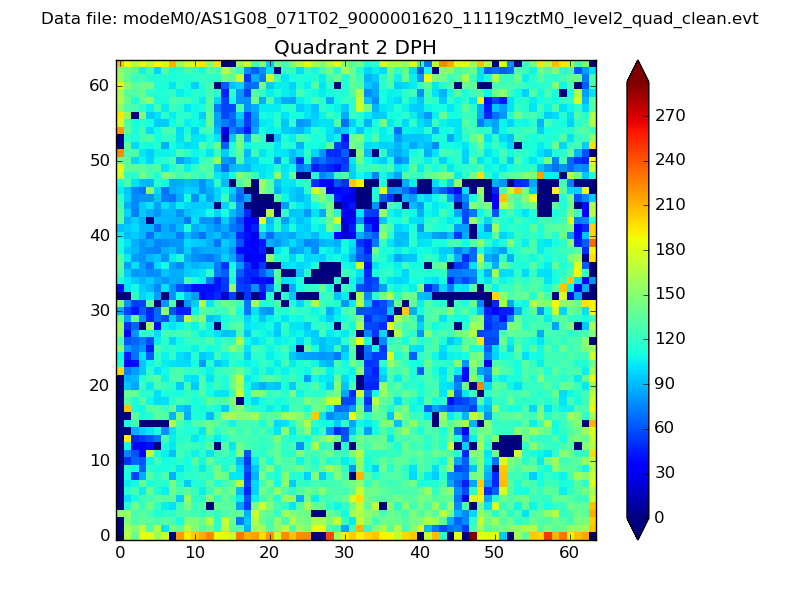
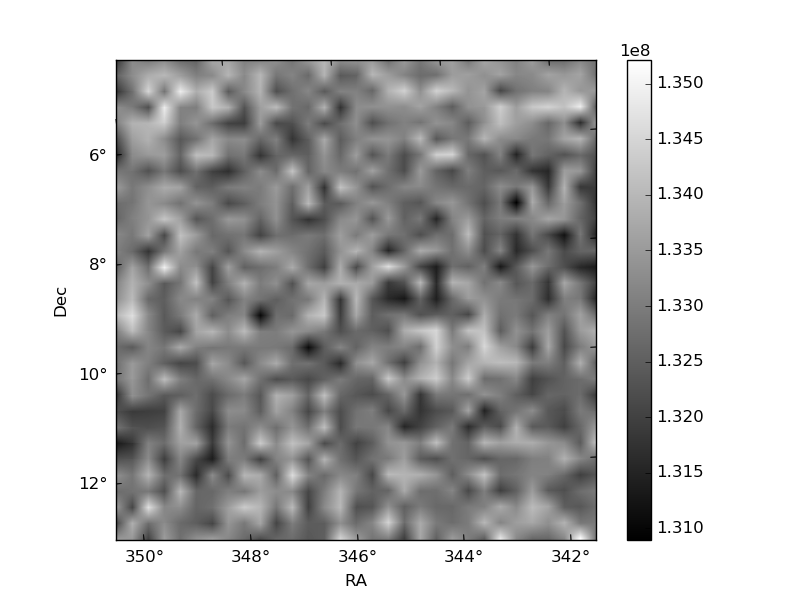
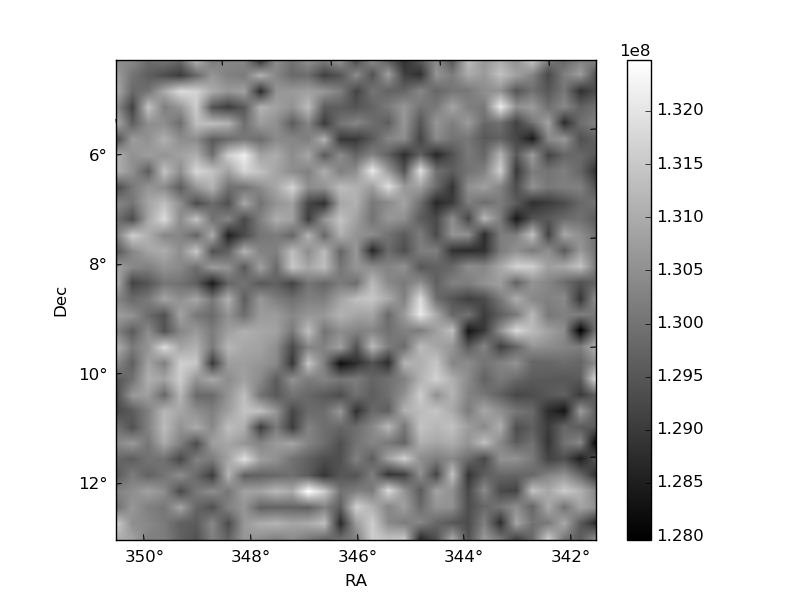
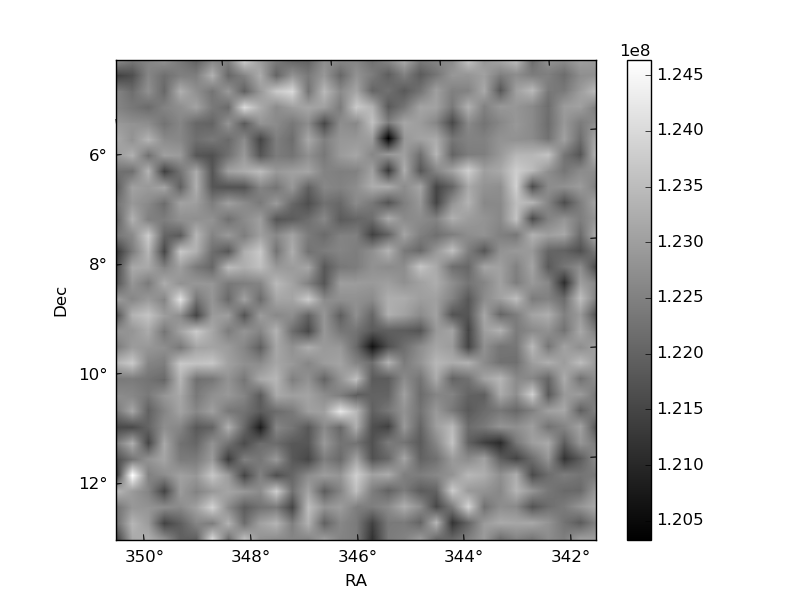
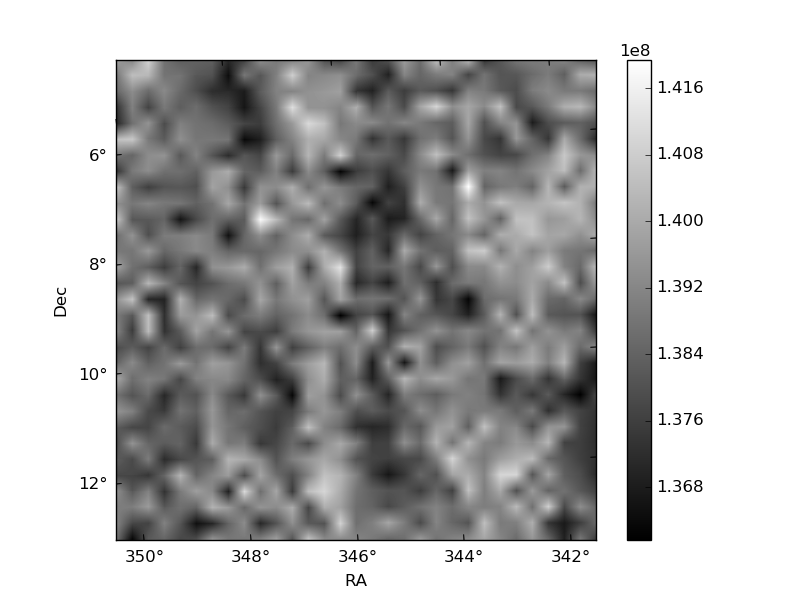
Histogram calculated using DETX and DETY for each event in the final _common_clean file
| Quadrant A | 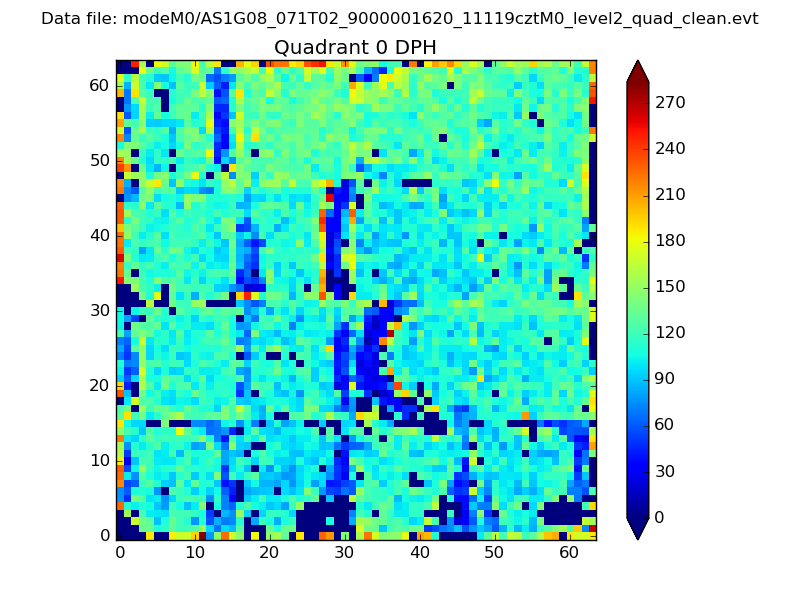 |
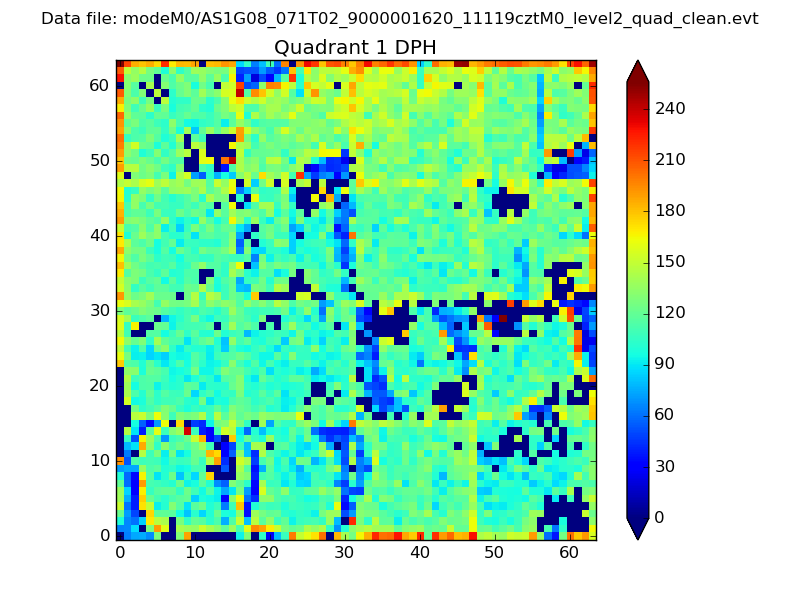 |
Quadrant B |
|---|---|---|---|
| Quadrant D | 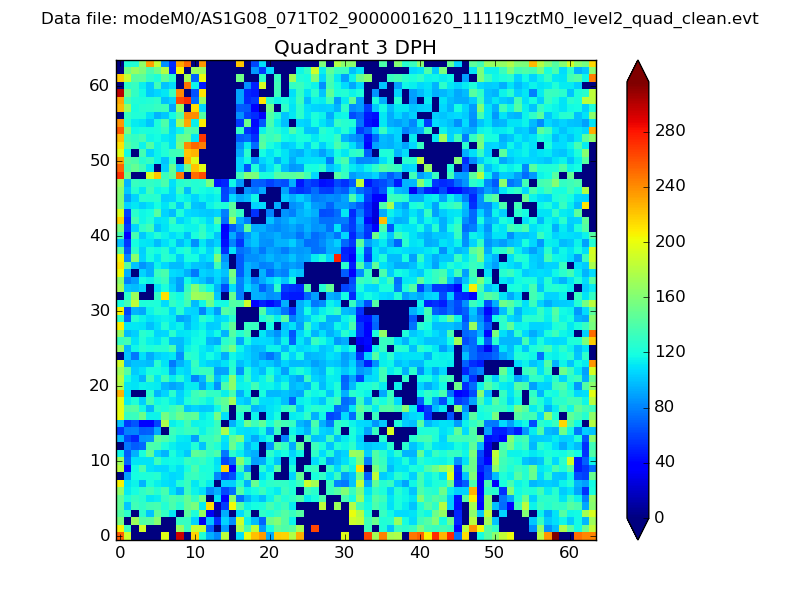 |
 |
Quadrant C |
| Plot type | Count rate plots | Images |
|---|---|---|
| Comparison with Poisson distribution Blue bars denote a histogram of data divided into 1 sec bins. Red curve is a Poisson curve with rate = median count rate of data. |
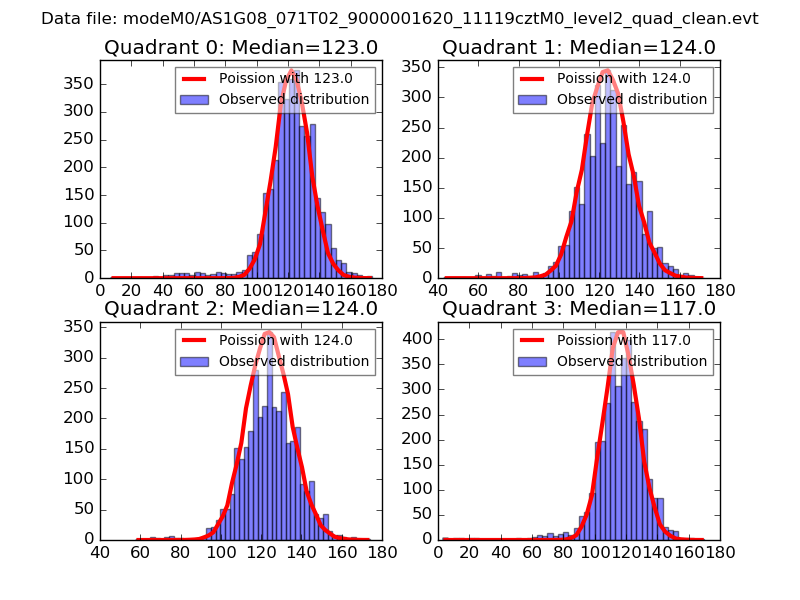 |
 |
| Quadrant-wise count rates Data is divided into 100 sec bins |
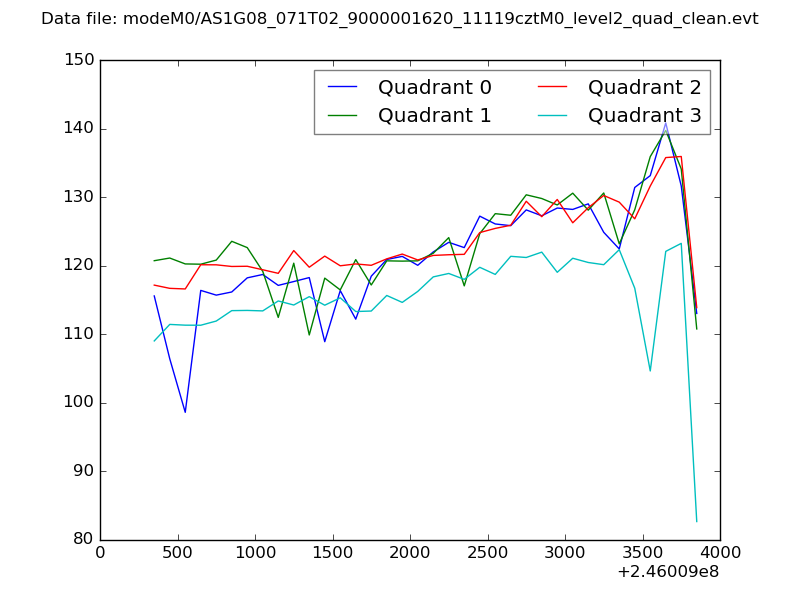 |
|
| Module-wise count rates for Quadrant A Data is divided into 100 sec bins |
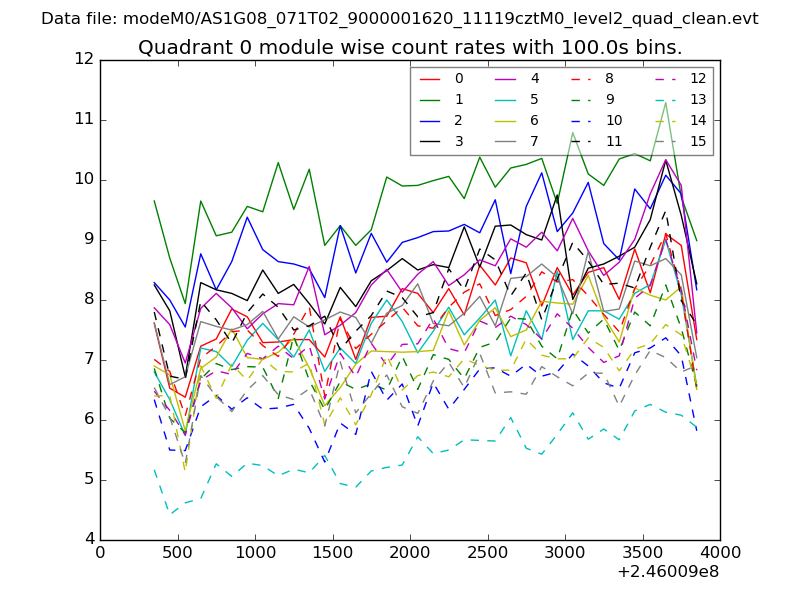 |
 |
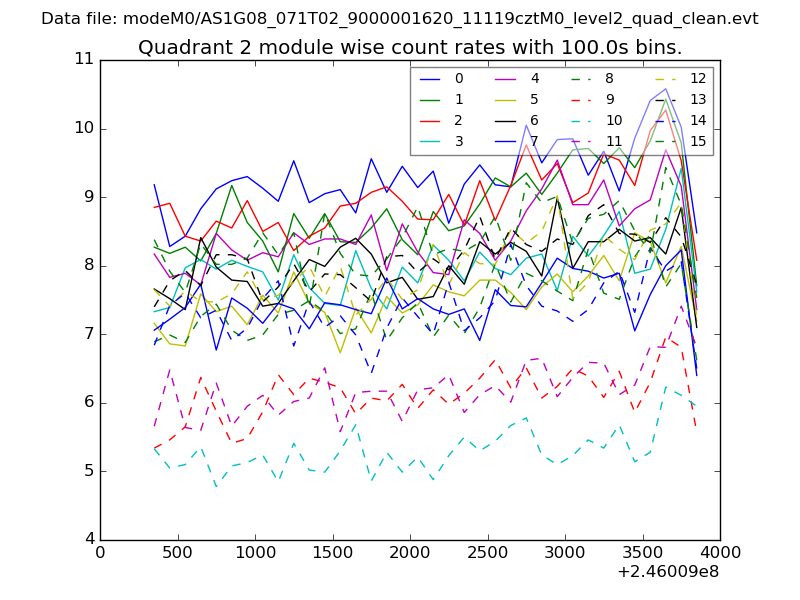
| Module-wise count rates for Quadrant B Data is divided into 100 sec bins |
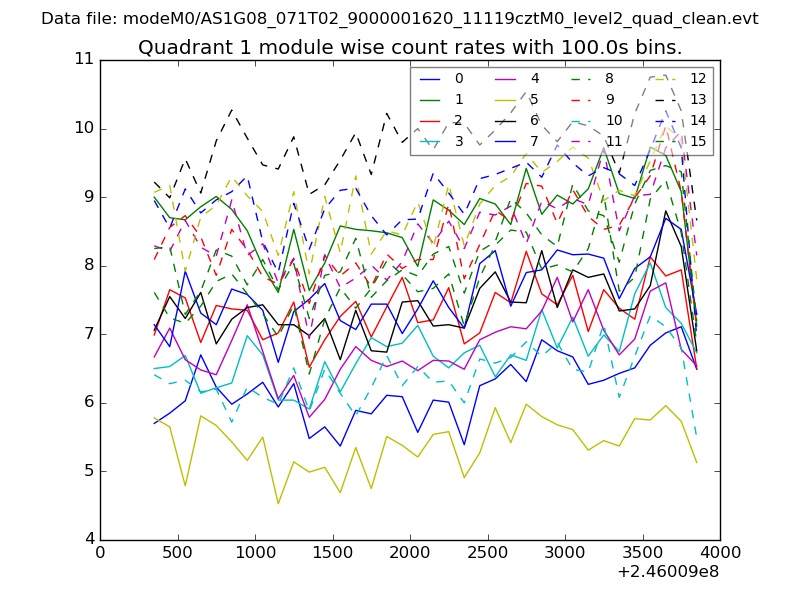 |
 |
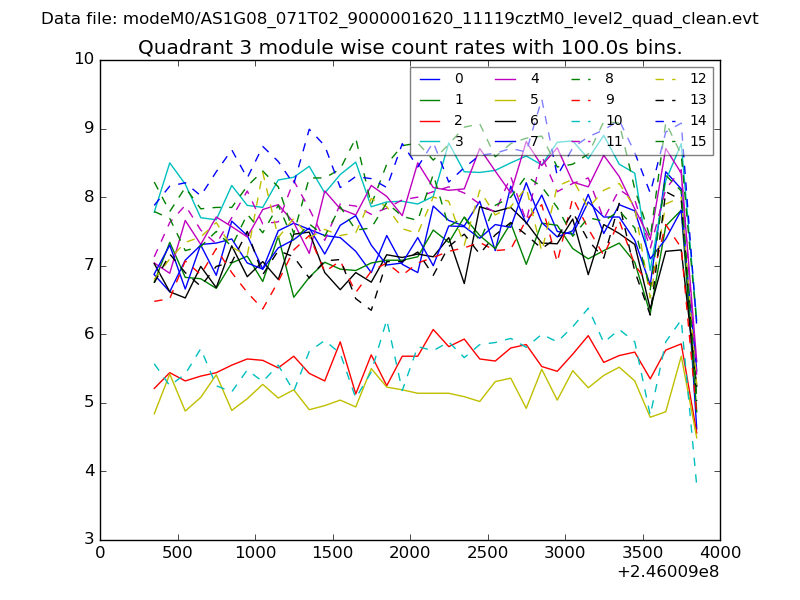
| Module-wise count rates for Quadrant C Data is divided into 100 sec bins |
 |
 |
| Module-wise count rates for Quadrant D Data is divided into 100 sec bins |
 |
 |
| Parameter | Plot |
|---|---|
| CZT HV Monitor | 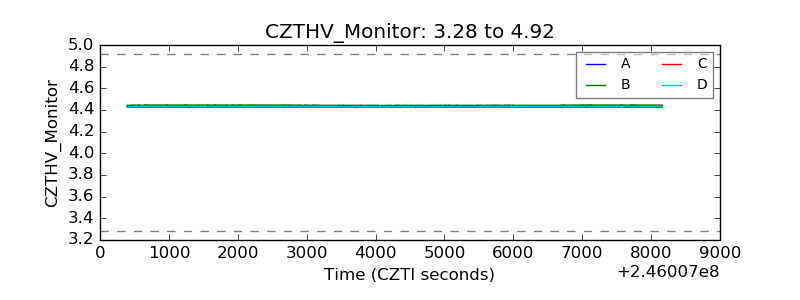 |
| D_VDD | 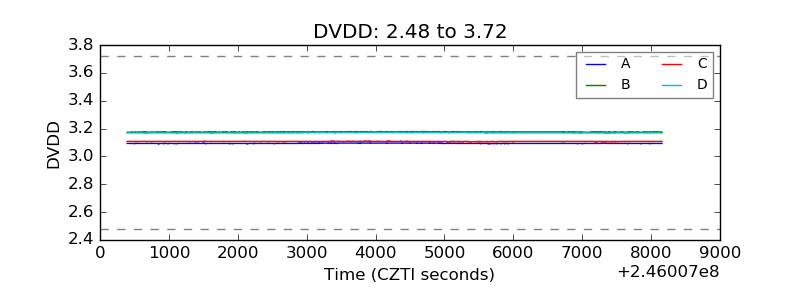 |
| Temperature 1 | 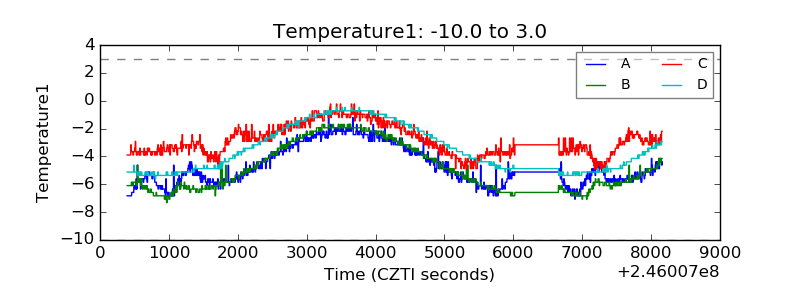 |
| Veto HV Monitor | 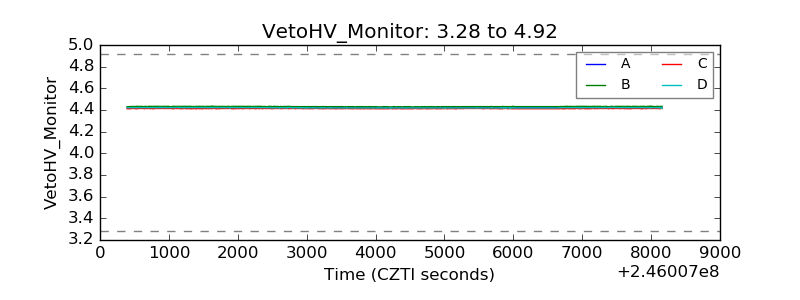 |
| Veto LLD | 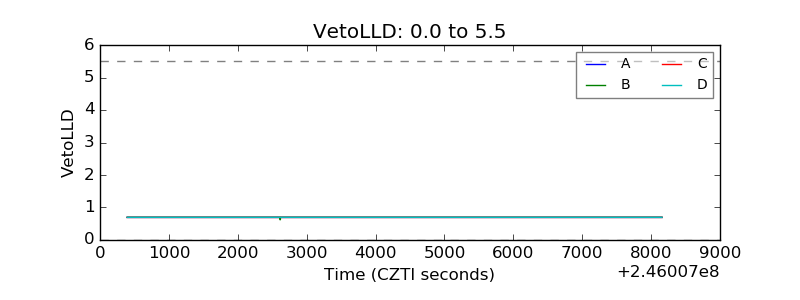 |
| Alpha Counter | 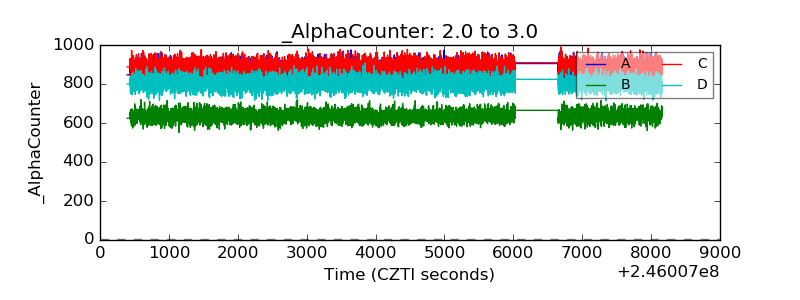 |
| _CPM_Rate | 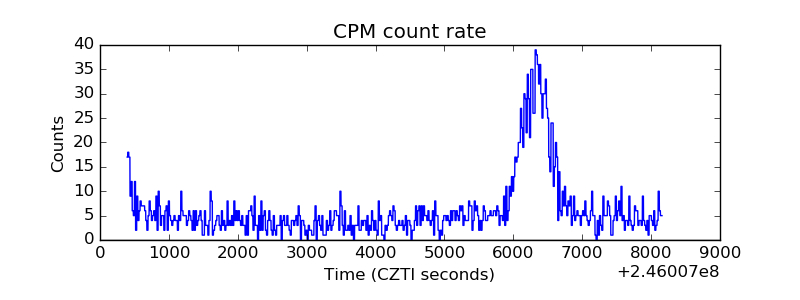 |
| CZT Counter | 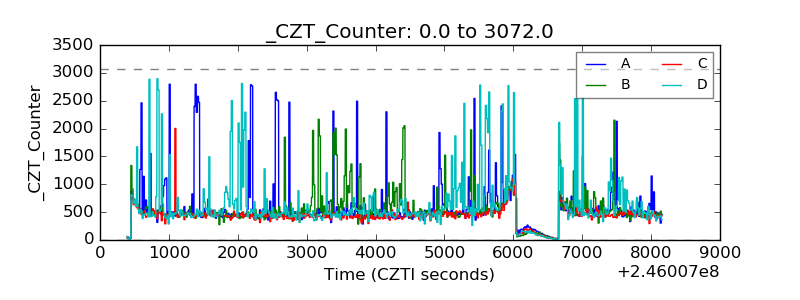 |
| +2.5 Volts monitor |  |
| +5 Volts monitor |  |
| _ROLL_ROT | 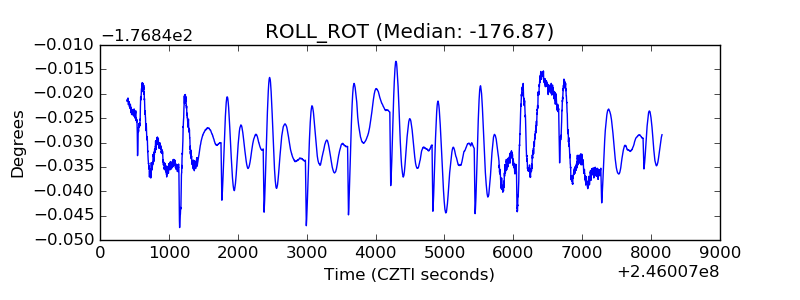 |
| _Roll_DEC | 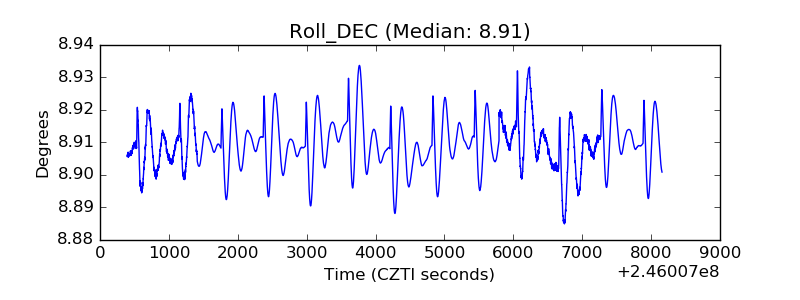 |
| _Roll_RA | 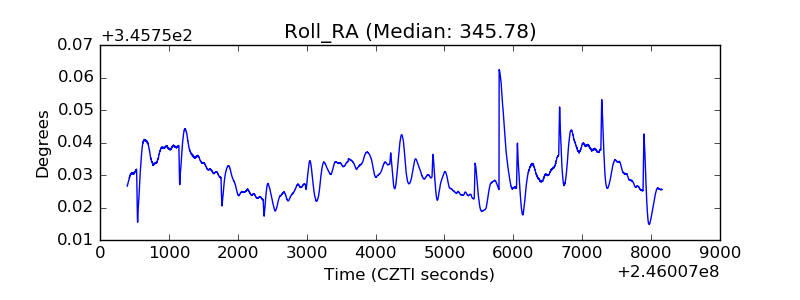 |
| Veto Counter | 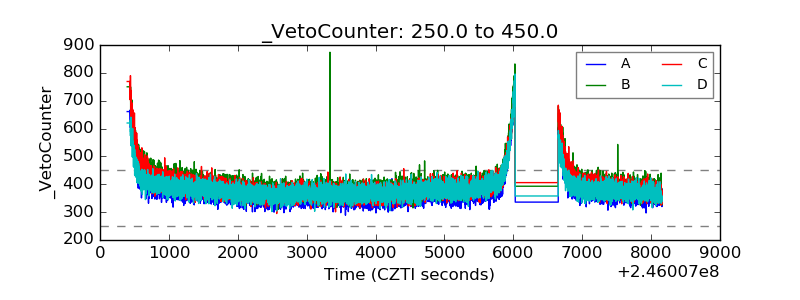 |