| Param | Original file | Final file |
|---|---|---|
| Filename | modeM0/AS1G08_071T02_9000001620_11120cztM0_level2.evt | modeM0/AS1G08_071T02_9000001620_11120cztM0_level2_quad_clean.evt |
| Size (bytes) | 780,742,080 | 84,850,560 |
| Size | 744.6 MB | 80.9 MB |
| Events in quadrant A | 4,733,992 | 521,259 |
| Events in quadrant B | 4,961,214 | 518,857 |
| Events in quadrant C | 3,902,934 | 523,027 |
| Events in quadrant D | 9,491,561 | 435,921 |
| Mode SS | |||
|---|---|---|---|
| Quadrant | BADHDUFLAG | Total packets | Discarded packets |
| A | 0 | 166 | 0 |
| B | 0 | 166 | 0 |
| C | 0 | 166 | 0 |
| D | 0 | 166 | 0 |
| Mode M9 | |||
|---|---|---|---|
| Quadrant | BADHDUFLAG | Total packets | Discarded packets |
| A | 0 | 6 | 0 |
| B | 0 | 6 | 0 |
| C | 0 | 6 | 0 |
| D | 0 | 6 | 0 |
| Mode M0 | |||
|---|---|---|---|
| Quadrant | BADHDUFLAG | Total packets | Discarded packets |
| A | 0 | 19277 | 3 |
| B | 0 | 19943 | 2 |
| C | 0 | 17234 | 2 |
| D | 0 | 33745 | 2 |
| Quadrant | Total seconds | Saturated seconds | Saturation percentage |
|---|---|---|---|
| A | 8197 | 492 | 6.002196% |
| B | 8197 | 597 | 7.283152% |
| C | 8197 | 261 | 3.184092% |
| D | 8197 | 2286 | 27.888252% |
Noise dominated data is calculated using 1-second bins in cleaned event files. If a bin has >2000 counts, and if more than 50% of those come from <1% of pixels, then it is considered to be noise-dominated and hence unusable.
| Quadrant | # 1 sec bins | Bins with >0 counts | Bins with >2000 counts | High rate bins dominated by noise | Noise dominated (total time) | Noise dominated (detector-on time) | Marked lightcurve |
|---|---|---|---|---|---|---|---|
| A | 8867 | 8198 | 70 | 70 | 0.79% | 0.85% | 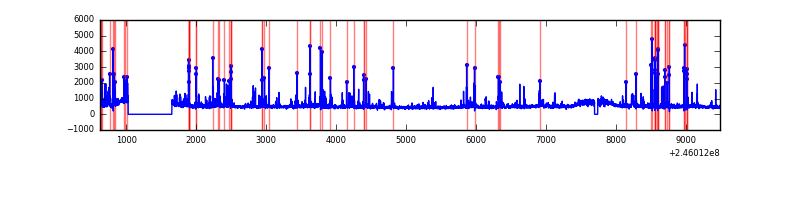 |
| B | 8867 | 8199 | 118 | 118 | 1.33% | 1.44% | 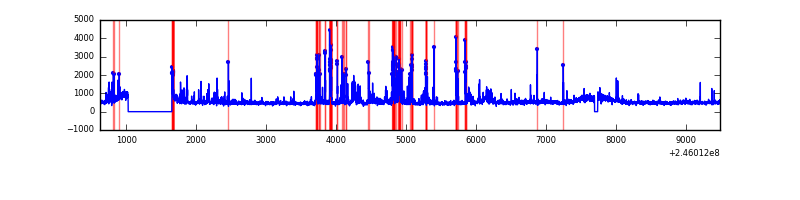 |
| C | 8867 | 8199 | 0 | 0 | 0.00% | 0.00% | 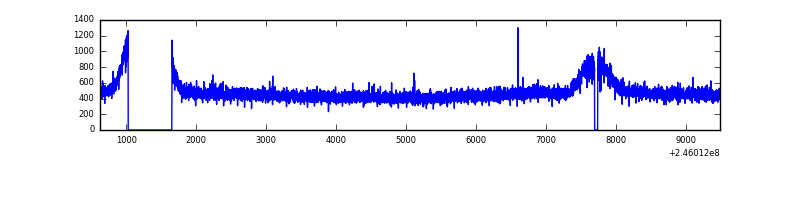 |
| D | 8867 | 8199 | 1687 | 1687 | 19.03% | 20.58% | 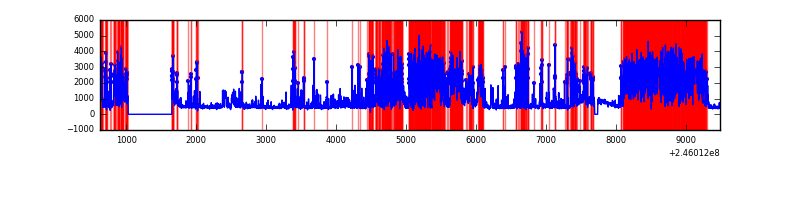 |
Top three noisy pixels from each quadrant. If the there are fewer than three noisy pixels in the level2.evt file, extra rows are filled as -1
| Pixel properties | Quadrant properties | ||||||
|---|---|---|---|---|---|---|---|
| Quadrant | DetID | PixID | Counts | Sigma | Mean | Median | Sigma |
| A | 8 | 5 | 742630 | 3534.95 | 1015 | 985 | 209.8 |
| A | 15 | 174 | 32123 | 148.42 | 1015 | 985 | 209.8 |
| A | 8 | 15 | 29026 | 133.65 | 1015 | 985 | 209.8 |
| B | 4 | 239 | 760761 | 3831.74 | 1014 | 988 | 198.3 |
| B | 10 | 16 | 80745 | 402.24 | 1014 | 988 | 198.3 |
| B | 11 | 51 | 51270 | 253.59 | 1014 | 988 | 198.3 |
| C | 13 | 61 | 7447 | 27.47 | 998 | 1001 | 234.7 |
| C | 9 | 204 | 5874 | 20.77 | 998 | 1001 | 234.7 |
| C | 12 | 4 | 3584 | 11.01 | 998 | 1001 | 234.7 |
| D | 14 | 34 | 2997982 | 13881.21 | 885 | 858 | 215.9 |
| D | 10 | 253 | 1473892 | 6822.37 | 885 | 858 | 215.9 |
| D | 2 | 120 | 963636 | 4459.11 | 885 | 858 | 215.9 |
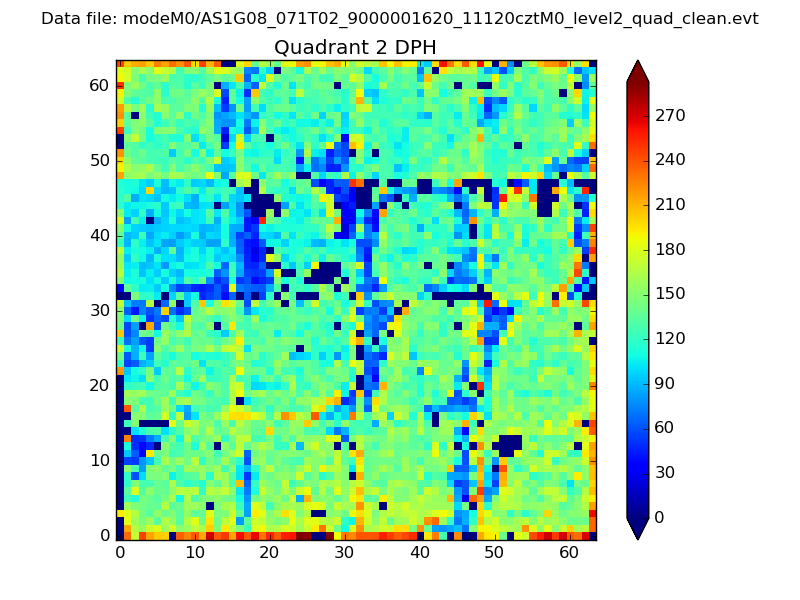
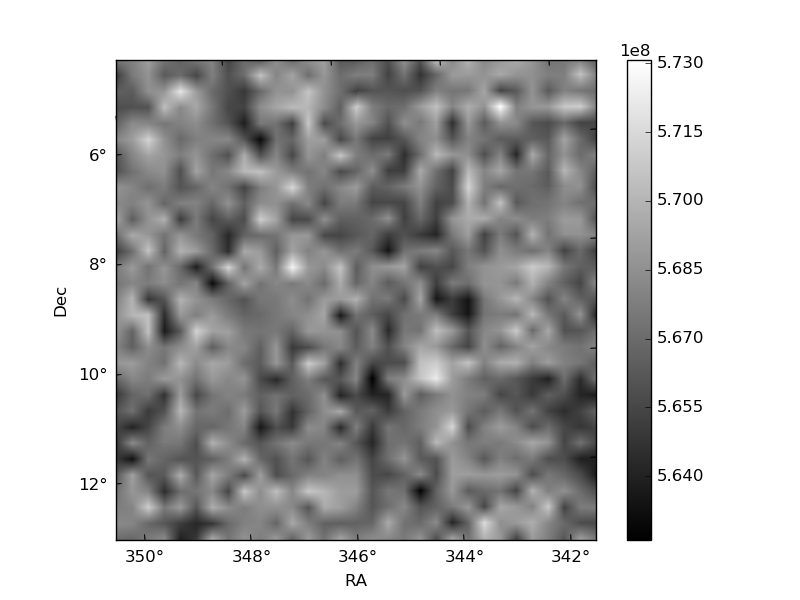
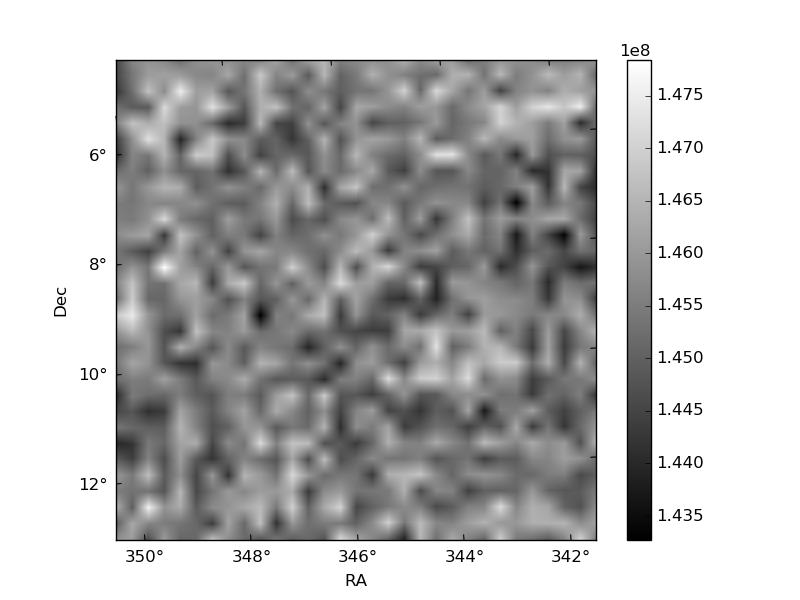
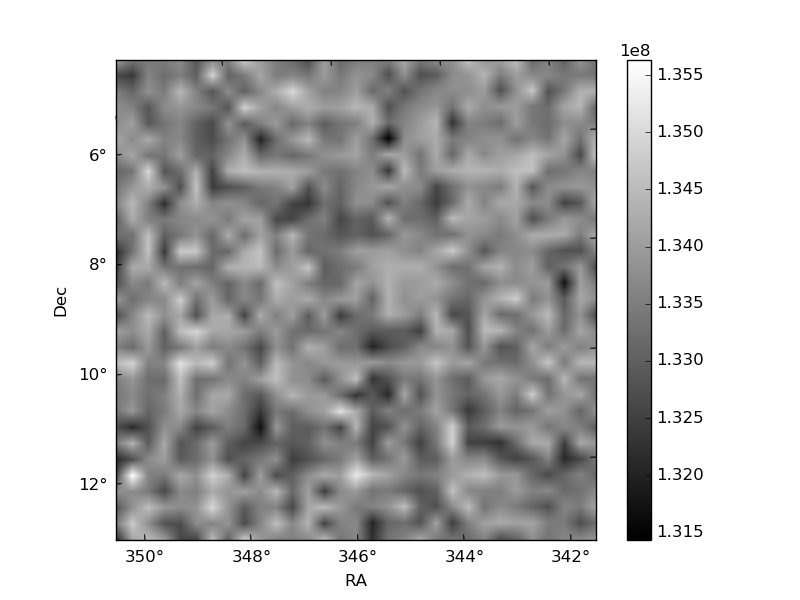
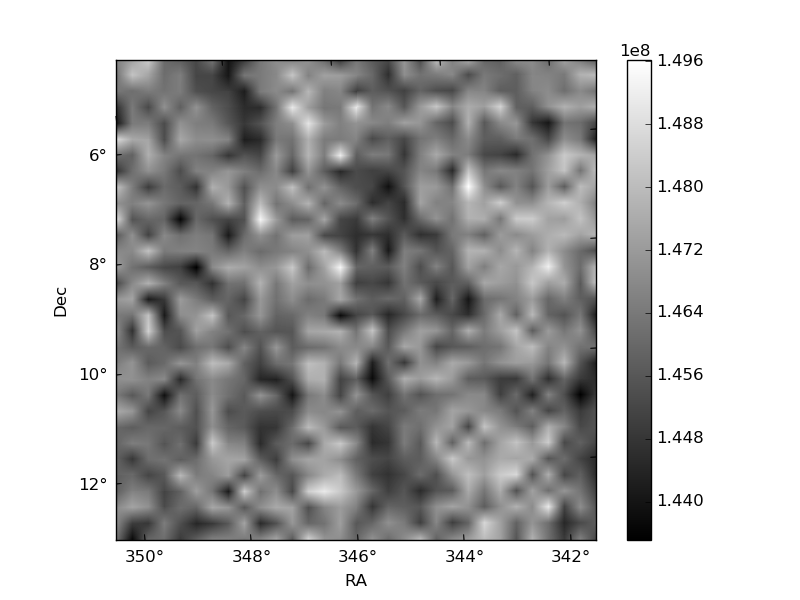
Histogram calculated using DETX and DETY for each event in the final _common_clean file
| Quadrant A | 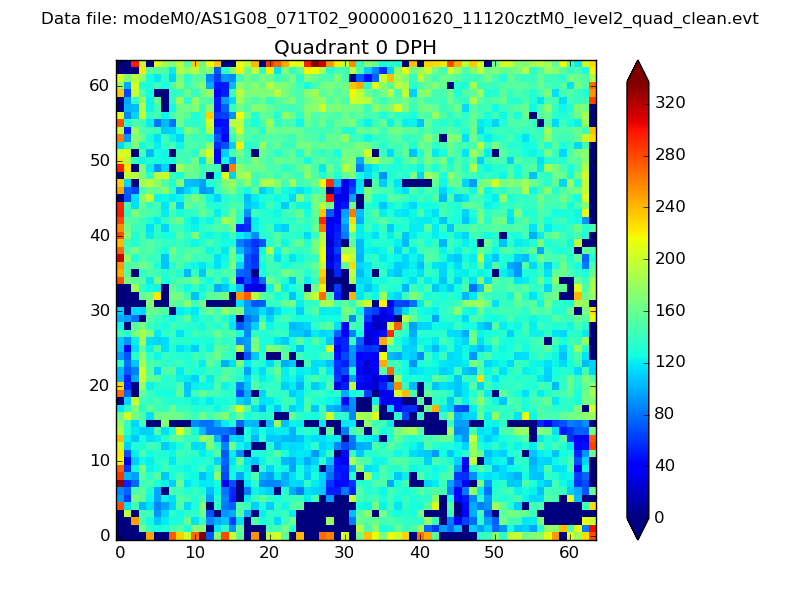 |
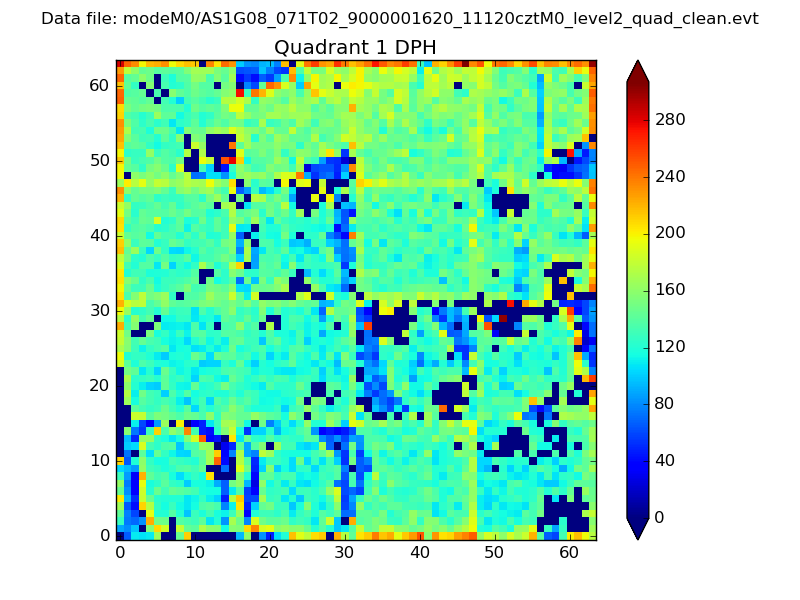 |
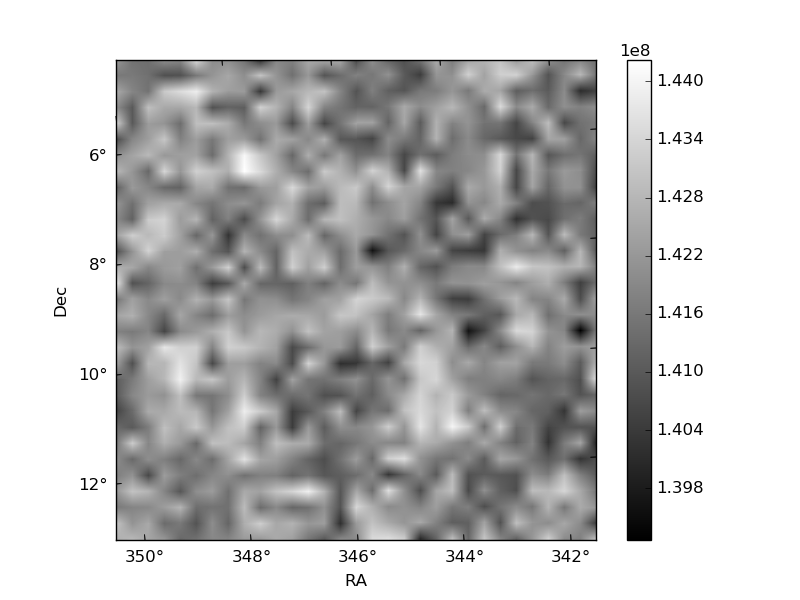
Quadrant B |
|---|---|---|---|
| Quadrant D | 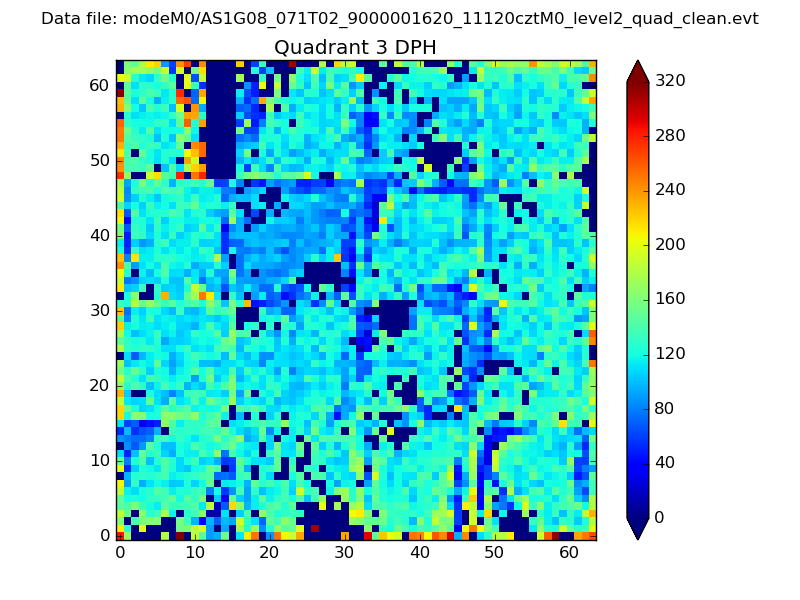 |
 |
Quadrant C |
| Plot type | Count rate plots | Images |
|---|---|---|
| Comparison with Poisson distribution Blue bars denote a histogram of data divided into 1 sec bins. Red curve is a Poisson curve with rate = median count rate of data. |
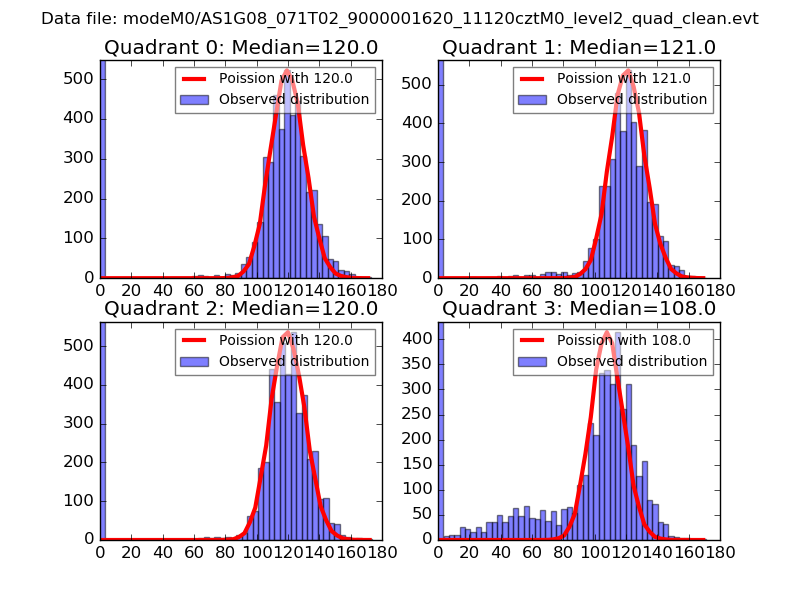 |
 |
| Quadrant-wise count rates Data is divided into 100 sec bins |
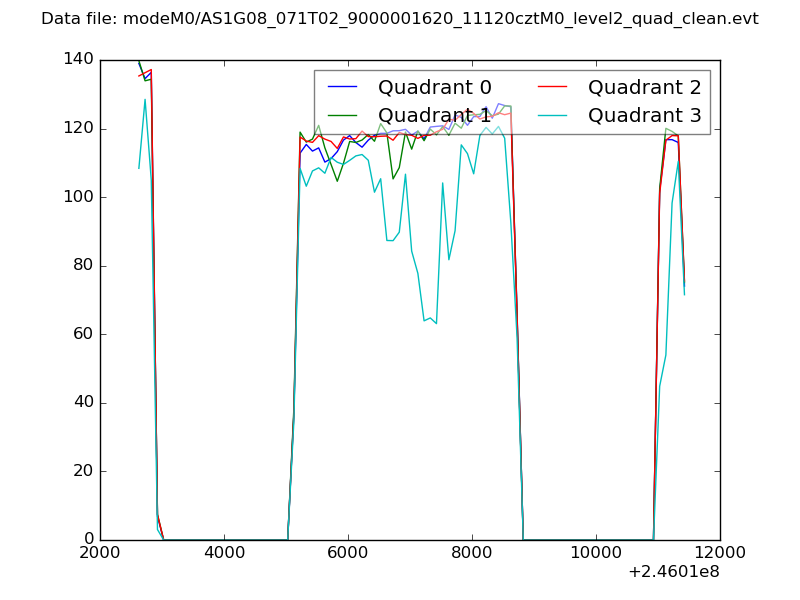 |
|
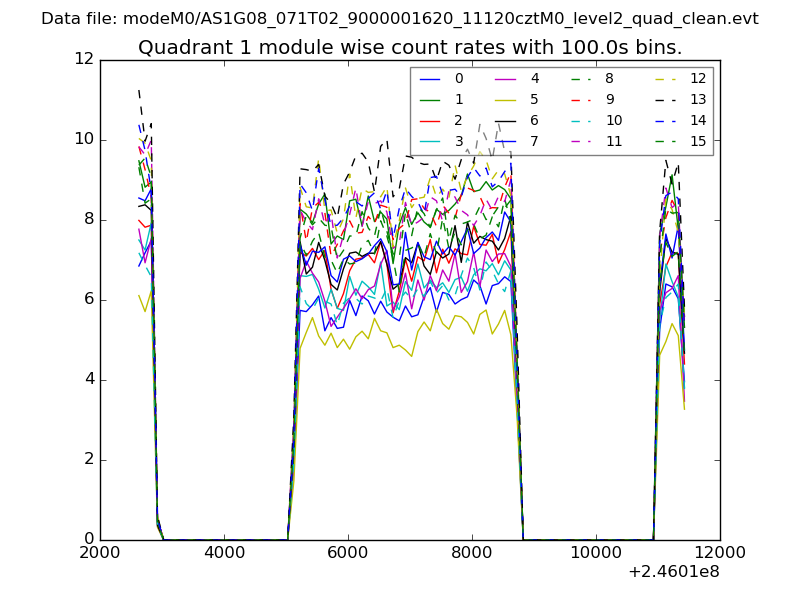
| Module-wise count rates for Quadrant A Data is divided into 100 sec bins |
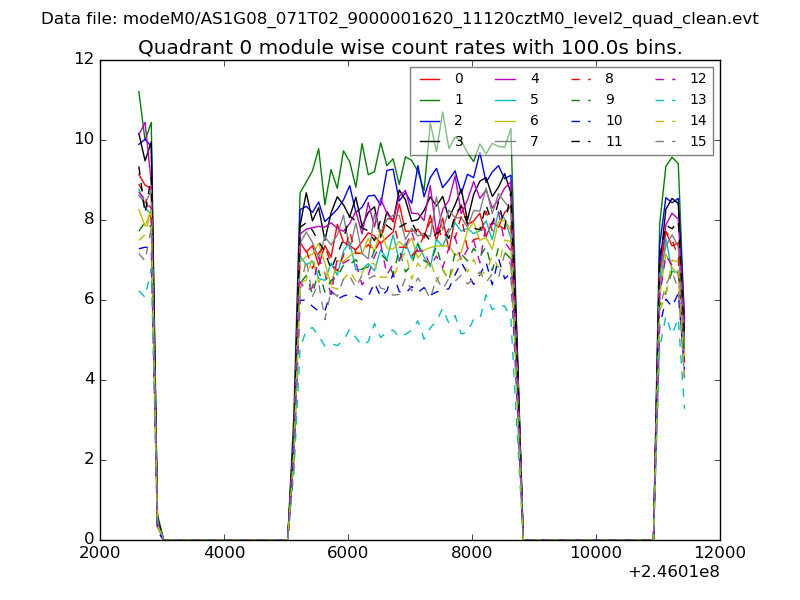 |
 |
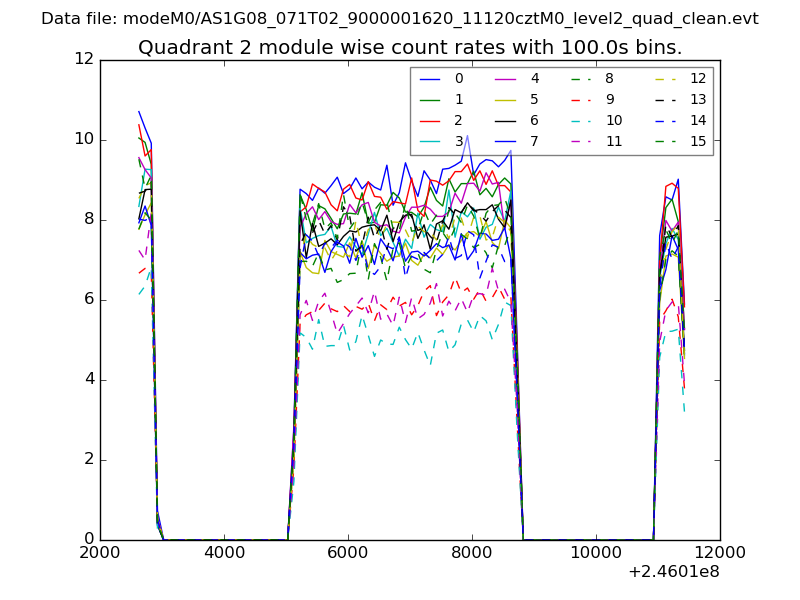
| Module-wise count rates for Quadrant B Data is divided into 100 sec bins |
 |
 |
| Module-wise count rates for Quadrant C Data is divided into 100 sec bins |
 |
 |
| Module-wise count rates for Quadrant D Data is divided into 100 sec bins |
 |
 |
| Parameter | Plot |
|---|---|
| CZT HV Monitor | 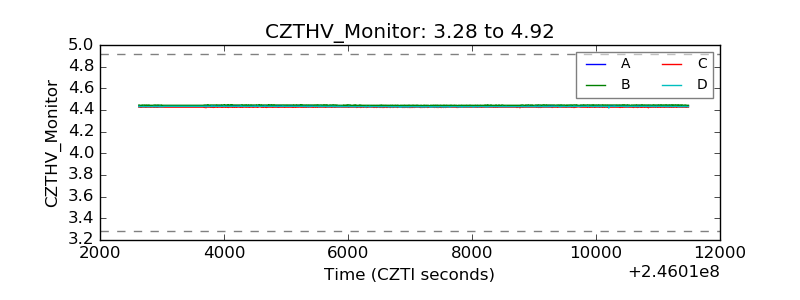 |
| D_VDD | 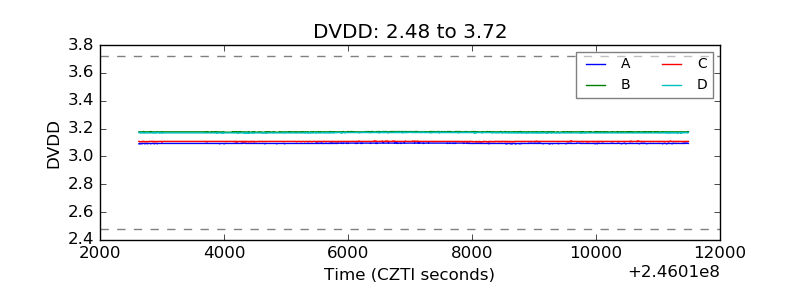 |
| Temperature 1 |  |
| Veto HV Monitor | 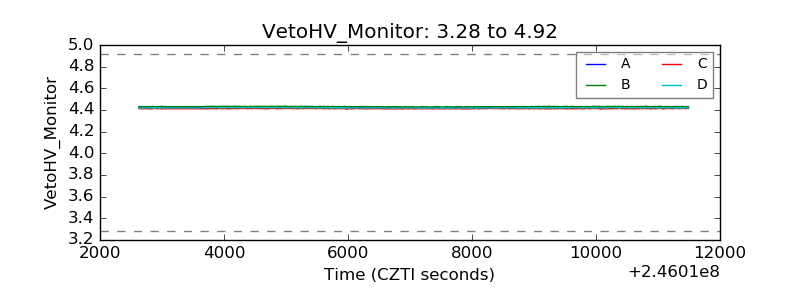 |
| Veto LLD | 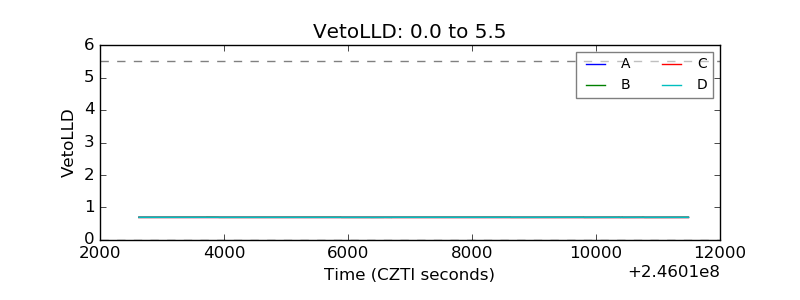 |
| Alpha Counter |  |
| _CPM_Rate | 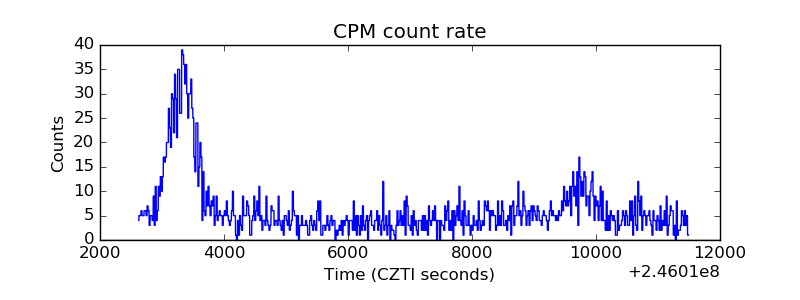 |
| CZT Counter | 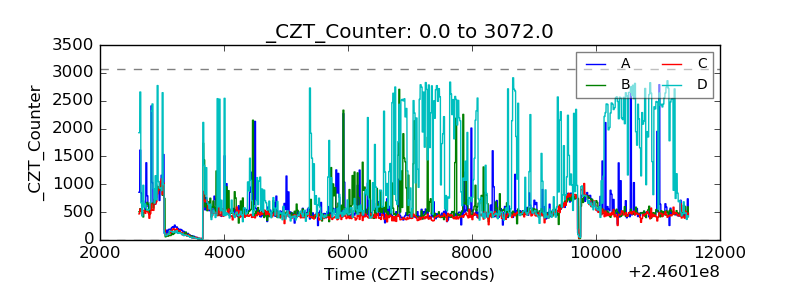 |
| +2.5 Volts monitor |  |
| +5 Volts monitor |  |
| _ROLL_ROT | 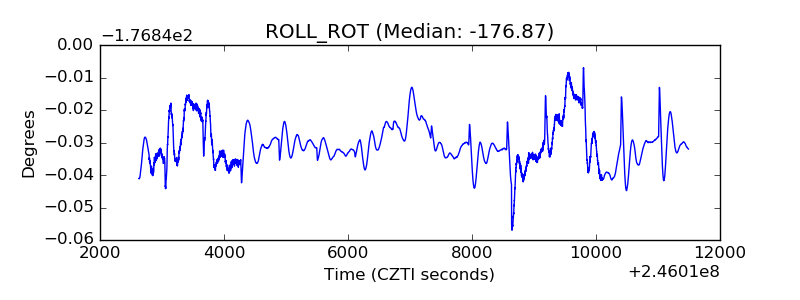 |
| _Roll_DEC |  |
| _Roll_RA | 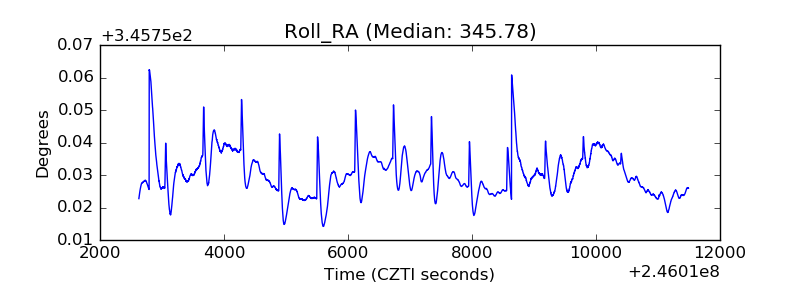 |
| Veto Counter | 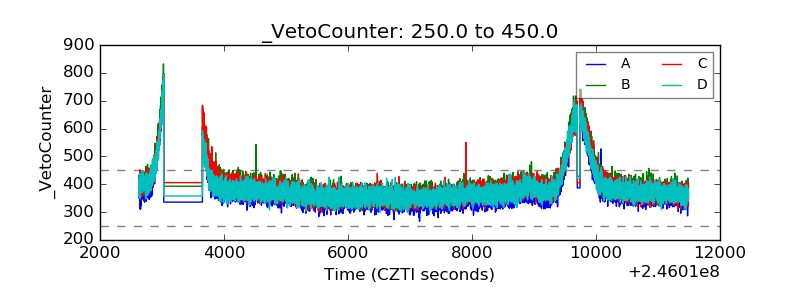 |