| Param | Original file | Final file |
|---|---|---|
| Filename | modeM0/AS1G08_071T02_9000001620_11121cztM0_level2.evt | modeM0/AS1G08_071T02_9000001620_11121cztM0_level2_quad_clean.evt |
| Size (bytes) | 810,682,560 | 85,443,840 |
| Size | 773.1 MB | 81.5 MB |
| Events in quadrant A | 6,251,886 | 502,603 |
| Events in quadrant B | 5,076,835 | 510,829 |
| Events in quadrant C | 4,004,168 | 520,892 |
| Events in quadrant D | 8,650,836 | 469,892 |
| Mode SS | |||
|---|---|---|---|
| Quadrant | BADHDUFLAG | Total packets | Discarded packets |
| A | 0 | 170 | 0 |
| B | 0 | 170 | 0 |
| C | 0 | 170 | 0 |
| D | 0 | 170 | 0 |
| Mode M0 | |||
|---|---|---|---|
| Quadrant | BADHDUFLAG | Total packets | Discarded packets |
| A | 0 | 24082 | 3 |
| B | 0 | 20368 | 2 |
| C | 0 | 17670 | 2 |
| D | 0 | 31425 | 2 |
| Quadrant | Total seconds | Saturated seconds | Saturation percentage |
|---|---|---|---|
| A | 8381 | 914 | 10.905620% |
| B | 8381 | 756 | 9.020403% |
| C | 8381 | 307 | 3.663047% |
| D | 8381 | 1880 | 22.431691% |
Noise dominated data is calculated using 1-second bins in cleaned event files. If a bin has >2000 counts, and if more than 50% of those come from <1% of pixels, then it is considered to be noise-dominated and hence unusable.
| Quadrant | # 1 sec bins | Bins with >0 counts | Bins with >2000 counts | High rate bins dominated by noise | Noise dominated (total time) | Noise dominated (detector-on time) | Marked lightcurve |
|---|---|---|---|---|---|---|---|
| A | 8511 | 8383 | 326 | 326 | 3.83% | 3.89% | 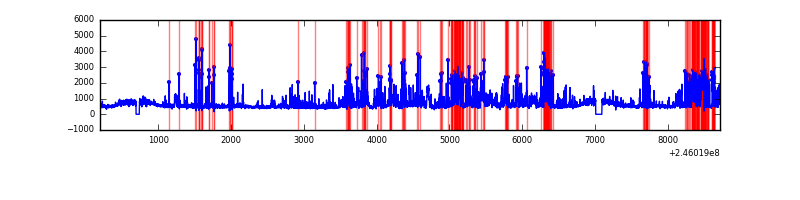 |
| B | 8511 | 8383 | 150 | 150 | 1.76% | 1.79% | 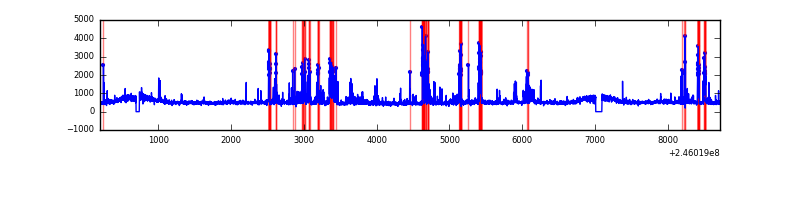 |
| C | 8511 | 8383 | 0 | 0 | 0.00% | 0.00% | 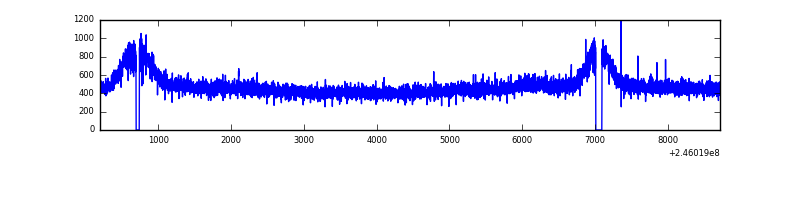 |
| D | 8511 | 8383 | 1262 | 1262 | 14.83% | 15.05% | 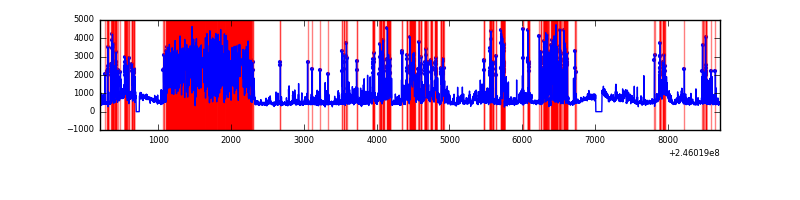 |
Top three noisy pixels from each quadrant. If the there are fewer than three noisy pixels in the level2.evt file, extra rows are filled as -1
| Pixel properties | Quadrant properties | ||||||
|---|---|---|---|---|---|---|---|
| Quadrant | DetID | PixID | Counts | Sigma | Mean | Median | Sigma |
| A | 8 | 5 | 2142765 | 10061.83 | 1033 | 1004 | 212.9 |
| A | 14 | 238 | 73201 | 339.17 | 1033 | 1004 | 212.9 |
| A | 8 | 15 | 29486 | 133.8 | 1033 | 1004 | 212.9 |
| B | 4 | 239 | 795846 | 3934.14 | 1039 | 1010 | 202.0 |
| B | 15 | 204 | 51712 | 250.96 | 1039 | 1010 | 202.0 |
| B | 0 | 187 | 40016 | 193.07 | 1039 | 1010 | 202.0 |
| C | 13 | 61 | 7615 | 27.56 | 1025 | 1025 | 239.1 |
| C | 9 | 204 | 3823 | 11.7 | 1025 | 1025 | 239.1 |
| C | 12 | 4 | 3614 | 10.83 | 1025 | 1025 | 239.1 |
| D | 14 | 34 | 2051453 | 8962.42 | 940 | 909 | 228.8 |
| D | 10 | 253 | 1542998 | 6740.09 | 940 | 909 | 228.8 |
| D | 2 | 120 | 660474 | 2882.8 | 940 | 909 | 228.8 |
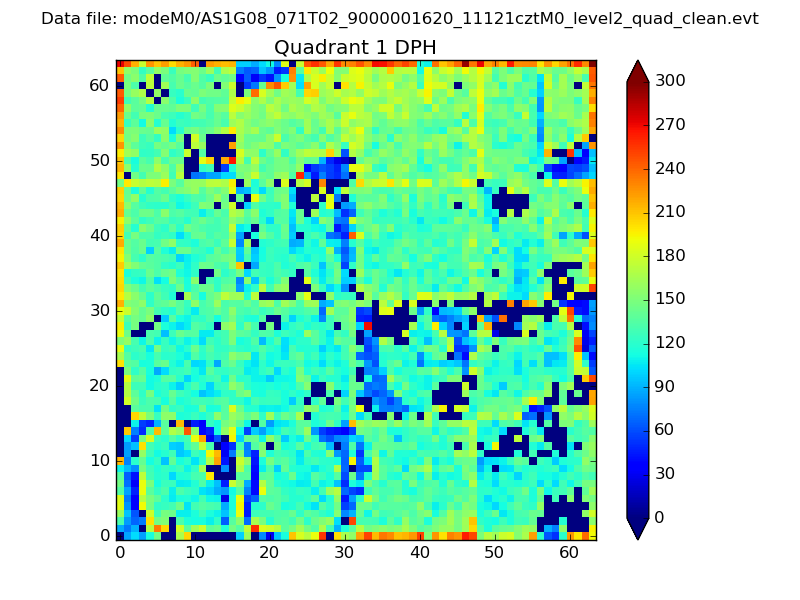
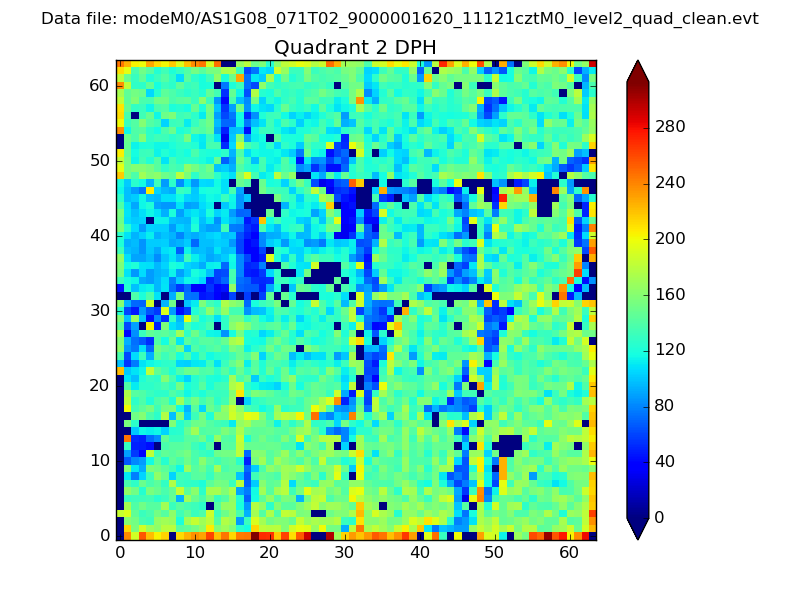
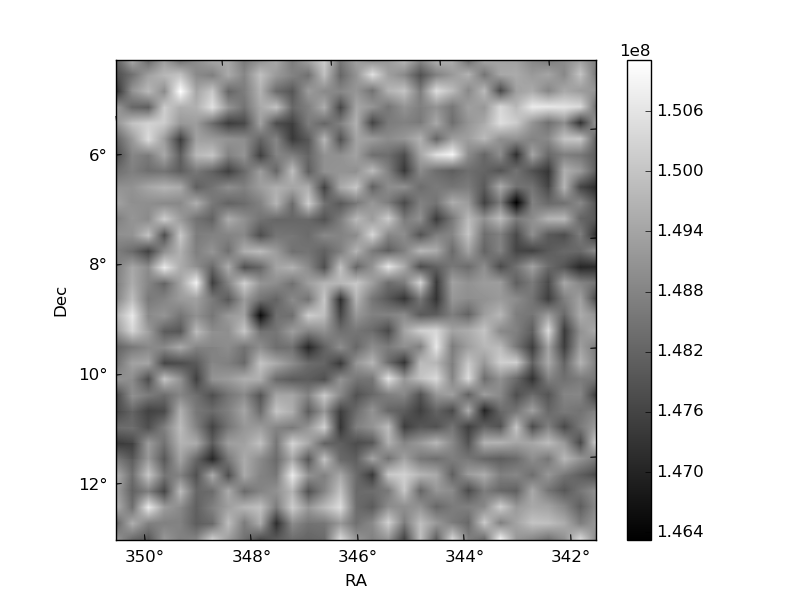
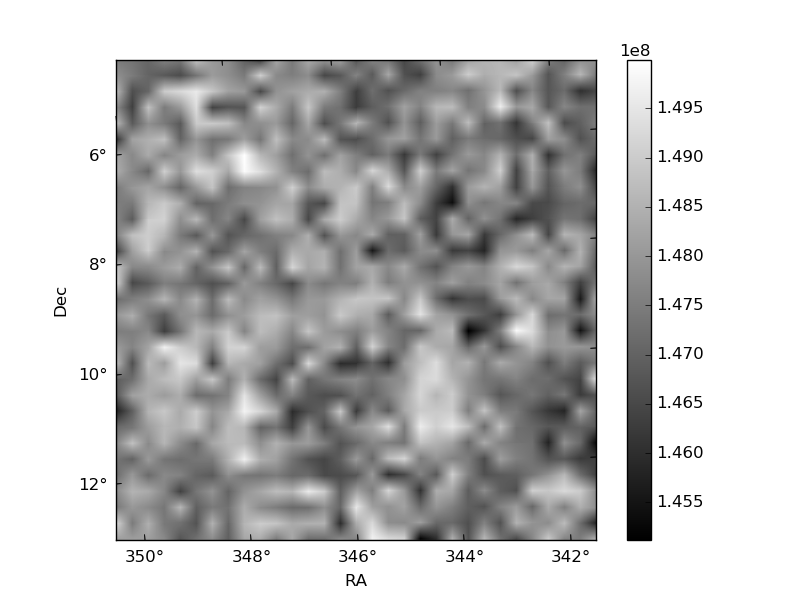
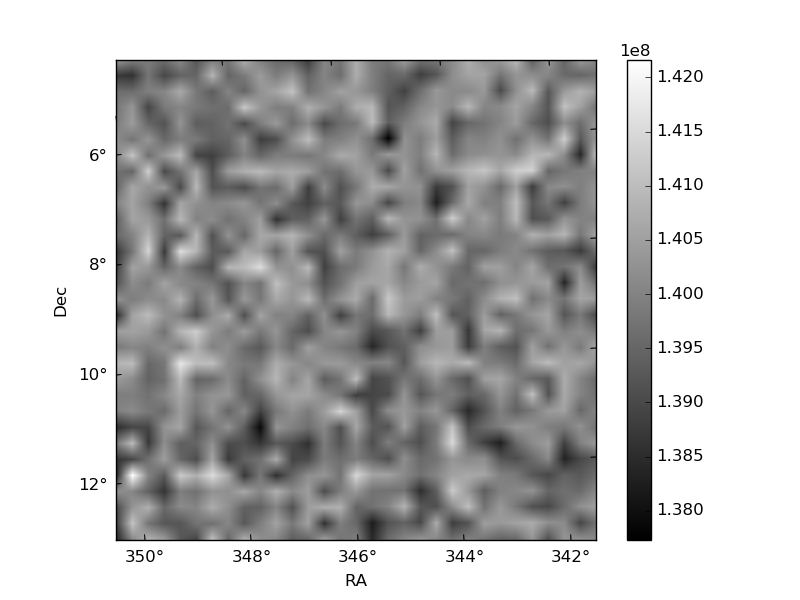
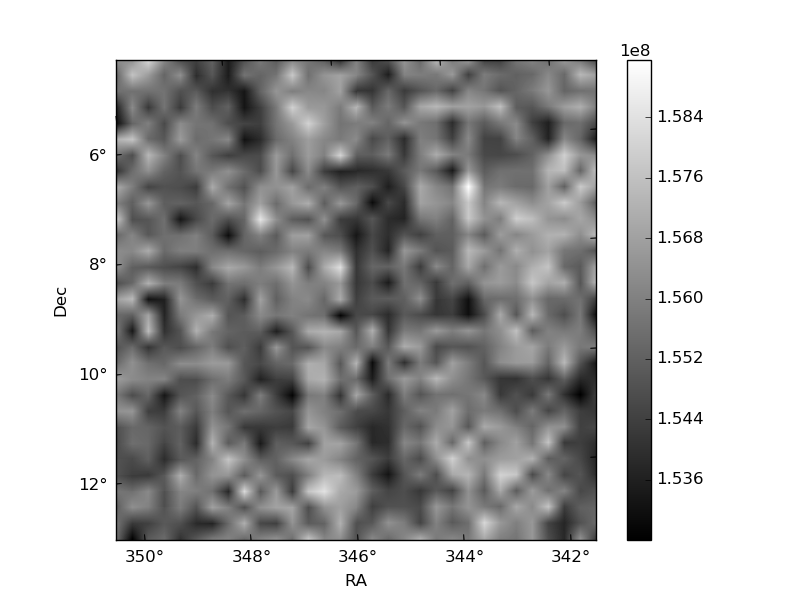
Histogram calculated using DETX and DETY for each event in the final _common_clean file
| Quadrant A |  |
 |
Quadrant B |
|---|---|---|---|
| Quadrant D | 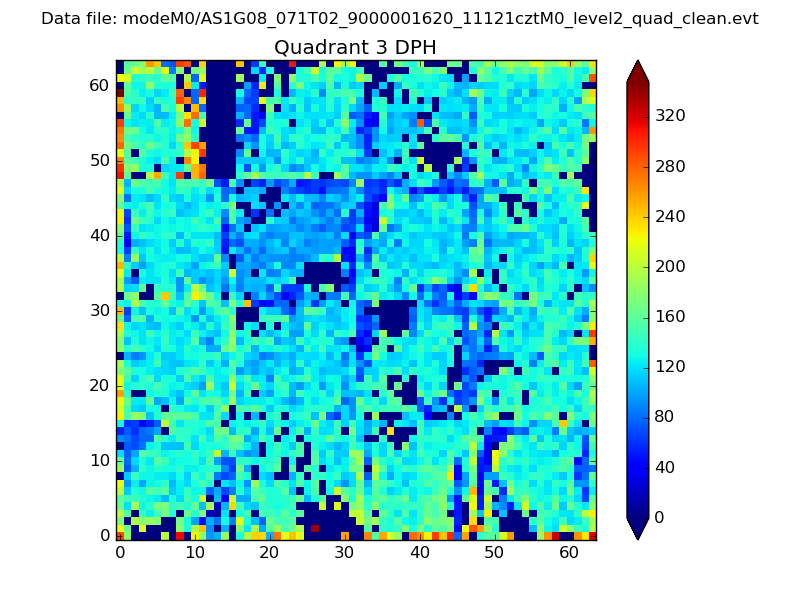 |
 |
Quadrant C |
| Plot type | Count rate plots | Images |
|---|---|---|
| Comparison with Poisson distribution Blue bars denote a histogram of data divided into 1 sec bins. Red curve is a Poisson curve with rate = median count rate of data. |
 |
 |
| Quadrant-wise count rates Data is divided into 100 sec bins |
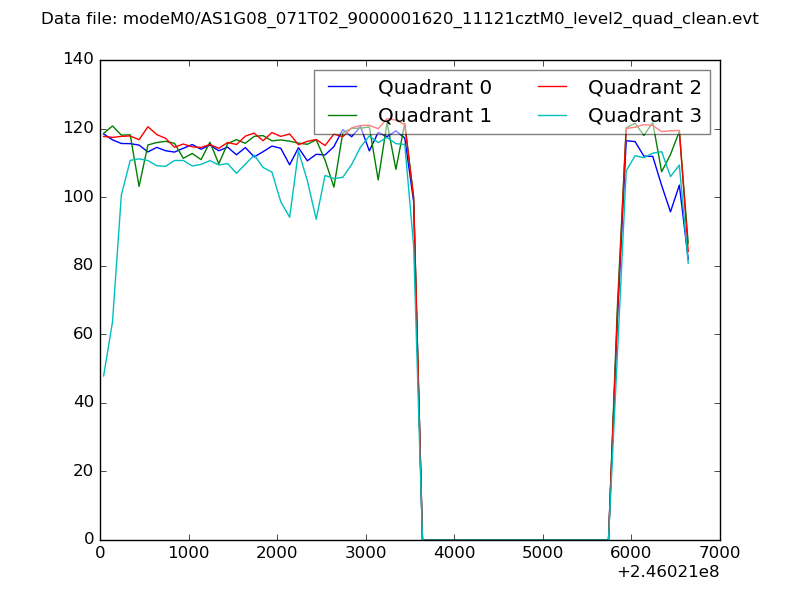 |
|
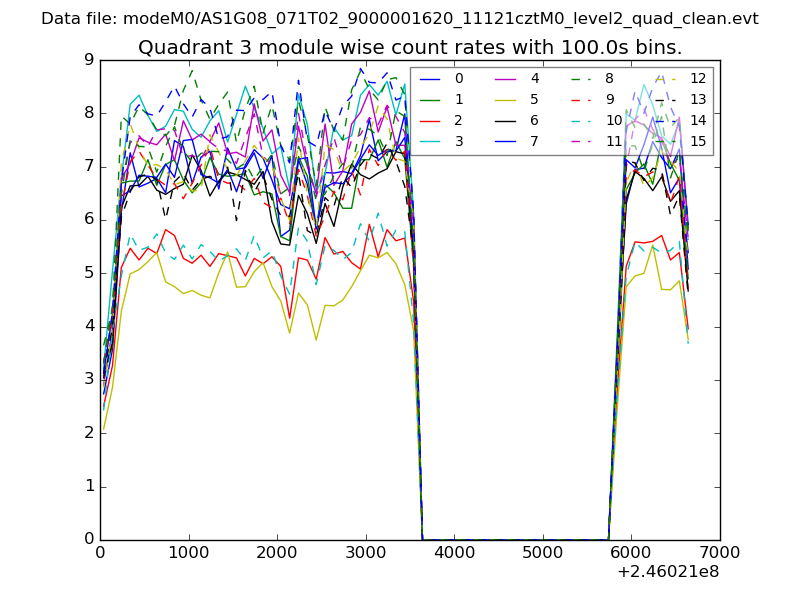
| Module-wise count rates for Quadrant A Data is divided into 100 sec bins |
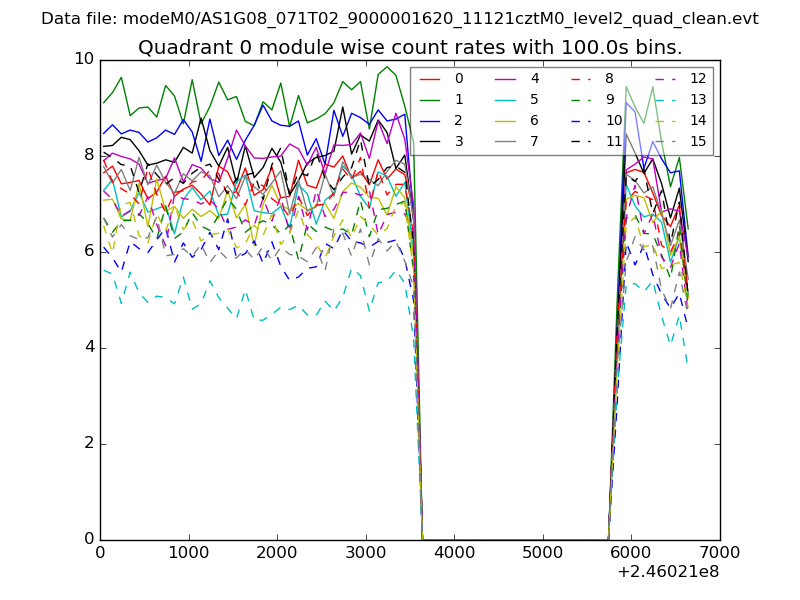 |
 |
| Module-wise count rates for Quadrant B Data is divided into 100 sec bins |
 |
 |
| Module-wise count rates for Quadrant C Data is divided into 100 sec bins |
 |
 |
| Module-wise count rates for Quadrant D Data is divided into 100 sec bins |
 |
 |
| Parameter | Plot |
|---|---|
| CZT HV Monitor | 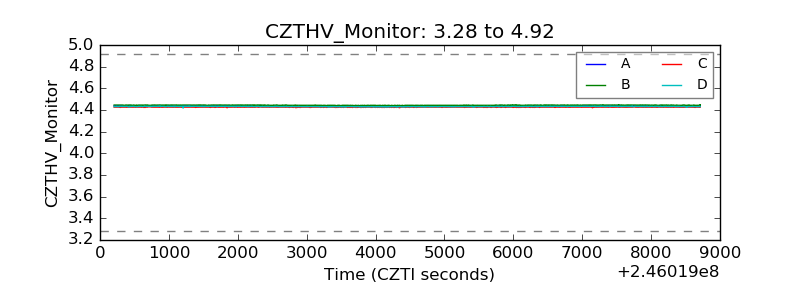 |
| D_VDD | 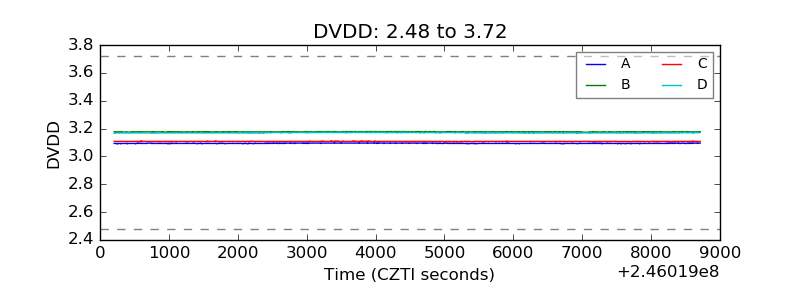 |
| Temperature 1 | 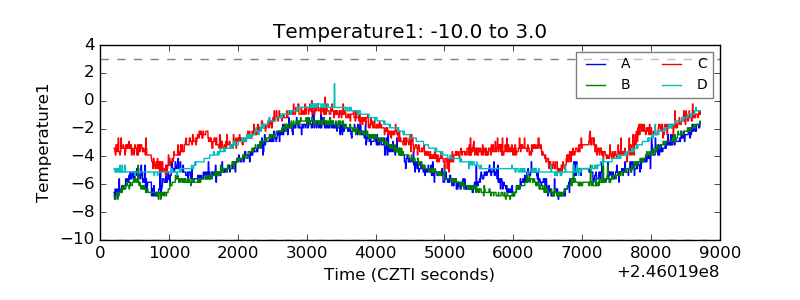 |
| Veto HV Monitor | 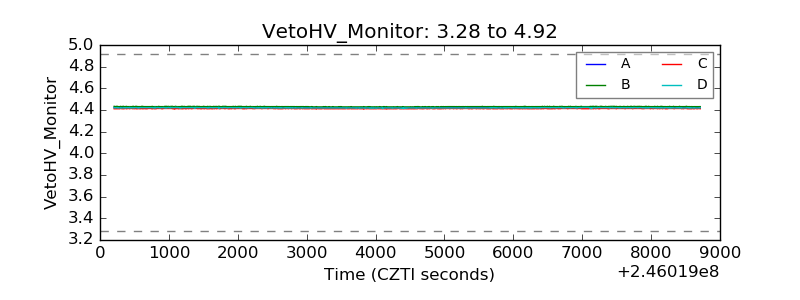 |
| Veto LLD | 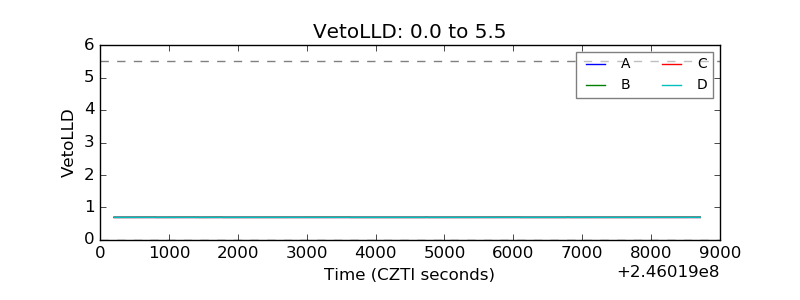 |
| Alpha Counter | 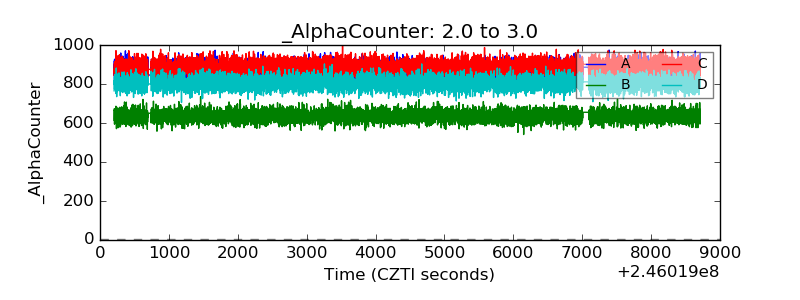 |
| _CPM_Rate | 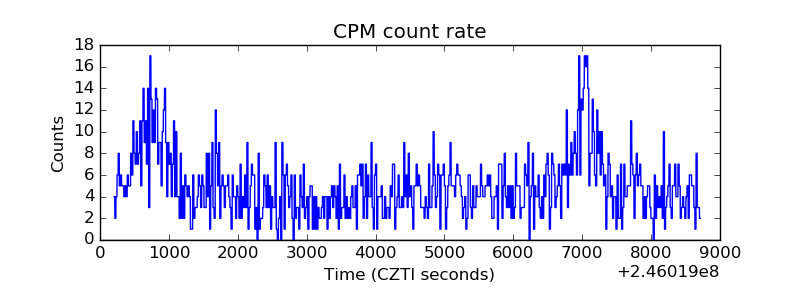 |
| CZT Counter | 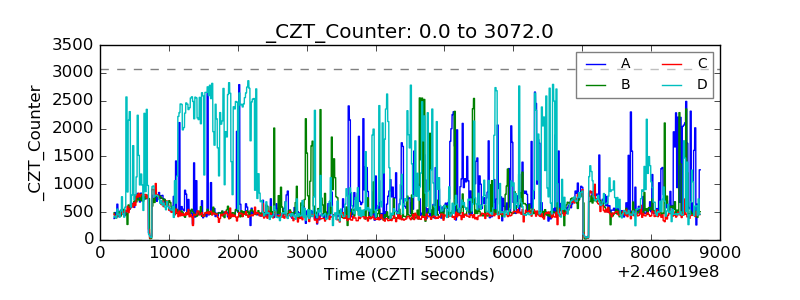 |
| +2.5 Volts monitor |  |
| +5 Volts monitor |  |
| _ROLL_ROT | 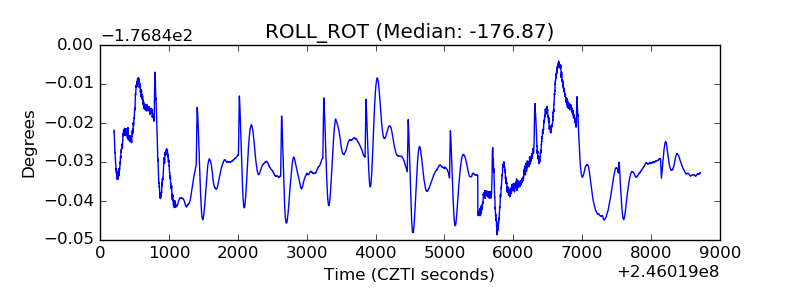 |
| _Roll_DEC | 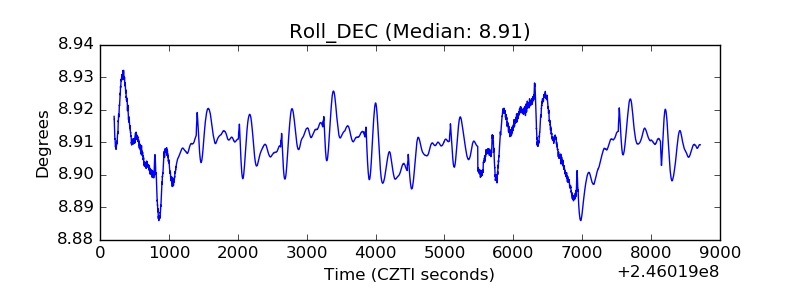 |
| _Roll_RA | 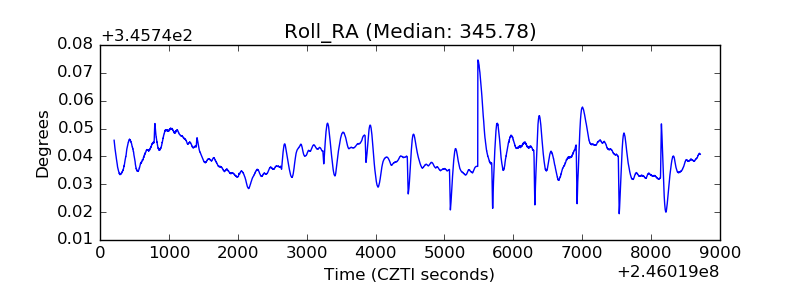 |
| Veto Counter | 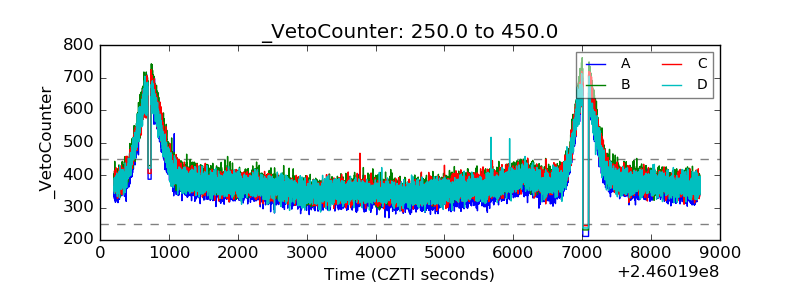 |