| Param | Original file | Final file |
|---|---|---|
| Filename | modeM0/AS1G08_071T02_9000001620_11124cztM0_level2.evt | modeM0/AS1G08_071T02_9000001620_11124cztM0_level2_quad_clean.evt |
| Size (bytes) | 689,250,240 | 105,958,080 |
| Size | 657.3 MB | 101.0 MB |
| Events in quadrant A | 6,695,993 | 649,129 |
| Events in quadrant B | 5,012,152 | 680,846 |
| Events in quadrant C | 3,462,727 | 690,156 |
| Events in quadrant D | 5,174,866 | 645,713 |
| Mode SS | |||
|---|---|---|---|
| Quadrant | BADHDUFLAG | Total packets | Discarded packets |
| A | 0 | 160 | 0 |
| B | 0 | 160 | 0 |
| C | 0 | 160 | 0 |
| D | 0 | 160 | 0 |
| Mode M9 | |||
|---|---|---|---|
| Quadrant | BADHDUFLAG | Total packets | Discarded packets |
| A | 0 | 3 | 0 |
| B | 0 | 3 | 0 |
| C | 0 | 3 | 0 |
| D | 0 | 3 | 0 |
| Mode M0 | |||
|---|---|---|---|
| Quadrant | BADHDUFLAG | Total packets | Discarded packets |
| A | 0 | 25068 | 2 |
| B | 0 | 19960 | 1 |
| C | 0 | 15840 | 1 |
| D | 0 | 20546 | 1 |
| Quadrant | Total seconds | Saturated seconds | Saturation percentage |
|---|---|---|---|
| A | 7798 | 892 | 11.438830% |
| B | 7798 | 420 | 5.385996% |
| C | 7798 | 26 | 0.333419% |
| D | 7798 | 437 | 5.604001% |
Noise dominated data is calculated using 1-second bins in cleaned event files. If a bin has >2000 counts, and if more than 50% of those come from <1% of pixels, then it is considered to be noise-dominated and hence unusable.
| Quadrant | # 1 sec bins | Bins with >0 counts | Bins with >2000 counts | High rate bins dominated by noise | Noise dominated (total time) | Noise dominated (detector-on time) | Marked lightcurve |
|---|---|---|---|---|---|---|---|
| A | 8163 | 7799 | 595 | 595 | 7.29% | 7.63% |  |
| B | 8163 | 7799 | 214 | 214 | 2.62% | 2.74% | 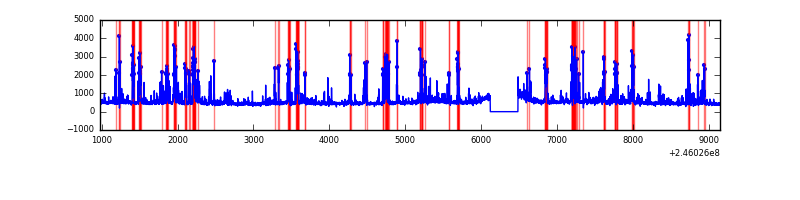 |
| C | 8163 | 7799 | 1 | 1 | 0.01% | 0.01% | 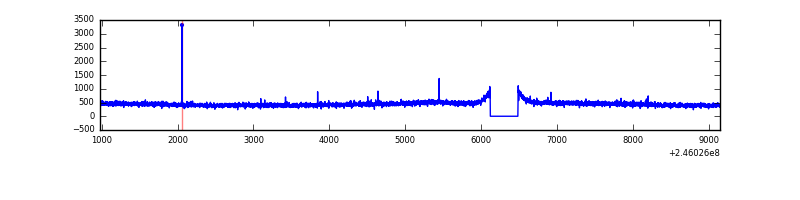 |
| D | 8163 | 7799 | 294 | 294 | 3.60% | 3.77% | 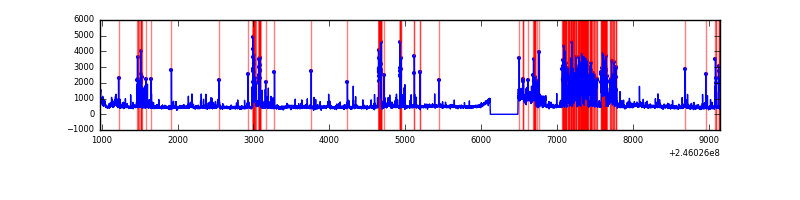 |
Top three noisy pixels from each quadrant. If the there are fewer than three noisy pixels in the level2.evt file, extra rows are filled as -1
| Pixel properties | Quadrant properties | ||||||
|---|---|---|---|---|---|---|---|
| Quadrant | DetID | PixID | Counts | Sigma | Mean | Median | Sigma |
| A | 8 | 5 | 3214994 | 17618.43 | 880 | 859 | 182.4 |
| A | 8 | 15 | 74863 | 405.66 | 880 | 859 | 182.4 |
| A | 14 | 63 | 12004 | 61.09 | 880 | 859 | 182.4 |
| B | 4 | 239 | 1232685 | 7182.5 | 896 | 874 | 171.5 |
| B | 15 | 204 | 100632 | 581.67 | 896 | 874 | 171.5 |
| B | 0 | 219 | 64714 | 372.24 | 896 | 874 | 171.5 |
| C | 13 | 61 | 6628 | 27.92 | 882 | 885 | 205.7 |
| C | 14 | 234 | 6411 | 26.87 | 882 | 885 | 205.7 |
| C | 8 | 128 | 5432 | 22.11 | 882 | 885 | 205.7 |
| D | 14 | 34 | 937499 | 4448.38 | 867 | 842 | 210.6 |
| D | 10 | 253 | 338882 | 1605.42 | 867 | 842 | 210.6 |
| D | 11 | 129 | 186025 | 879.47 | 867 | 842 | 210.6 |
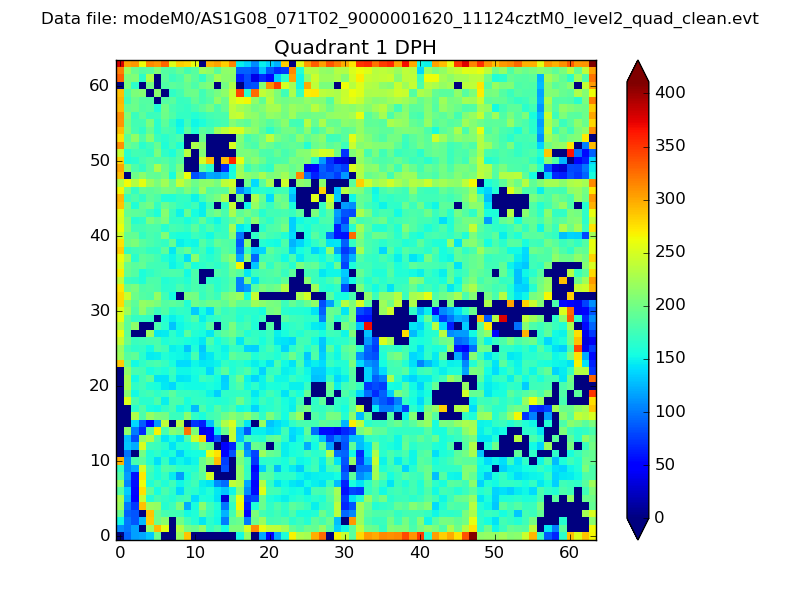
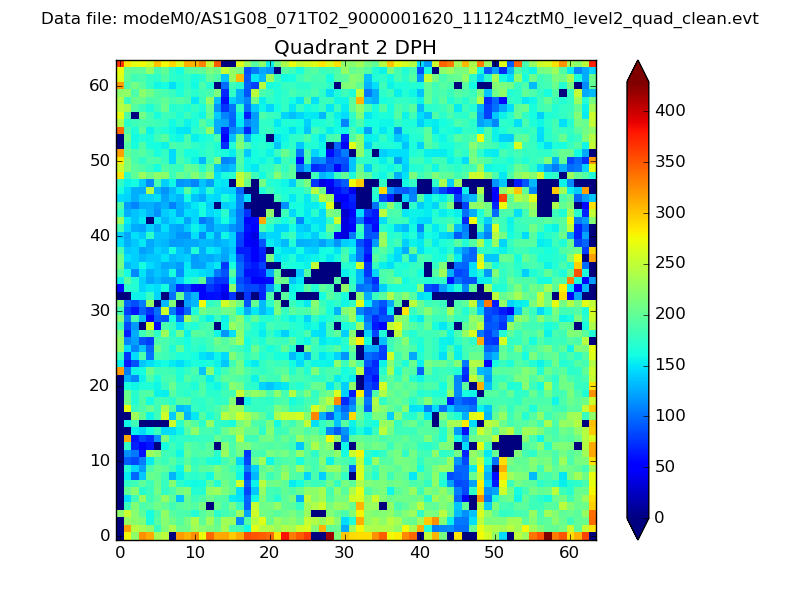
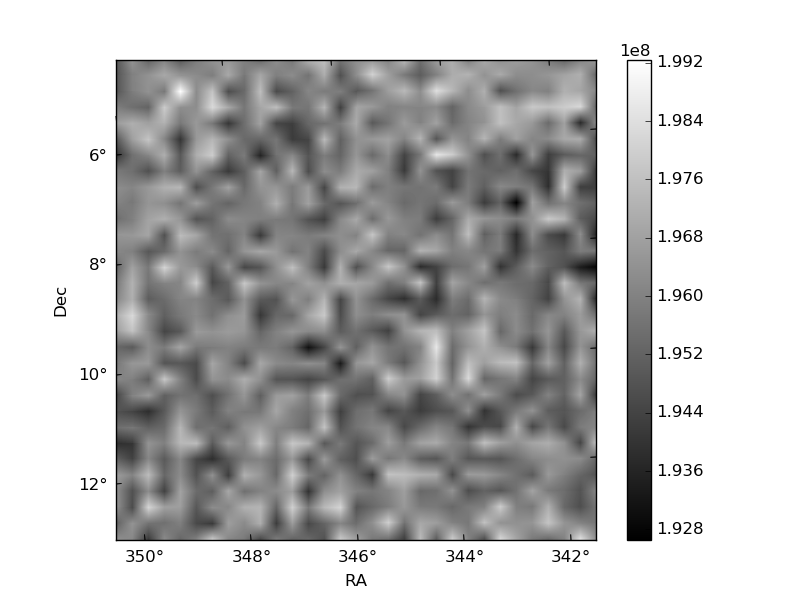
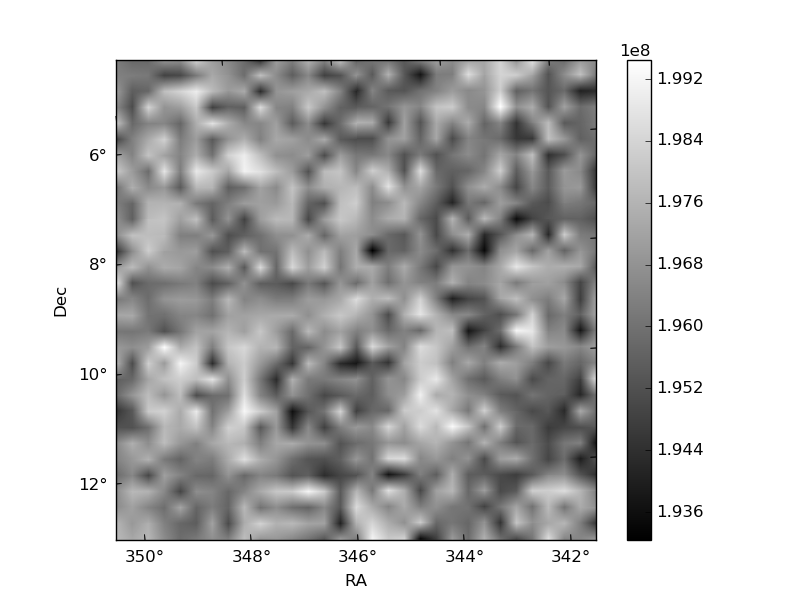
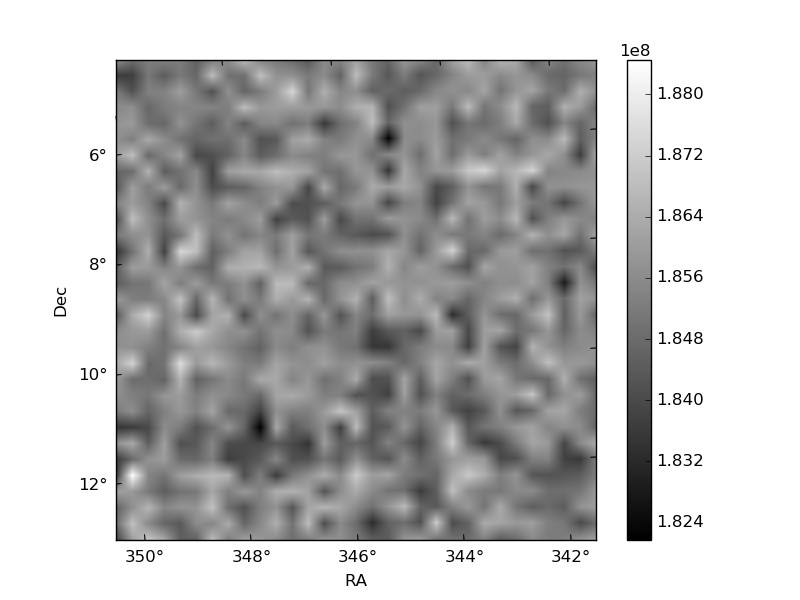
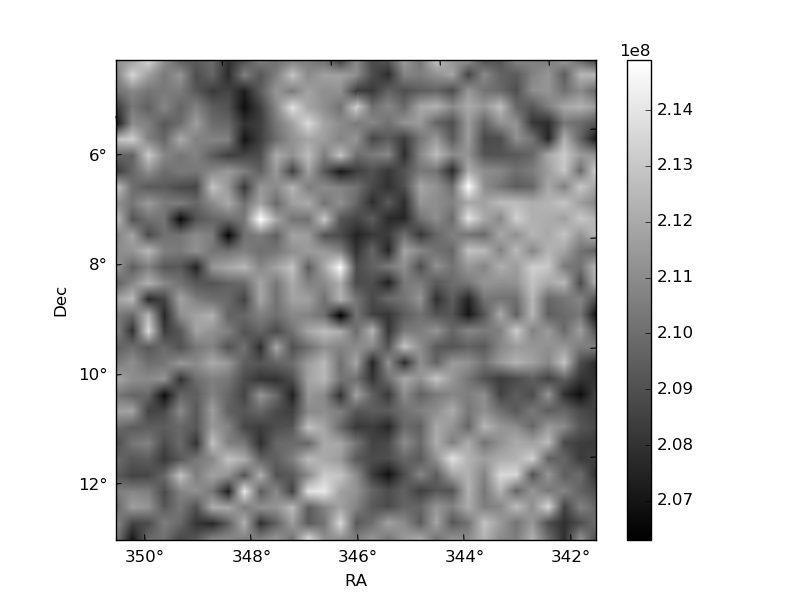
Histogram calculated using DETX and DETY for each event in the final _common_clean file
| Quadrant A | 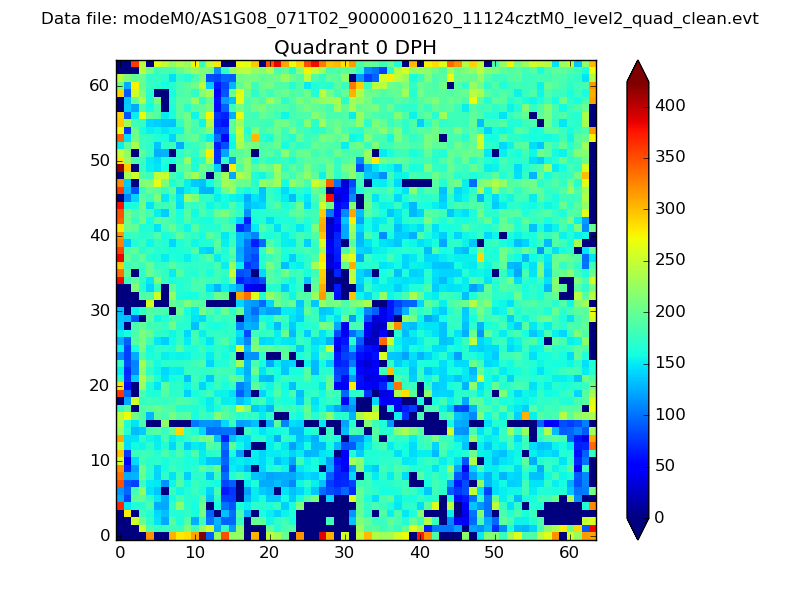 |
 |
Quadrant B |
|---|---|---|---|
| Quadrant D | 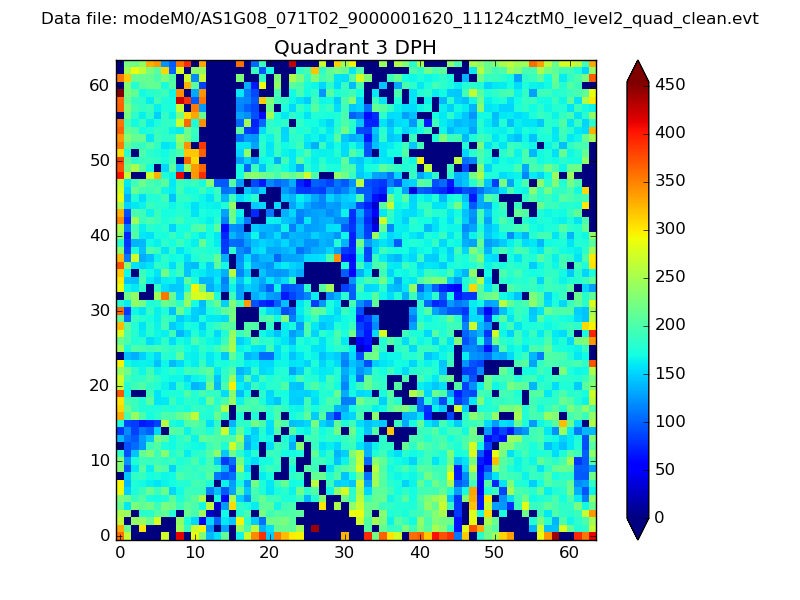 |
 |
Quadrant C |
| Plot type | Count rate plots | Images |
|---|---|---|
| Comparison with Poisson distribution Blue bars denote a histogram of data divided into 1 sec bins. Red curve is a Poisson curve with rate = median count rate of data. |
 |
 |
| Quadrant-wise count rates Data is divided into 100 sec bins |
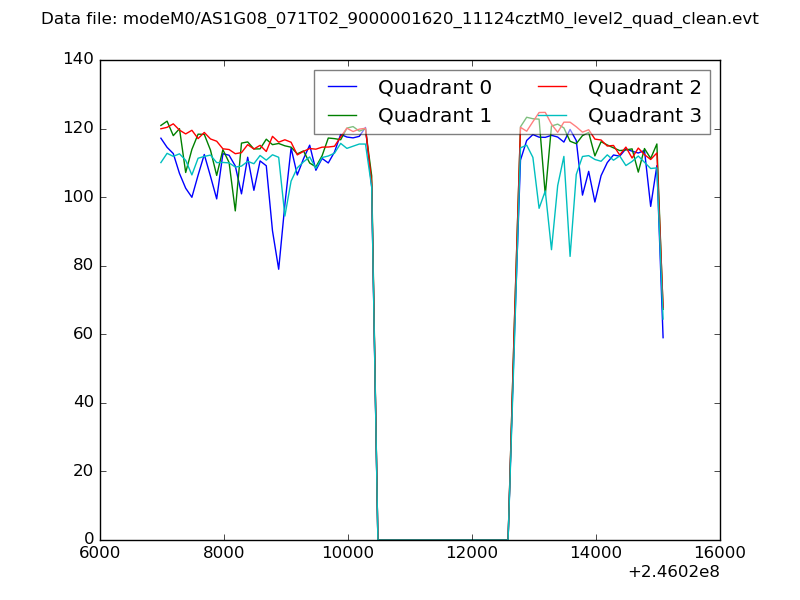 |
|
| Module-wise count rates for Quadrant A Data is divided into 100 sec bins |
 |
 |
| Module-wise count rates for Quadrant B Data is divided into 100 sec bins |
 |
 |
| Module-wise count rates for Quadrant C Data is divided into 100 sec bins |
 |
 |
| Module-wise count rates for Quadrant D Data is divided into 100 sec bins |
 |
 |
| Parameter | Plot |
|---|---|
| CZT HV Monitor |  |
| D_VDD | 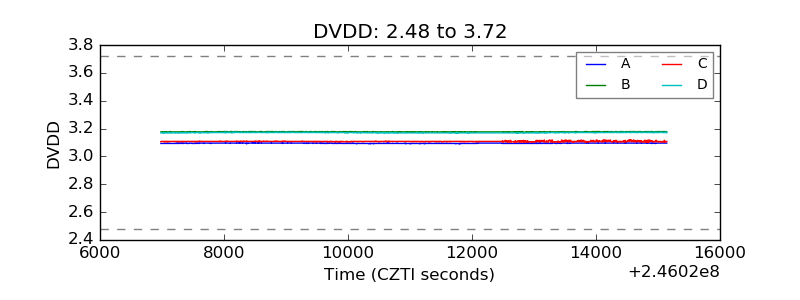 |
| Temperature 1 | 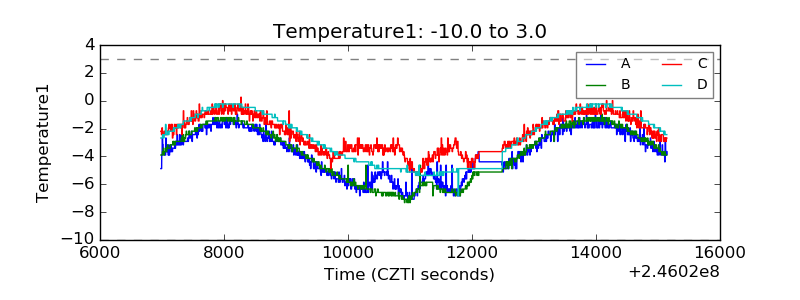 |
| Veto HV Monitor | 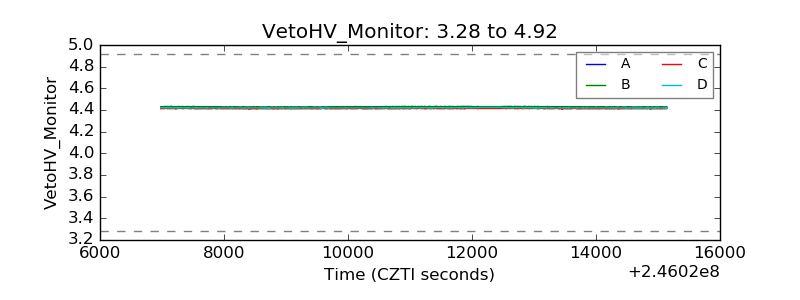 |
| Veto LLD | 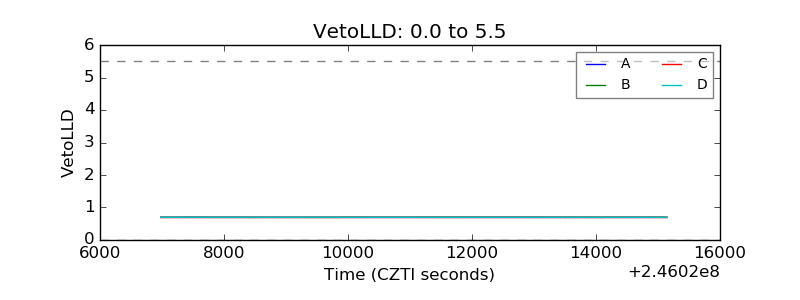 |
| Alpha Counter | 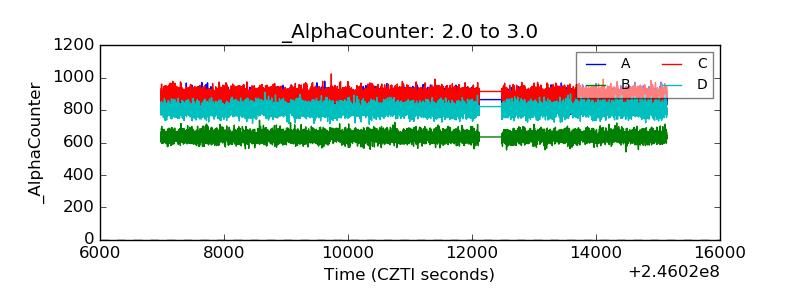 |
| _CPM_Rate | 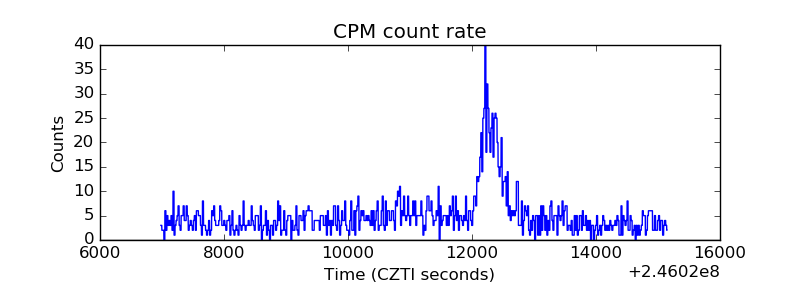 |
| CZT Counter | 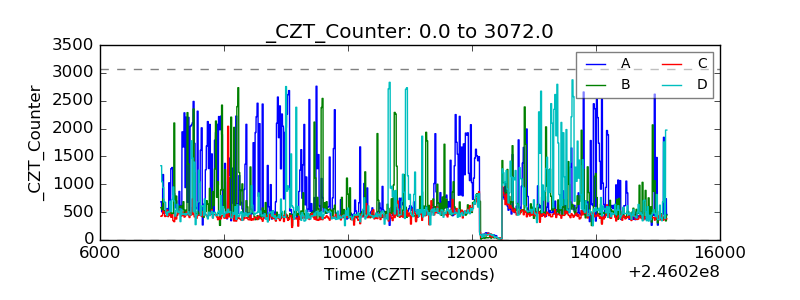 |
| +2.5 Volts monitor |  |
| +5 Volts monitor | 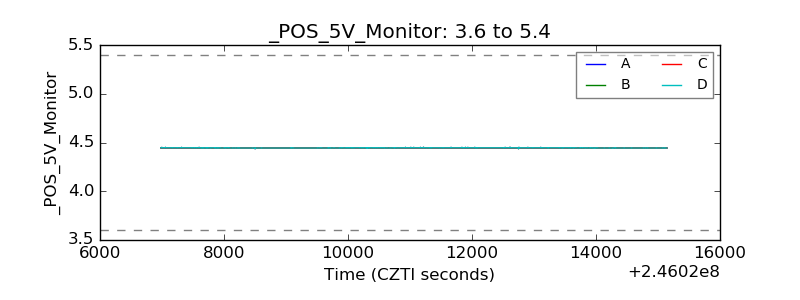 |
| _ROLL_ROT | 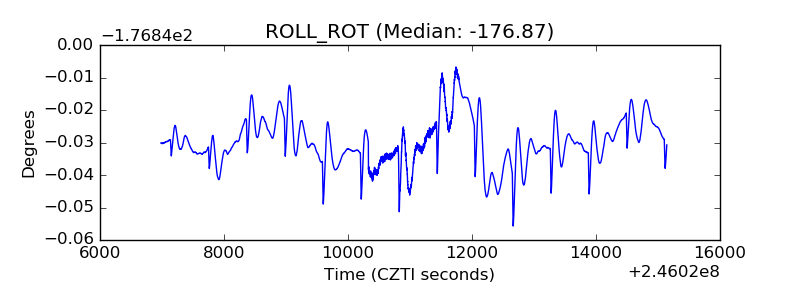 |
| _Roll_DEC | 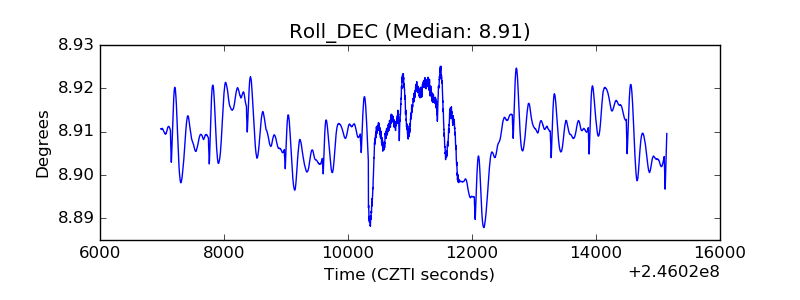 |
| _Roll_RA | 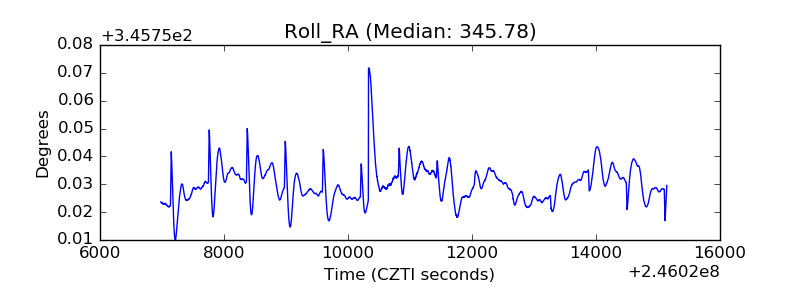 |
| Veto Counter |  |