| Param | Original file | Final file |
|---|---|---|
| Filename | modeM0/AS1G08_071T02_9000001620_11127cztM0_level2.evt | modeM0/AS1G08_071T02_9000001620_11127cztM0_level2_quad_clean.evt |
| Size (bytes) | 606,968,640 | 86,261,760 |
| Size | 578.9 MB | 82.3 MB |
| Events in quadrant A | 4,547,621 | 538,374 |
| Events in quadrant B | 4,638,037 | 550,130 |
| Events in quadrant C | 2,999,051 | 557,268 |
| Events in quadrant D | 5,749,178 | 504,576 |
| Mode SS | |||
|---|---|---|---|
| Quadrant | BADHDUFLAG | Total packets | Discarded packets |
| A | 0 | 134 | 0 |
| B | 0 | 134 | 0 |
| C | 0 | 134 | 0 |
| D | 0 | 134 | 0 |
| Mode M9 | |||
|---|---|---|---|
| Quadrant | BADHDUFLAG | Total packets | Discarded packets |
| A | 0 | 17 | 0 |
| B | 0 | 17 | 0 |
| C | 0 | 17 | 0 |
| D | 0 | 18 | 0 |
| Mode M0 | |||
|---|---|---|---|
| Quadrant | BADHDUFLAG | Total packets | Discarded packets |
| A | 0 | 18101 | 3 |
| B | 0 | 18080 | 2 |
| C | 0 | 13490 | 2 |
| D | 0 | 21577 | 2 |
| Quadrant | Total seconds | Saturated seconds | Saturation percentage |
|---|---|---|---|
| A | 6620 | 312 | 4.712991% |
| B | 6620 | 411 | 6.208459% |
| C | 6620 | 36 | 0.543807% |
| D | 6620 | 642 | 9.697885% |
Noise dominated data is calculated using 1-second bins in cleaned event files. If a bin has >2000 counts, and if more than 50% of those come from <1% of pixels, then it is considered to be noise-dominated and hence unusable.
| Quadrant | # 1 sec bins | Bins with >0 counts | Bins with >2000 counts | High rate bins dominated by noise | Noise dominated (total time) | Noise dominated (detector-on time) | Marked lightcurve |
|---|---|---|---|---|---|---|---|
| A | 7655 | 6621 | 192 | 192 | 2.51% | 2.90% | 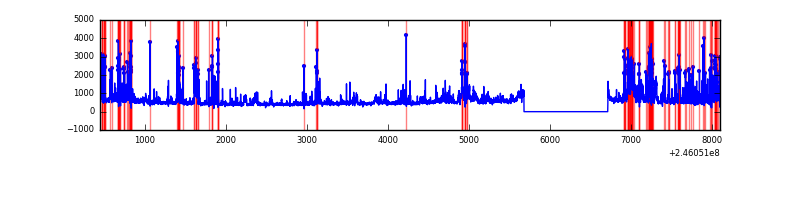 |
| B | 7655 | 6621 | 233 | 233 | 3.04% | 3.52% | 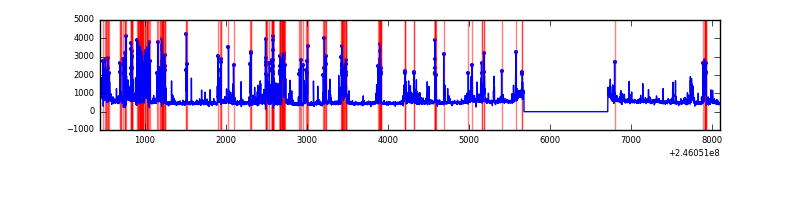 |
| C | 7655 | 6621 | 0 | 0 | 0.00% | 0.00% |  |
| D | 7655 | 6621 | 500 | 500 | 6.53% | 7.55% | 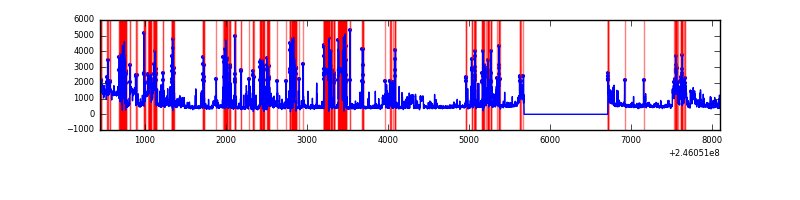 |
Top three noisy pixels from each quadrant. If the there are fewer than three noisy pixels in the level2.evt file, extra rows are filled as -1
| Pixel properties | Quadrant properties | ||||||
|---|---|---|---|---|---|---|---|
| Quadrant | DetID | PixID | Counts | Sigma | Mean | Median | Sigma |
| A | 8 | 5 | 1498988 | 9451.87 | 773 | 757 | 158.5 |
| A | 8 | 15 | 51969 | 323.08 | 773 | 757 | 158.5 |
| A | 14 | 63 | 12990 | 77.17 | 773 | 757 | 158.5 |
| B | 4 | 239 | 732716 | 4900.24 | 777 | 758 | 149.4 |
| B | 10 | 16 | 703950 | 4707.66 | 777 | 758 | 149.4 |
| B | 0 | 219 | 69930 | 463.09 | 777 | 758 | 149.4 |
| C | 13 | 61 | 5787 | 28.14 | 767 | 772 | 178.2 |
| C | 8 | 222 | 3805 | 17.02 | 767 | 772 | 178.2 |
| C | 14 | 234 | 3126 | 13.21 | 767 | 772 | 178.2 |
| D | 1 | 52 | 1339348 | 7544.82 | 728 | 706 | 177.4 |
| D | 10 | 253 | 957683 | 5393.69 | 728 | 706 | 177.4 |
| D | 11 | 129 | 300360 | 1688.9 | 728 | 706 | 177.4 |
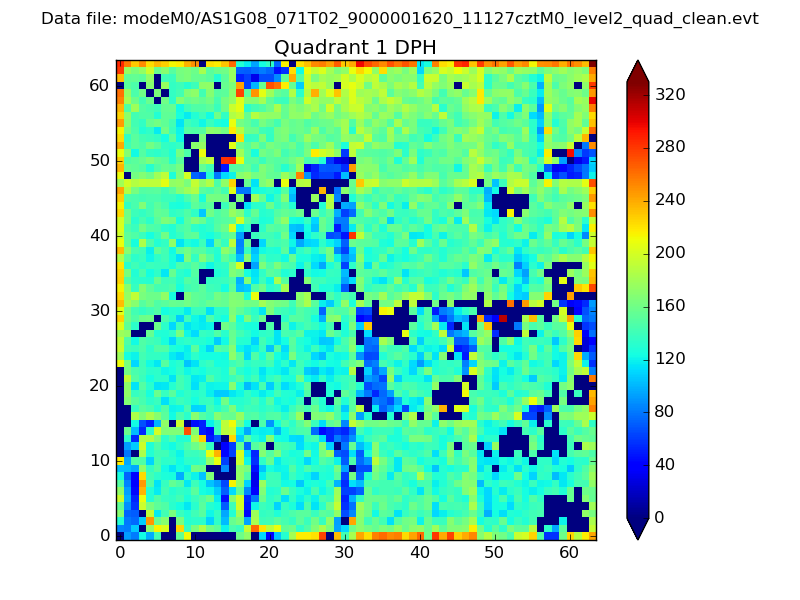
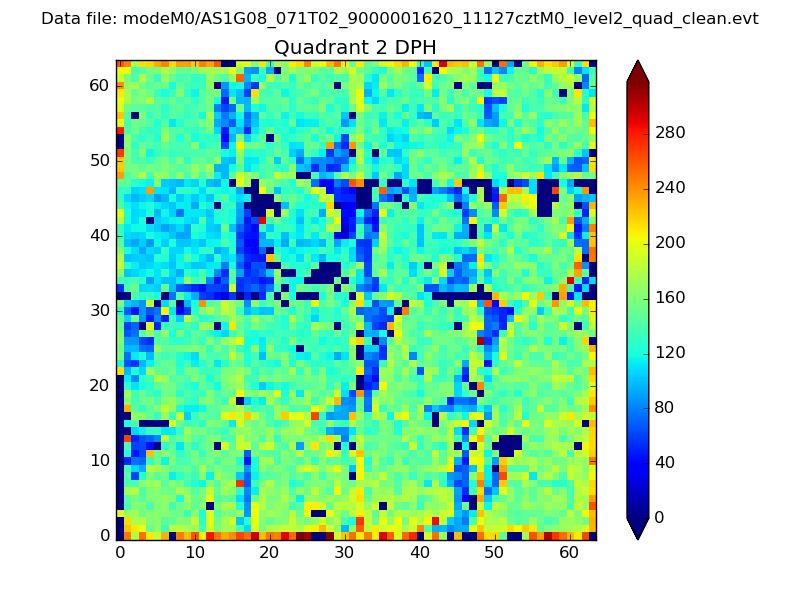
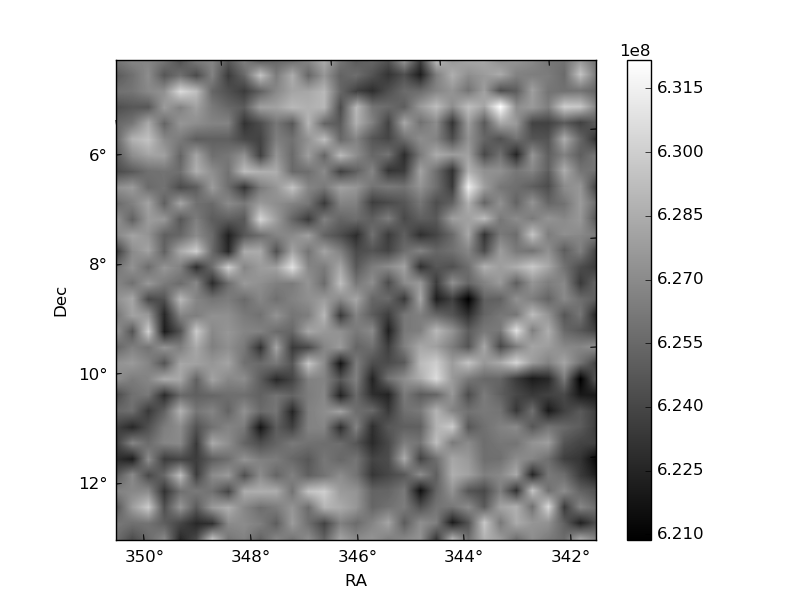
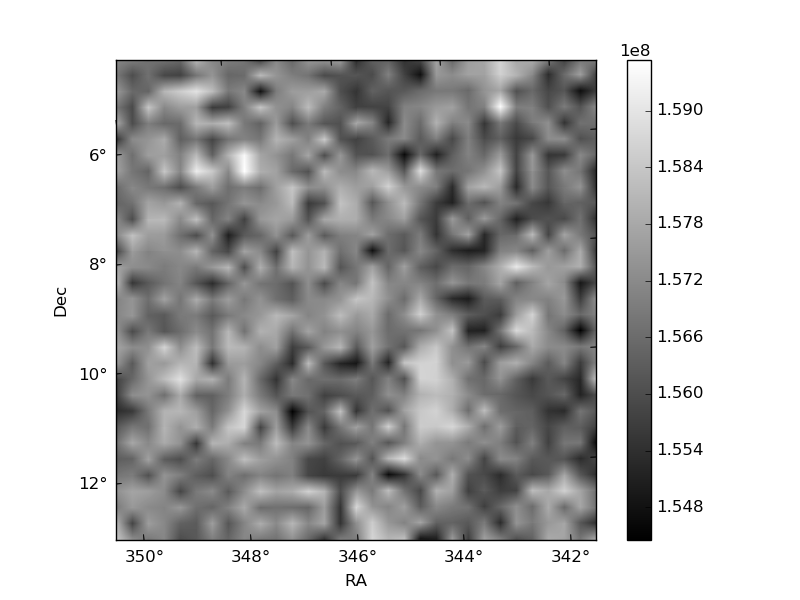
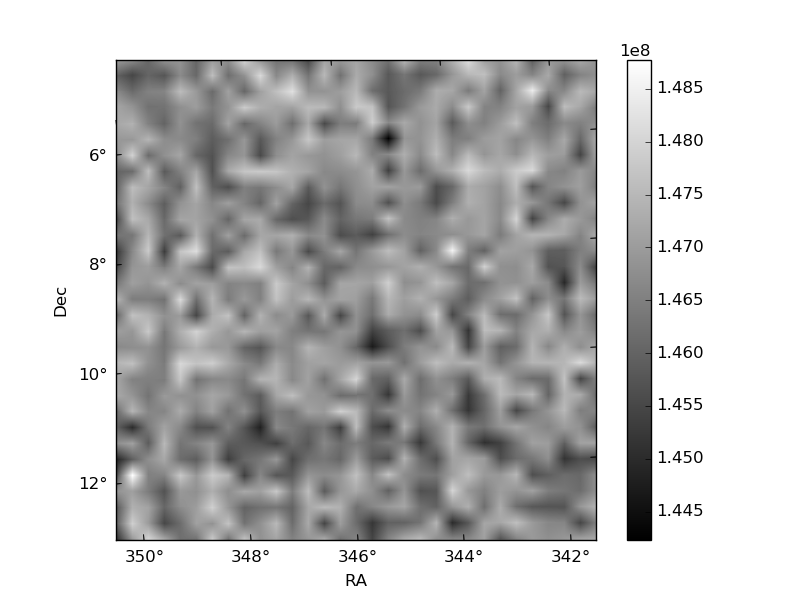
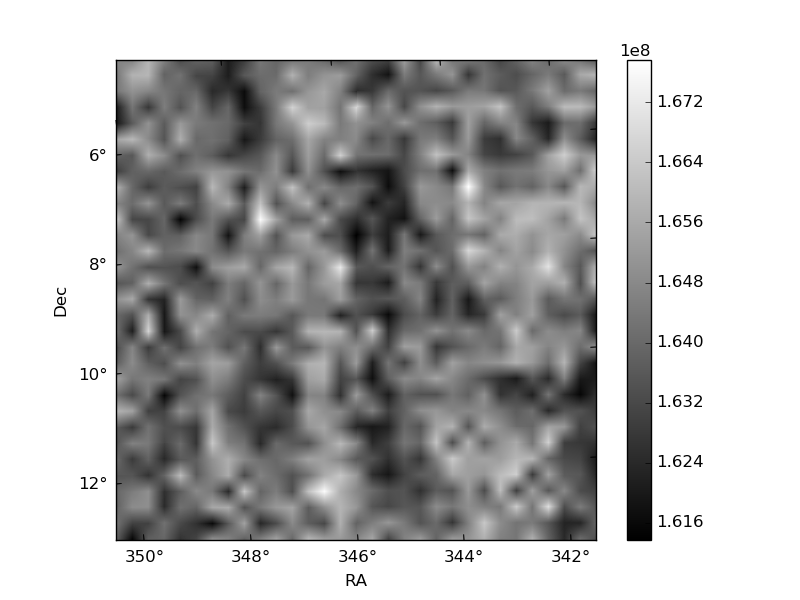
Histogram calculated using DETX and DETY for each event in the final _common_clean file
| Quadrant A | 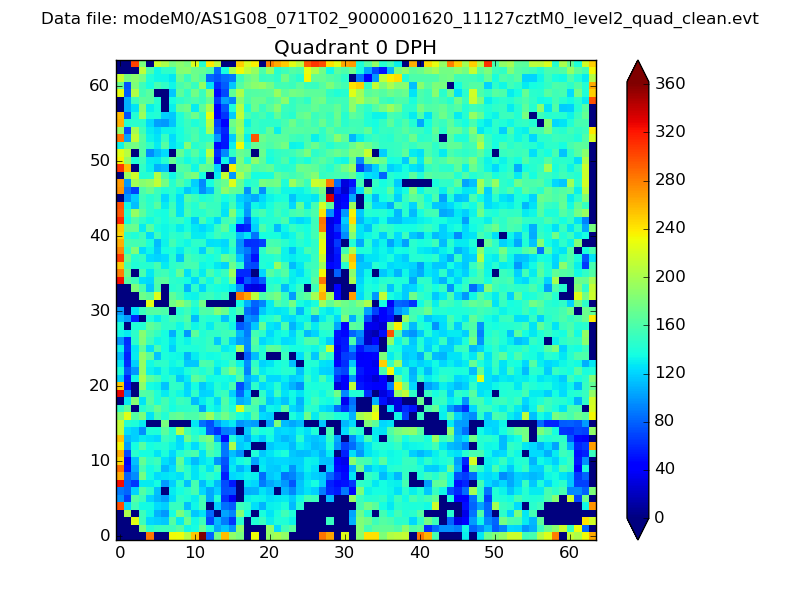 |
 |
Quadrant B |
|---|---|---|---|
| Quadrant D | 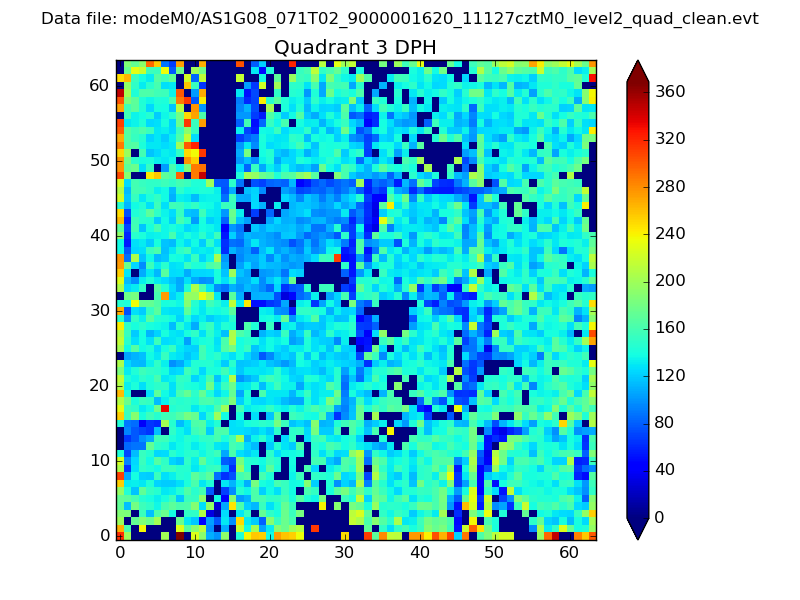 |
 |
Quadrant C |
| Plot type | Count rate plots | Images |
|---|---|---|
| Comparison with Poisson distribution Blue bars denote a histogram of data divided into 1 sec bins. Red curve is a Poisson curve with rate = median count rate of data. |
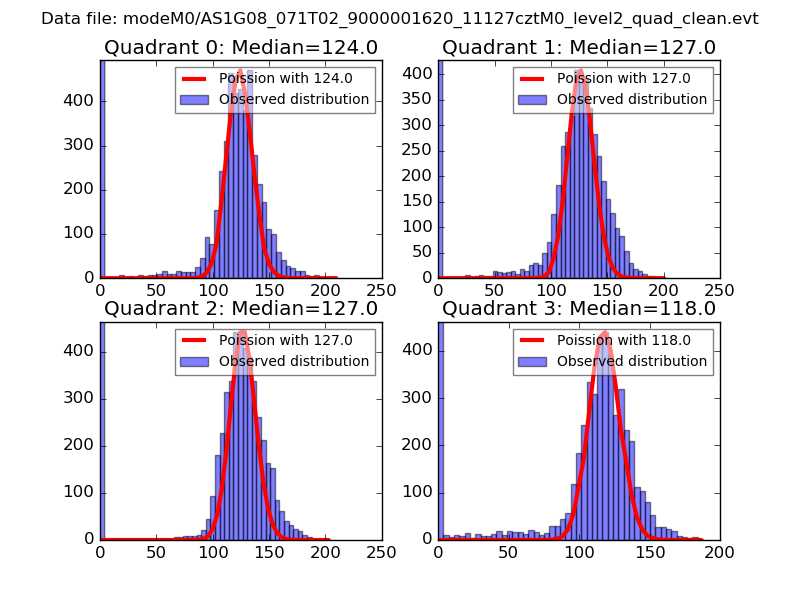 |
 |
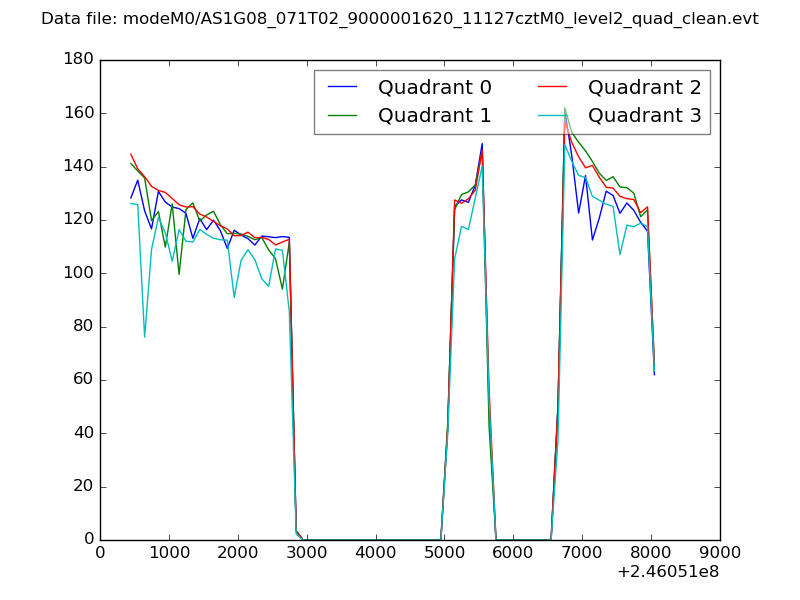
| Quadrant-wise count rates Data is divided into 100 sec bins |
 |
|
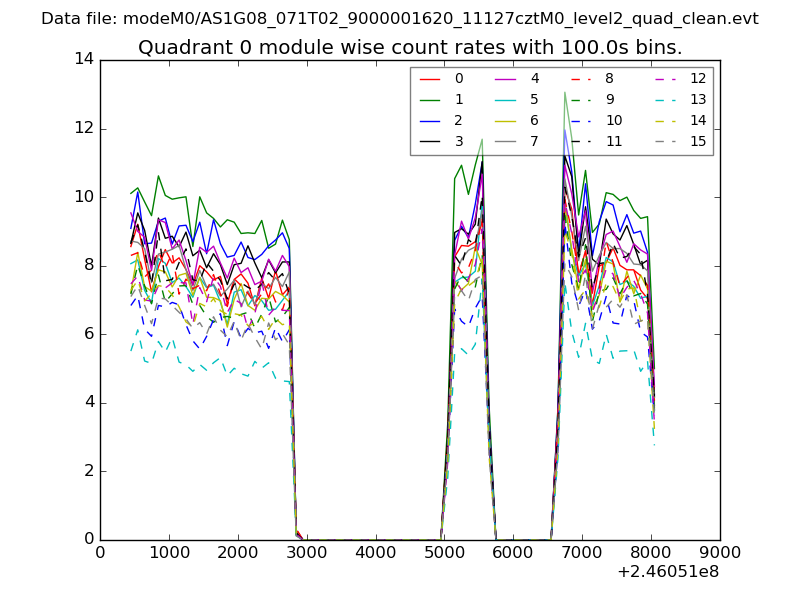
| Module-wise count rates for Quadrant A Data is divided into 100 sec bins |
 |
 |
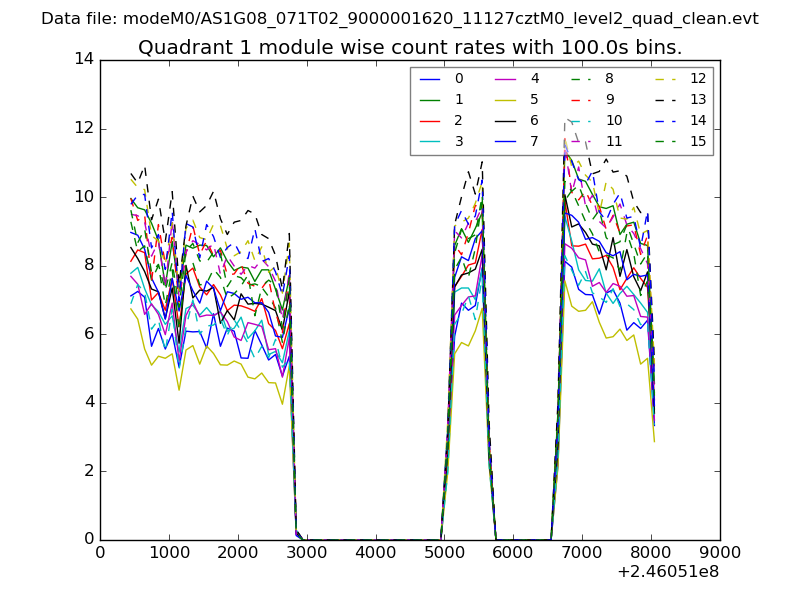
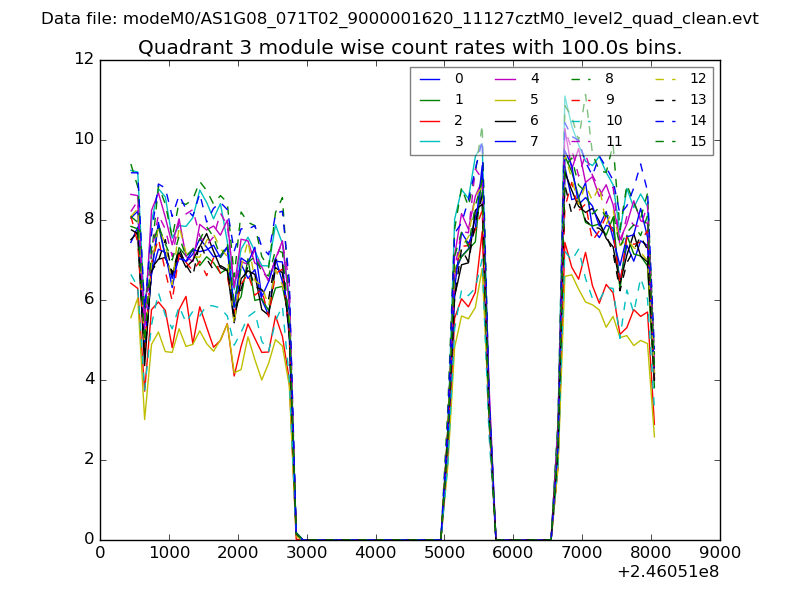
| Module-wise count rates for Quadrant B Data is divided into 100 sec bins |
 |
 |
| Module-wise count rates for Quadrant C Data is divided into 100 sec bins |
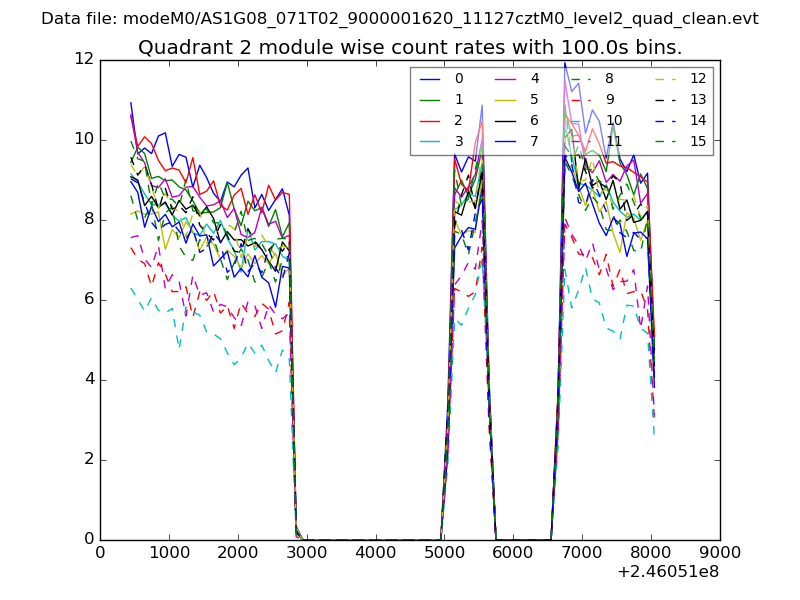 |
 |
| Module-wise count rates for Quadrant D Data is divided into 100 sec bins |
 |
 |
| Parameter | Plot |
|---|---|
| CZT HV Monitor | 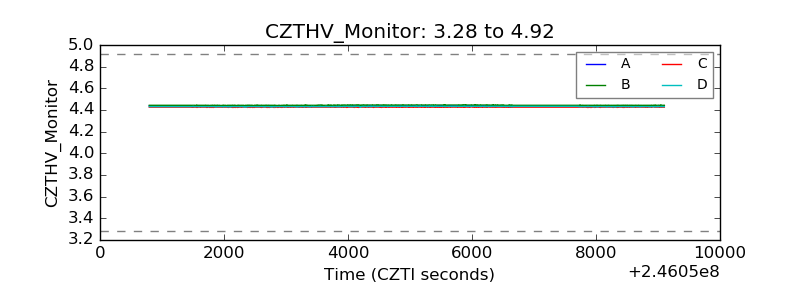 |
| D_VDD | 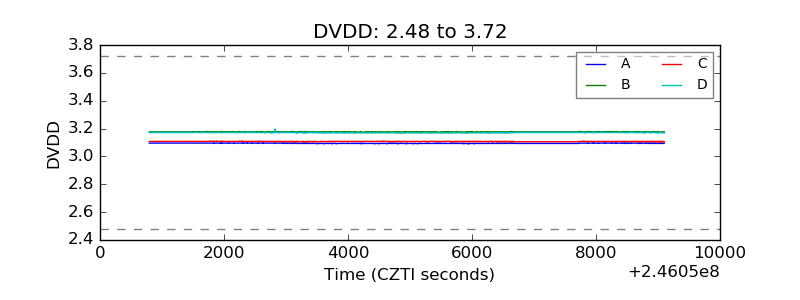 |
| Temperature 1 | 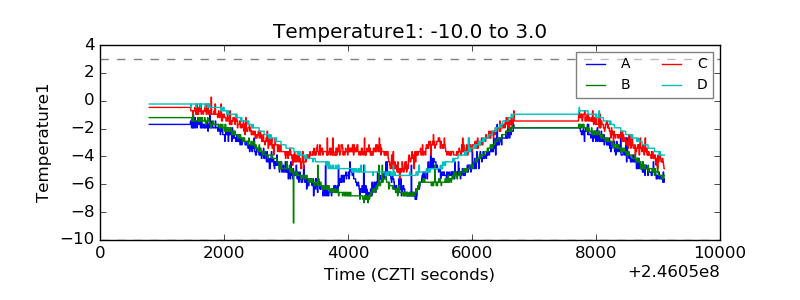 |
| Veto HV Monitor |  |
| Veto LLD | 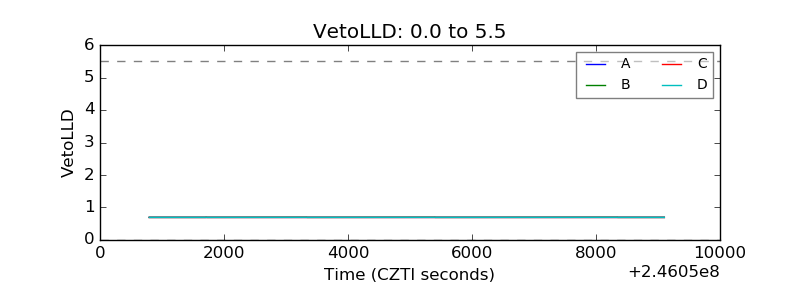 |
| Alpha Counter | 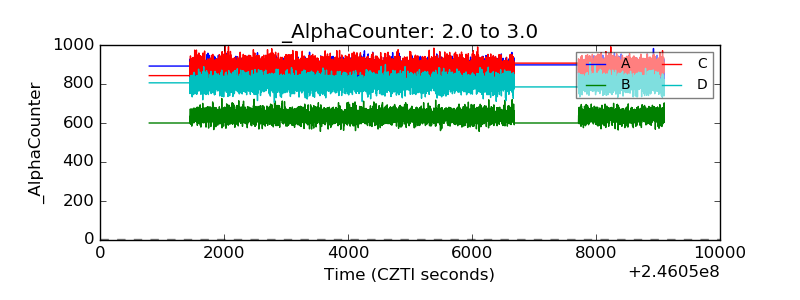 |
| _CPM_Rate | 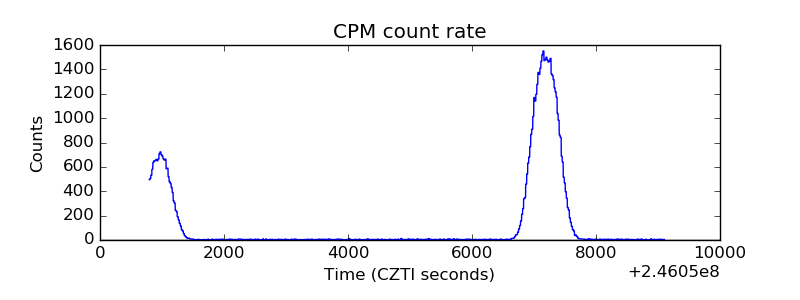 |
| CZT Counter | 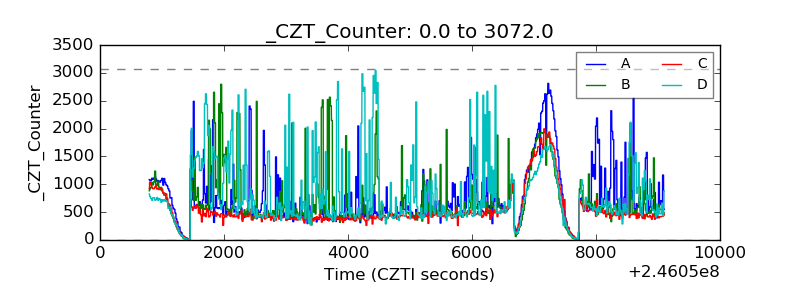 |
| +2.5 Volts monitor |  |
| +5 Volts monitor |  |
| _ROLL_ROT |  |
| _Roll_DEC | 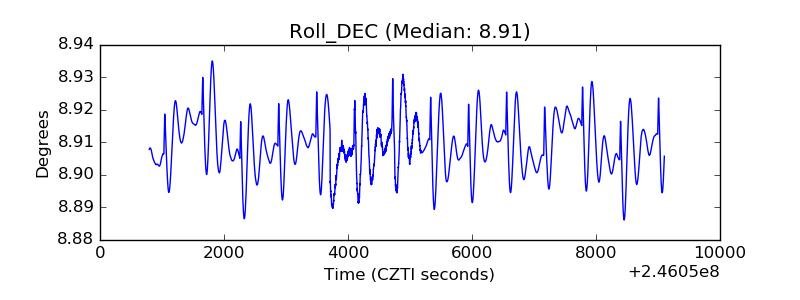 |
| _Roll_RA | 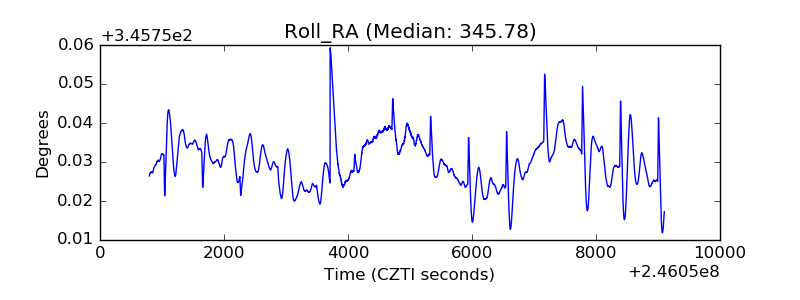 |
| Veto Counter | 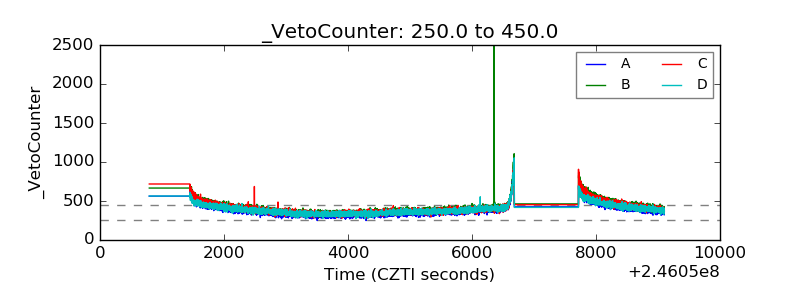 |