| Param | Original file | Final file |
|---|---|---|
| Filename | modeM0/AS1G08_071T02_9000001620_11128cztM0_level2.evt | modeM0/AS1G08_071T02_9000001620_11128cztM0_level2_quad_clean.evt |
| Size (bytes) | 548,046,720 | 85,069,440 |
| Size | 522.7 MB | 81.1 MB |
| Events in quadrant A | 4,478,746 | 533,838 |
| Events in quadrant B | 3,801,203 | 555,028 |
| Events in quadrant C | 2,922,269 | 547,615 |
| Events in quadrant D | 4,965,958 | 497,139 |
| Mode SS | |||
|---|---|---|---|
| Quadrant | BADHDUFLAG | Total packets | Discarded packets |
| A | 0 | 130 | 0 |
| B | 0 | 130 | 0 |
| C | 0 | 130 | 0 |
| D | 0 | 130 | 0 |
| Mode M9 | |||
|---|---|---|---|
| Quadrant | BADHDUFLAG | Total packets | Discarded packets |
| A | 0 | 15 | 0 |
| B | 0 | 15 | 0 |
| C | 0 | 15 | 0 |
| D | 0 | 16 | 0 |
| Mode M0 | |||
|---|---|---|---|
| Quadrant | BADHDUFLAG | Total packets | Discarded packets |
| A | 0 | 17487 | 3 |
| B | 0 | 15449 | 2 |
| C | 0 | 12940 | 2 |
| D | 0 | 18939 | 2 |
| Quadrant | Total seconds | Saturated seconds | Saturation percentage |
|---|---|---|---|
| A | 6334 | 238 | 3.757499% |
| B | 6334 | 167 | 2.636565% |
| C | 6334 | 22 | 0.347332% |
| D | 6334 | 482 | 7.609725% |
Noise dominated data is calculated using 1-second bins in cleaned event files. If a bin has >2000 counts, and if more than 50% of those come from <1% of pixels, then it is considered to be noise-dominated and hence unusable.
| Quadrant | # 1 sec bins | Bins with >0 counts | Bins with >2000 counts | High rate bins dominated by noise | Noise dominated (total time) | Noise dominated (detector-on time) | Marked lightcurve |
|---|---|---|---|---|---|---|---|
| A | 7499 | 6335 | 159 | 159 | 2.12% | 2.51% | 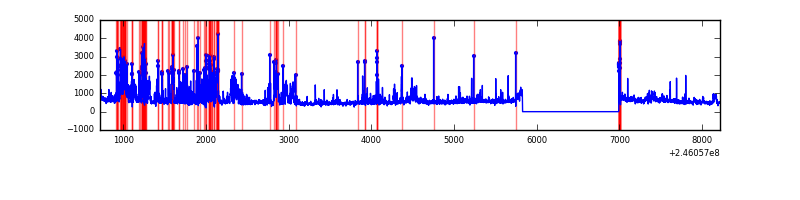 |
| B | 7499 | 6335 | 80 | 80 | 1.07% | 1.26% | 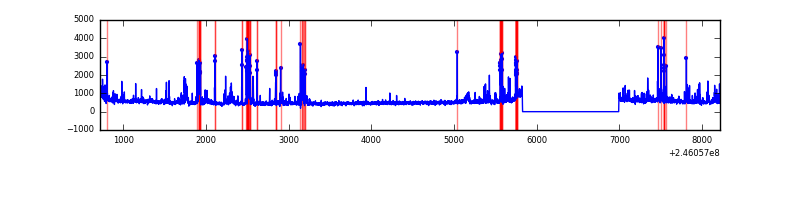 |
| C | 7499 | 6335 | 0 | 0 | 0.00% | 0.00% |  |
| D | 7499 | 6335 | 408 | 408 | 5.44% | 6.44% | 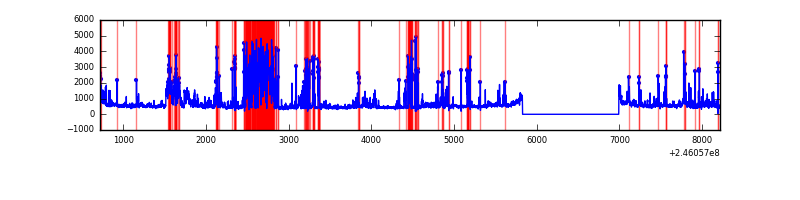 |
Top three noisy pixels from each quadrant. If the there are fewer than three noisy pixels in the level2.evt file, extra rows are filled as -1
| Pixel properties | Quadrant properties | ||||||
|---|---|---|---|---|---|---|---|
| Quadrant | DetID | PixID | Counts | Sigma | Mean | Median | Sigma |
| A | 8 | 5 | 1453422 | 9535.82 | 755 | 739 | 152.3 |
| A | 14 | 63 | 49427 | 319.6 | 755 | 739 | 152.3 |
| A | 11 | 29 | 32236 | 206.76 | 755 | 739 | 152.3 |
| B | 4 | 239 | 496974 | 3385.56 | 771 | 753 | 146.6 |
| B | 10 | 16 | 92371 | 625.08 | 771 | 753 | 146.6 |
| B | 0 | 219 | 83172 | 562.32 | 771 | 753 | 146.6 |
| C | 13 | 61 | 5602 | 27.8 | 748 | 752 | 174.4 |
| C | 0 | 10 | 2904 | 12.34 | 748 | 752 | 174.4 |
| C | 8 | 222 | 2500 | 10.02 | 748 | 752 | 174.4 |
| D | 1 | 52 | 1051486 | 6051.03 | 713 | 693 | 173.7 |
| D | 10 | 253 | 595123 | 3423.05 | 713 | 693 | 173.7 |
| D | 11 | 129 | 292549 | 1680.66 | 713 | 693 | 173.7 |
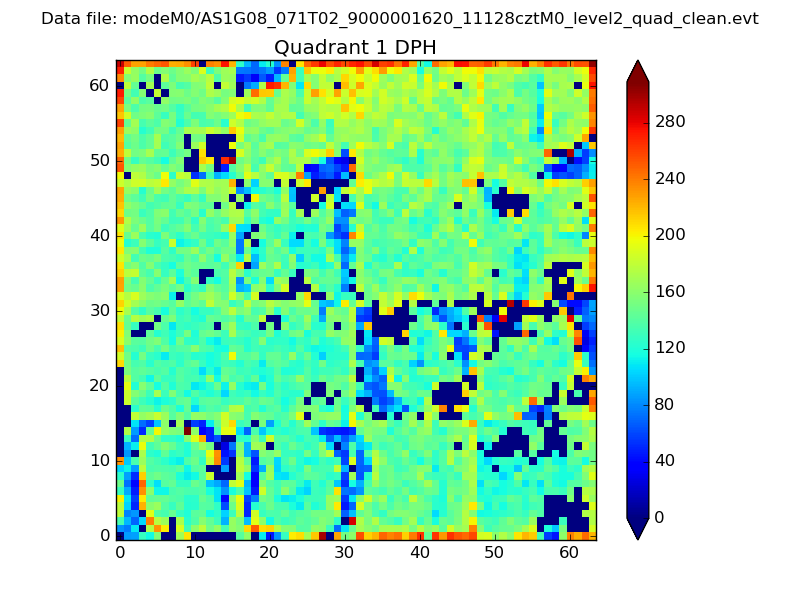
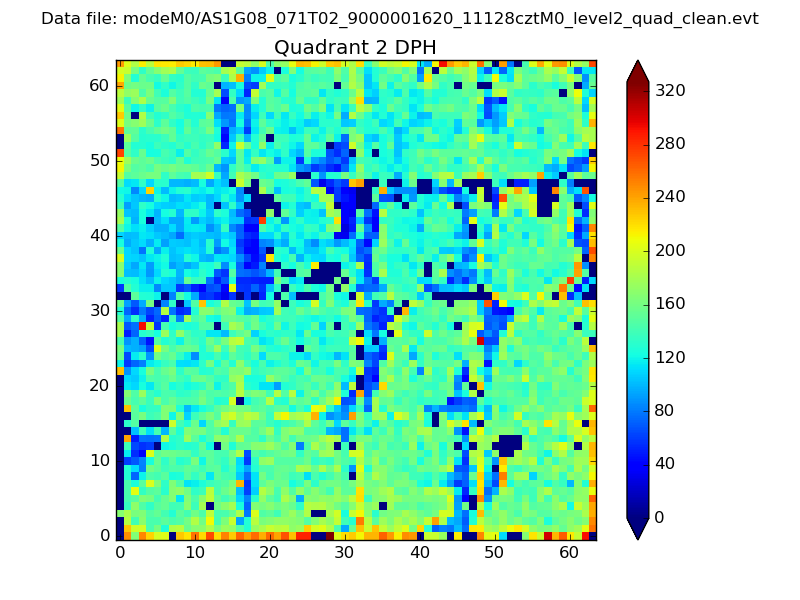
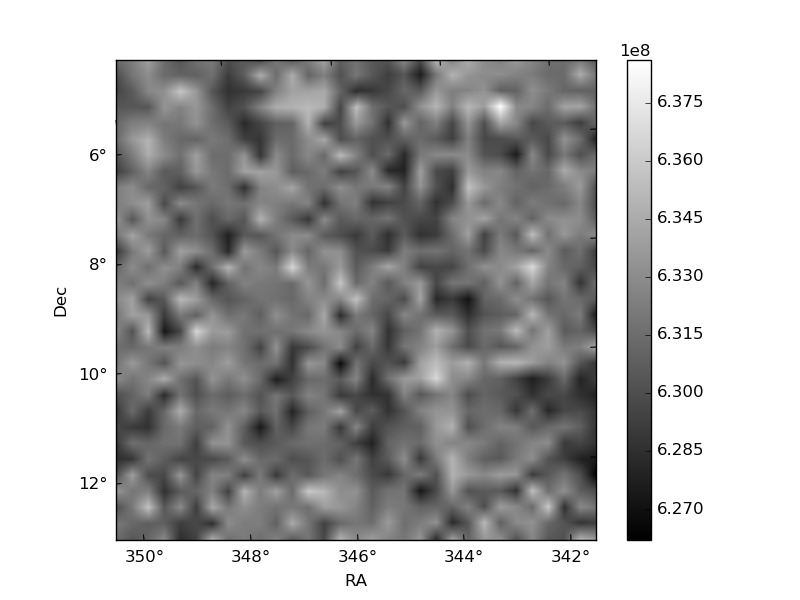
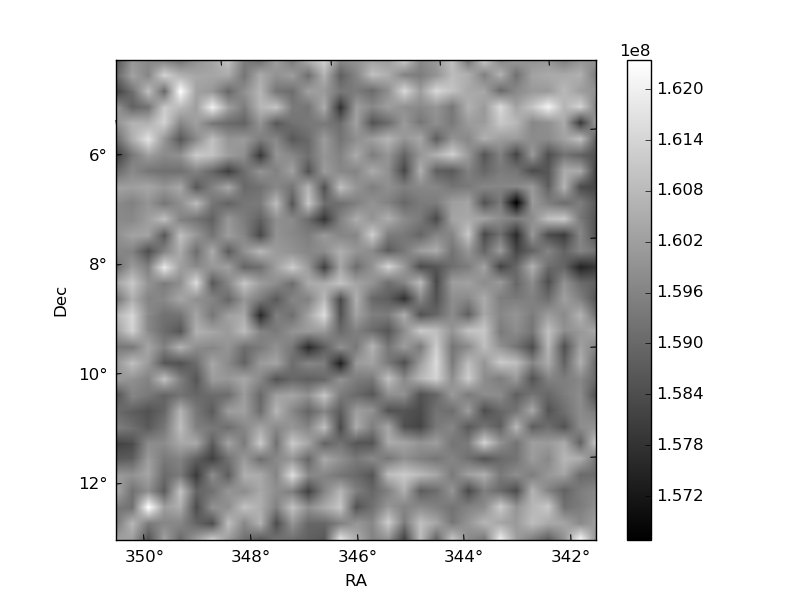
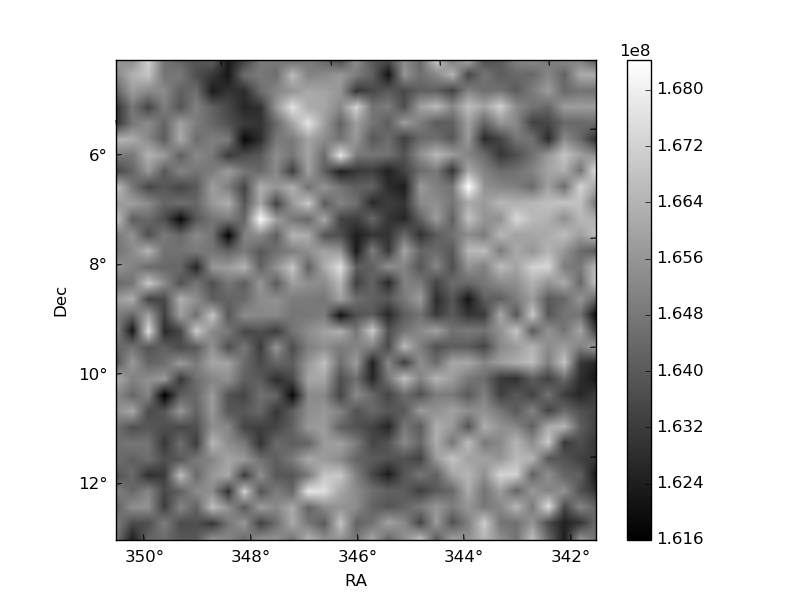
Histogram calculated using DETX and DETY for each event in the final _common_clean file
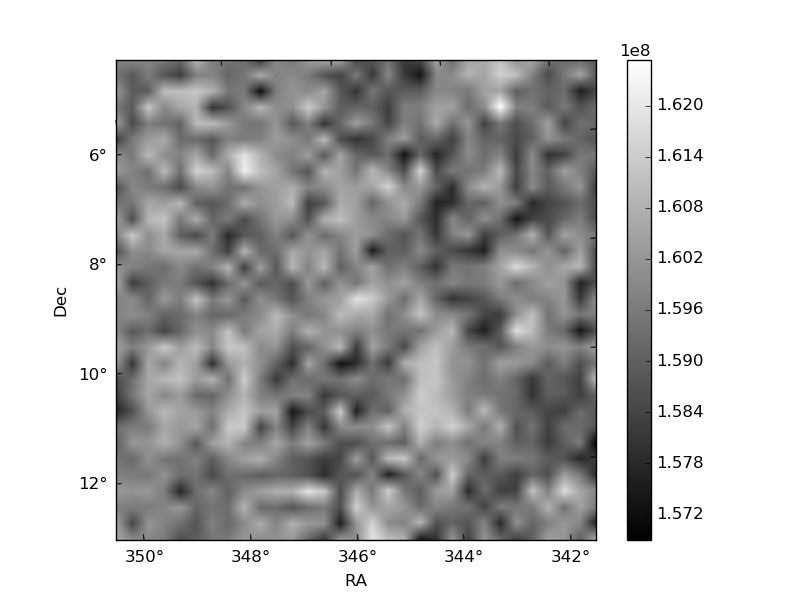
| Quadrant A | 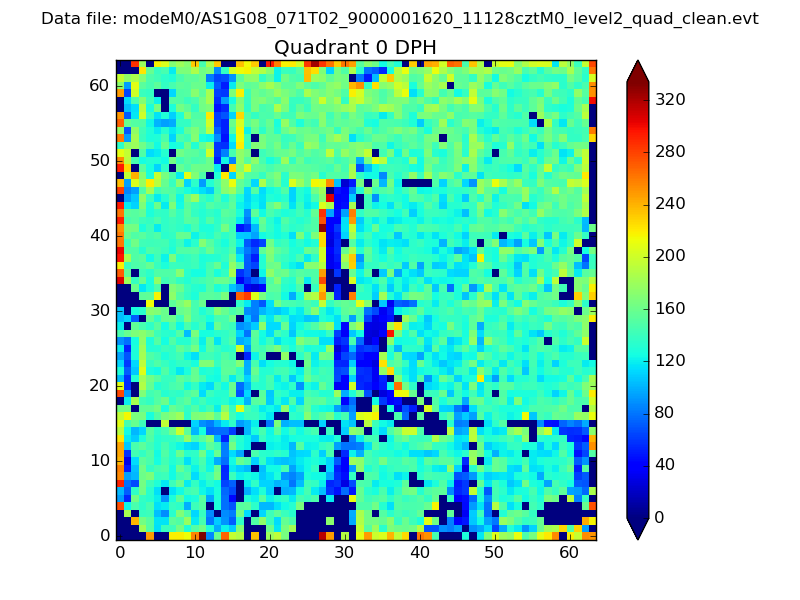 |
 |
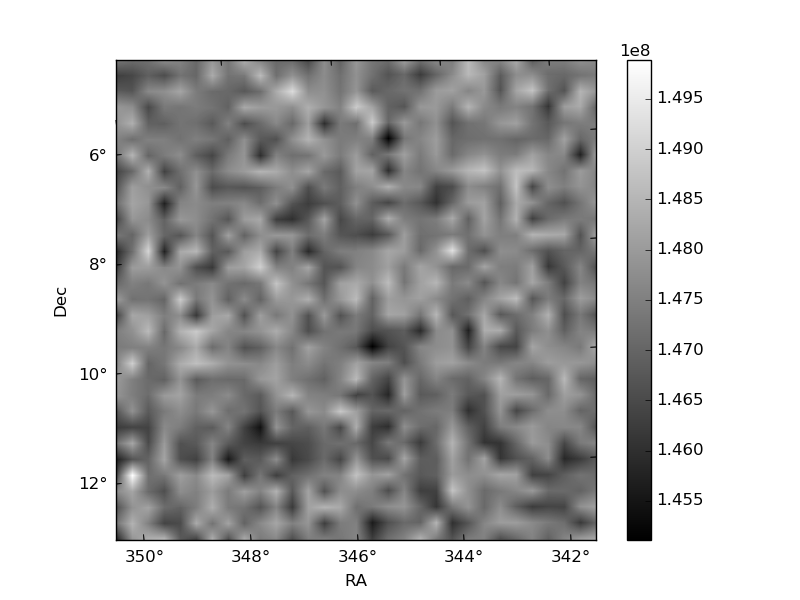
Quadrant B |
|---|---|---|---|
| Quadrant D | 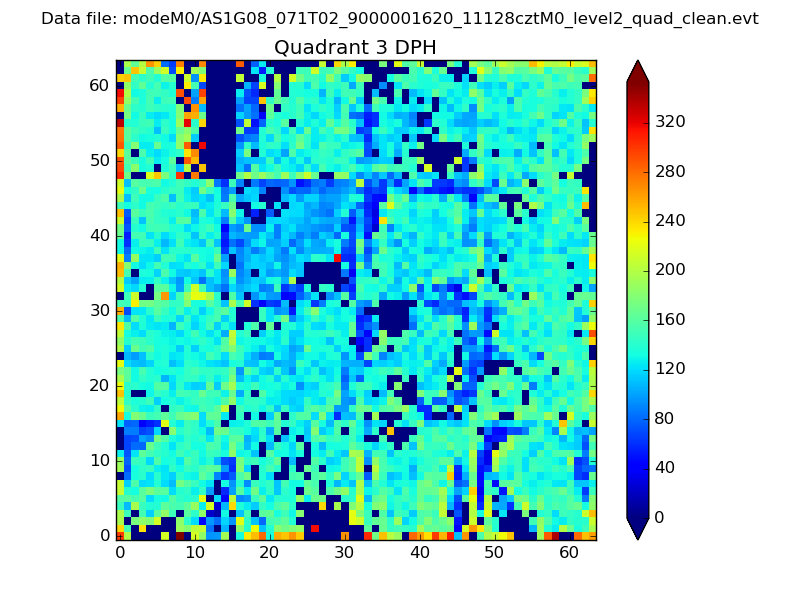 |
 |
Quadrant C |
| Plot type | Count rate plots | Images |
|---|---|---|
| Comparison with Poisson distribution Blue bars denote a histogram of data divided into 1 sec bins. Red curve is a Poisson curve with rate = median count rate of data. |
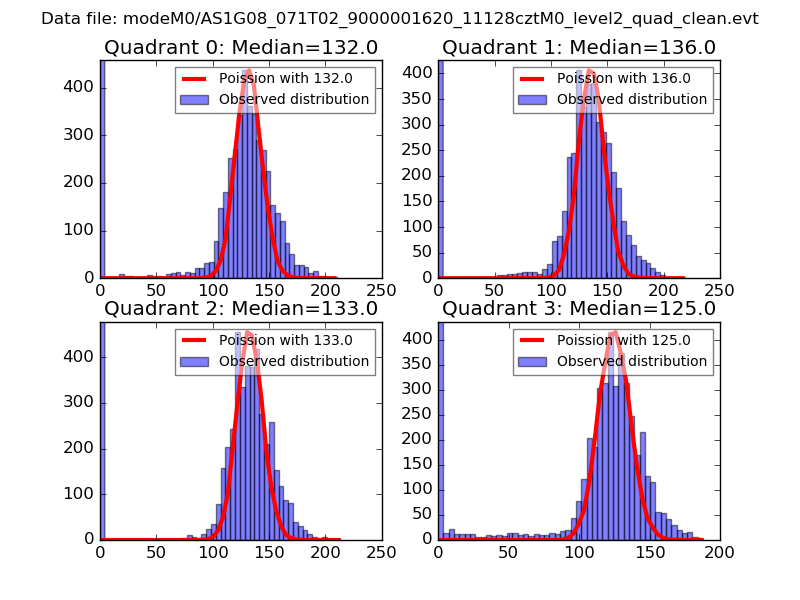 |
 |
| Quadrant-wise count rates Data is divided into 100 sec bins |
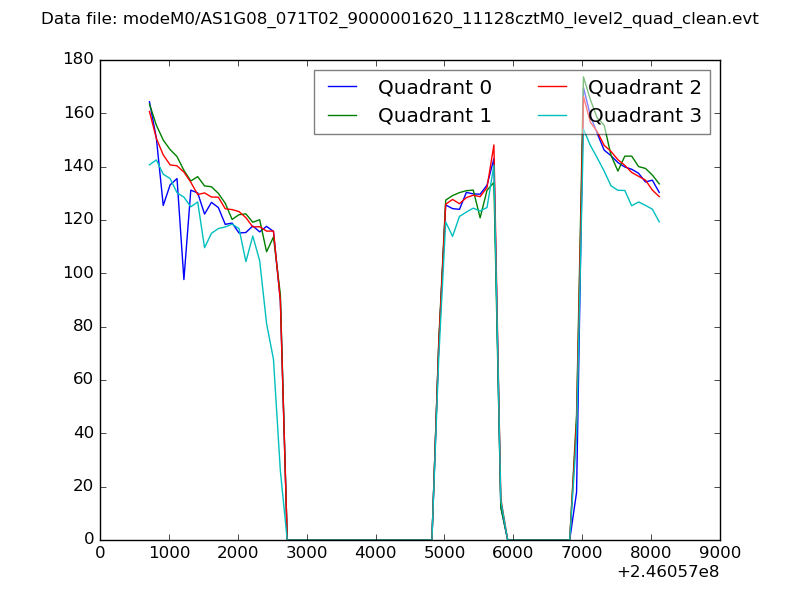 |
|
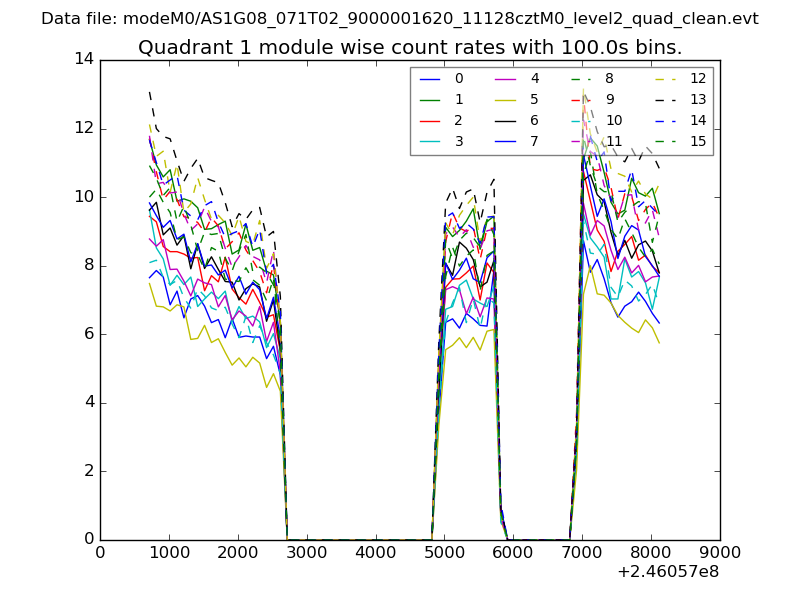
| Module-wise count rates for Quadrant A Data is divided into 100 sec bins |
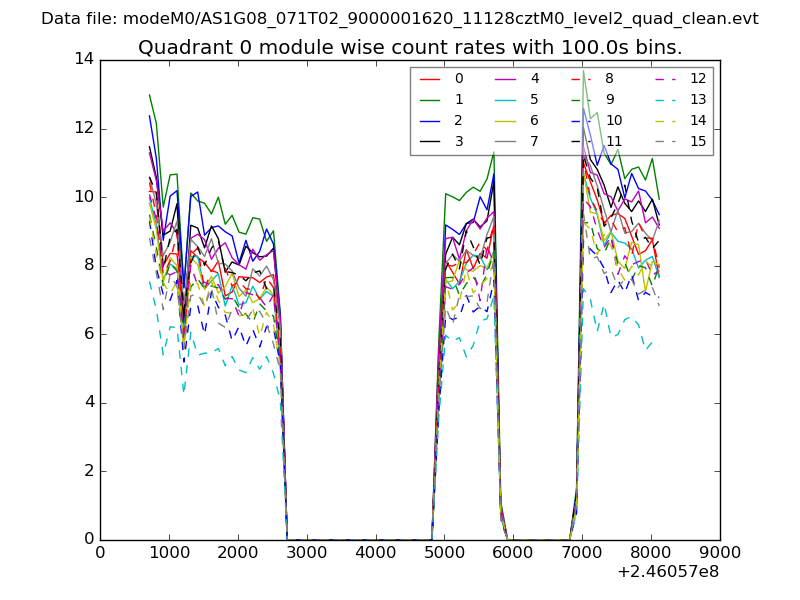 |
 |
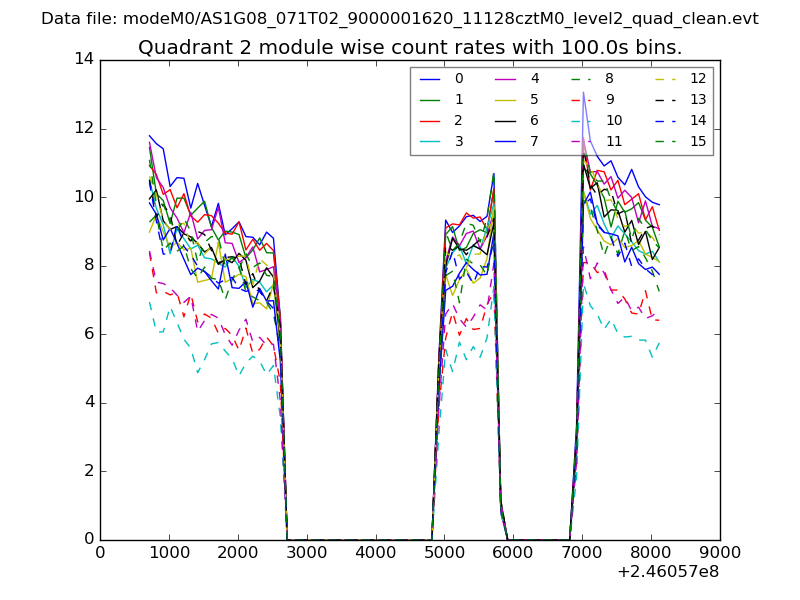
| Module-wise count rates for Quadrant B Data is divided into 100 sec bins |
 |
 |
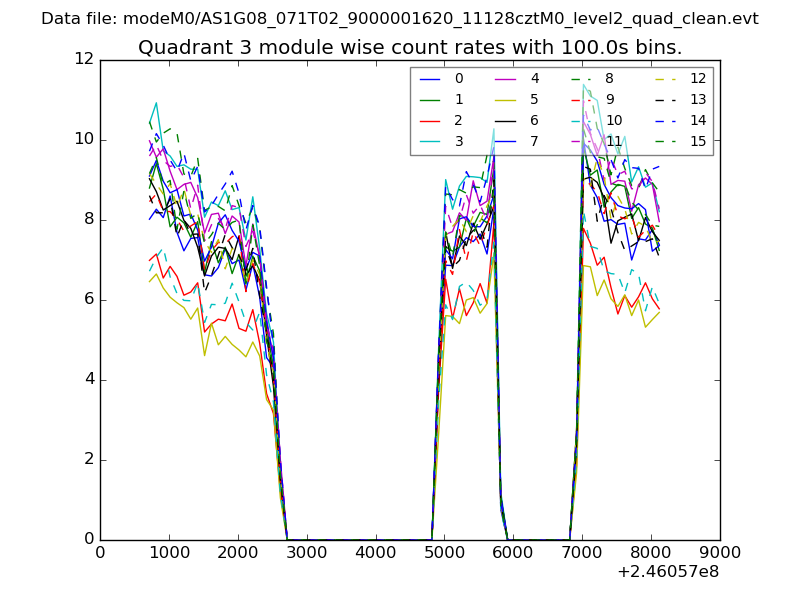
| Module-wise count rates for Quadrant C Data is divided into 100 sec bins |
 |
 |
| Module-wise count rates for Quadrant D Data is divided into 100 sec bins |
 |
 |
| Parameter | Plot |
|---|---|
| CZT HV Monitor | 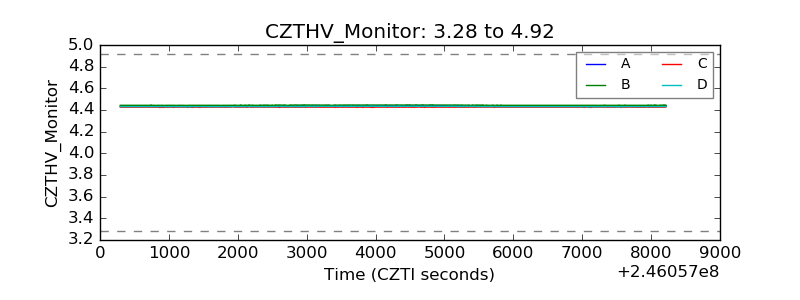 |
| D_VDD | 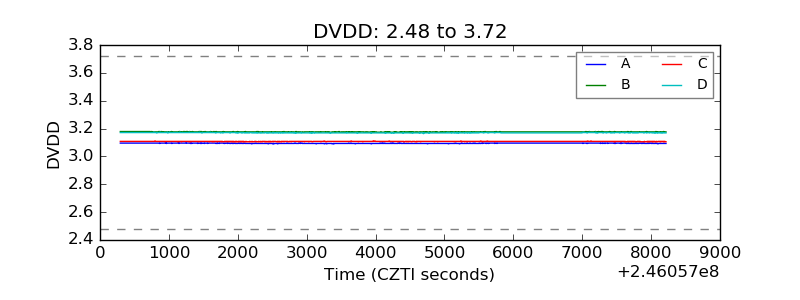 |
| Temperature 1 | 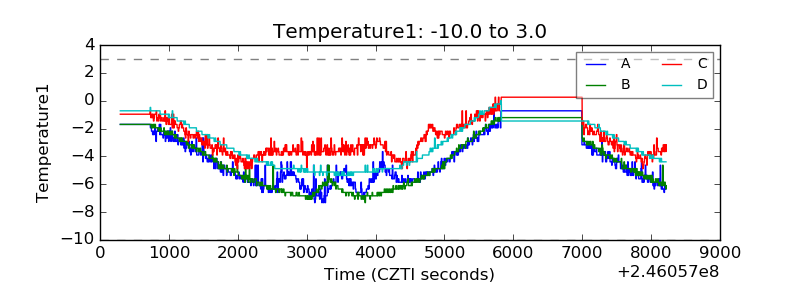 |
| Veto HV Monitor | 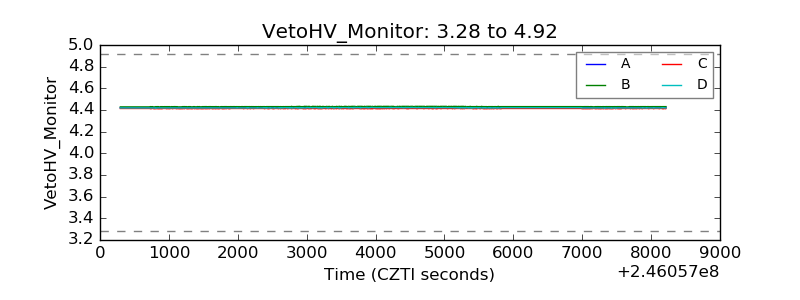 |
| Veto LLD | 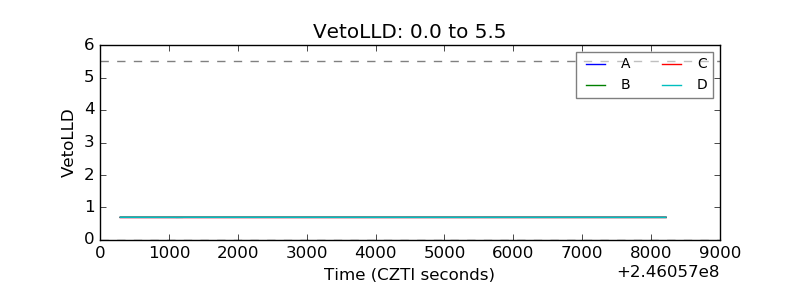 |
| Alpha Counter | 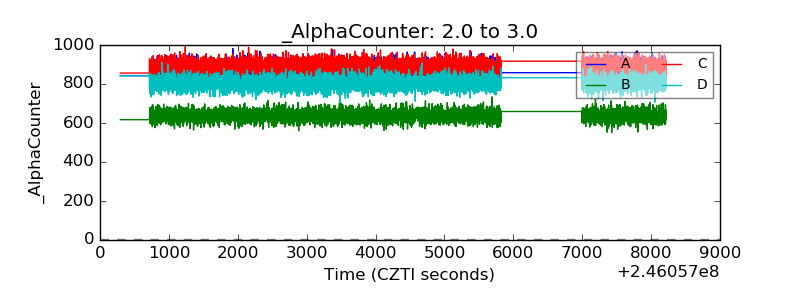 |
| _CPM_Rate | 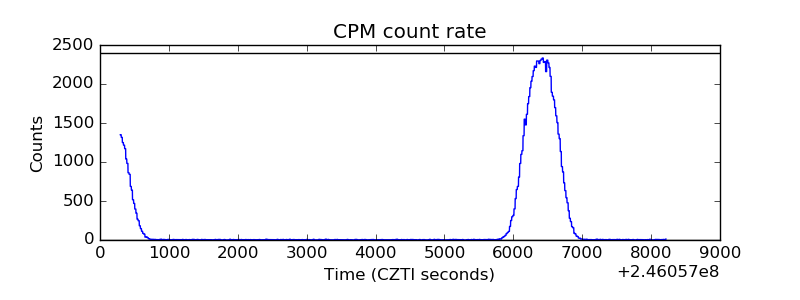 |
| CZT Counter | 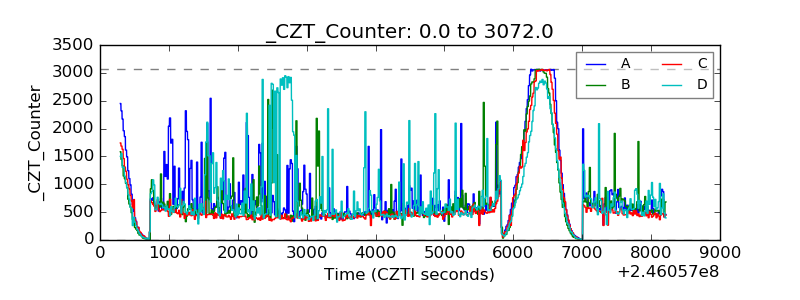 |
| +2.5 Volts monitor |  |
| +5 Volts monitor |  |
| _ROLL_ROT | 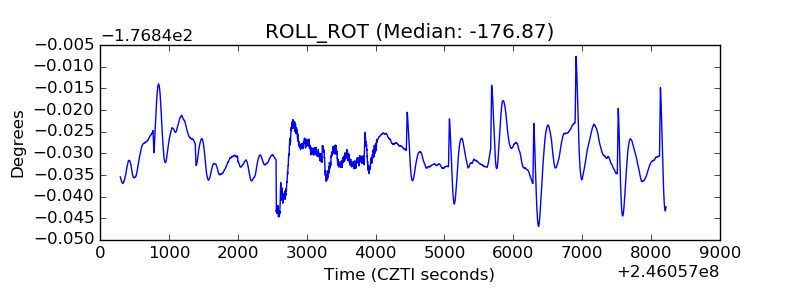 |
| _Roll_DEC | 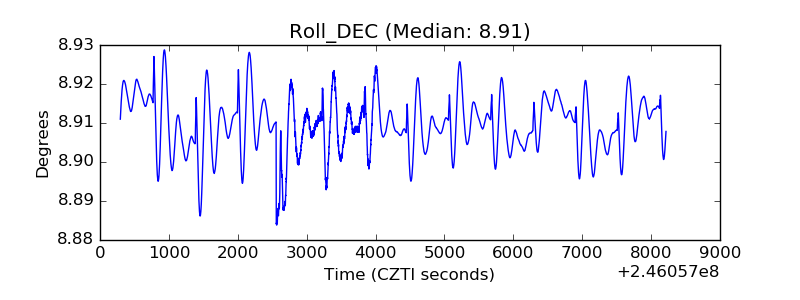 |
| _Roll_RA | 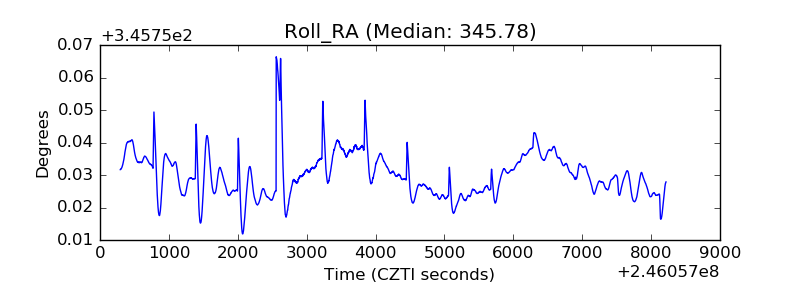 |
| Veto Counter | 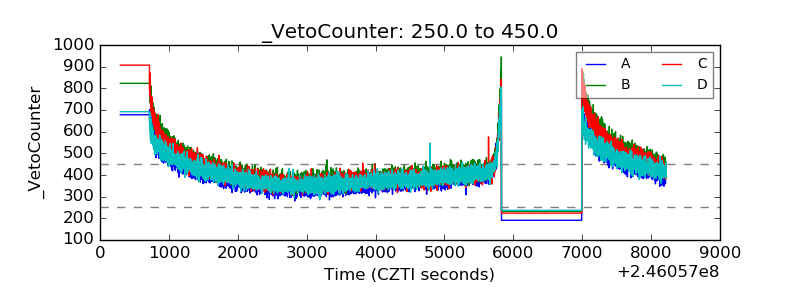 |