| Param | Original file | Final file |
|---|---|---|
| Filename | modeM0/AS1G08_071T02_9000001620_11130cztM0_level2.evt | modeM0/AS1G08_071T02_9000001620_11130cztM0_level2_quad_clean.evt |
| Size (bytes) | 572,610,240 | 80,553,600 |
| Size | 546.1 MB | 76.8 MB |
| Events in quadrant A | 4,553,528 | 504,683 |
| Events in quadrant B | 4,189,146 | 519,011 |
| Events in quadrant C | 3,170,155 | 512,184 |
| Events in quadrant D | 5,004,945 | 466,134 |
| Mode SS | |||
|---|---|---|---|
| Quadrant | BADHDUFLAG | Total packets | Discarded packets |
| A | 0 | 130 | 0 |
| B | 0 | 130 | 0 |
| C | 0 | 130 | 0 |
| D | 0 | 130 | 0 |
| Mode M9 | |||
|---|---|---|---|
| Quadrant | BADHDUFLAG | Total packets | Discarded packets |
| A | 0 | 26 | 0 |
| B | 0 | 26 | 0 |
| C | 0 | 26 | 0 |
| D | 0 | 26 | 0 |
| Mode M0 | |||
|---|---|---|---|
| Quadrant | BADHDUFLAG | Total packets | Discarded packets |
| A | 0 | 17677 | 3 |
| B | 0 | 16482 | 2 |
| C | 0 | 13328 | 2 |
| D | 0 | 19078 | 2 |
| Quadrant | Total seconds | Saturated seconds | Saturation percentage |
|---|---|---|---|
| A | 6257 | 256 | 4.091418% |
| B | 6257 | 251 | 4.011507% |
| C | 6257 | 73 | 1.166693% |
| D | 6257 | 477 | 7.623462% |
Noise dominated data is calculated using 1-second bins in cleaned event files. If a bin has >2000 counts, and if more than 50% of those come from <1% of pixels, then it is considered to be noise-dominated and hence unusable.
| Quadrant | # 1 sec bins | Bins with >0 counts | Bins with >2000 counts | High rate bins dominated by noise | Noise dominated (total time) | Noise dominated (detector-on time) | Marked lightcurve |
|---|---|---|---|---|---|---|---|
| A | 8877 | 6259 | 159 | 159 | 1.79% | 2.54% | 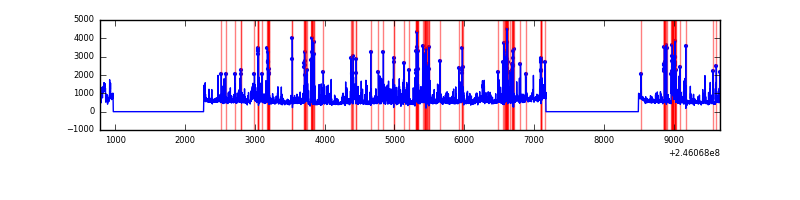 |
| B | 8877 | 6259 | 144 | 144 | 1.62% | 2.30% | 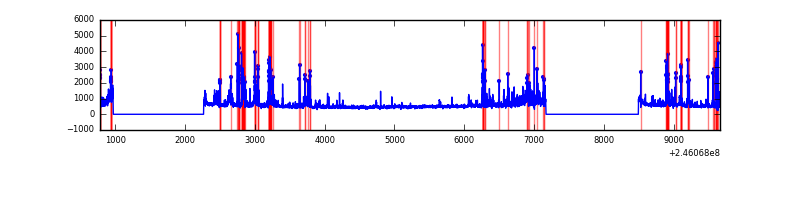 |
| C | 8877 | 6259 | 48 | 48 | 0.54% | 0.77% | 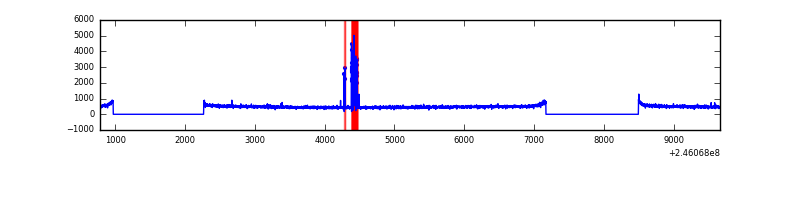 |
| D | 8876 | 6258 | 377 | 377 | 4.25% | 6.02% | 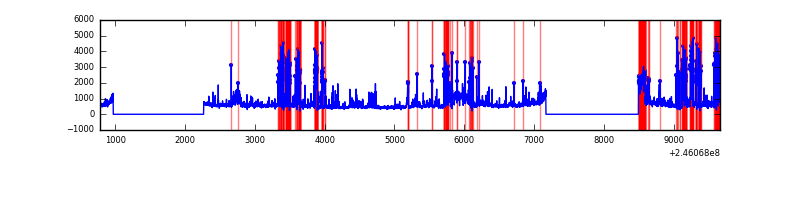 |
Top three noisy pixels from each quadrant. If the there are fewer than three noisy pixels in the level2.evt file, extra rows are filled as -1
| Pixel properties | Quadrant properties | ||||||
|---|---|---|---|---|---|---|---|
| Quadrant | DetID | PixID | Counts | Sigma | Mean | Median | Sigma |
| A | 8 | 5 | 1421142 | 8902.03 | 790 | 772 | 159.6 |
| A | 8 | 15 | 61578 | 381.1 | 790 | 772 | 159.6 |
| A | 11 | 29 | 27750 | 169.08 | 790 | 772 | 159.6 |
| B | 4 | 239 | 623990 | 4166.69 | 799 | 781 | 149.6 |
| B | 10 | 16 | 225271 | 1500.91 | 799 | 781 | 149.6 |
| B | 15 | 204 | 84012 | 556.47 | 799 | 781 | 149.6 |
| C | 9 | 54 | 161185 | 897.9 | 770 | 774 | 178.7 |
| C | 13 | 61 | 5670 | 27.41 | 770 | 774 | 178.7 |
| C | 12 | 4 | 5164 | 24.57 | 770 | 774 | 178.7 |
| D | 10 | 253 | 967120 | 5428.39 | 736 | 717 | 178.0 |
| D | 1 | 52 | 532947 | 2989.59 | 736 | 717 | 178.0 |
| D | 8 | 195 | 260091 | 1456.93 | 736 | 717 | 178.0 |
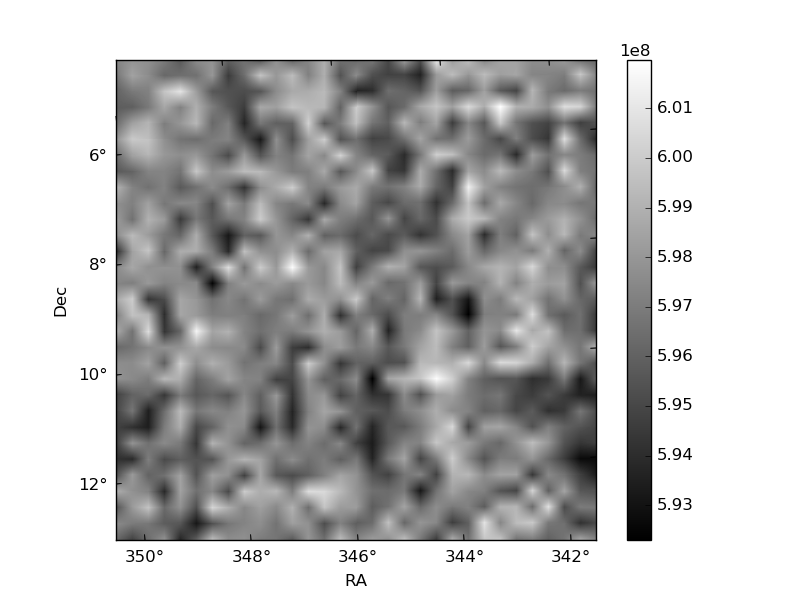
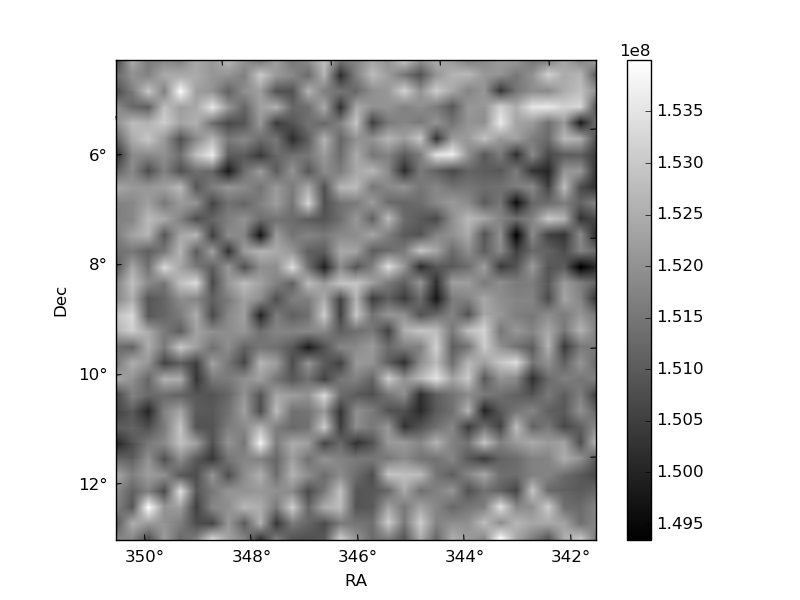
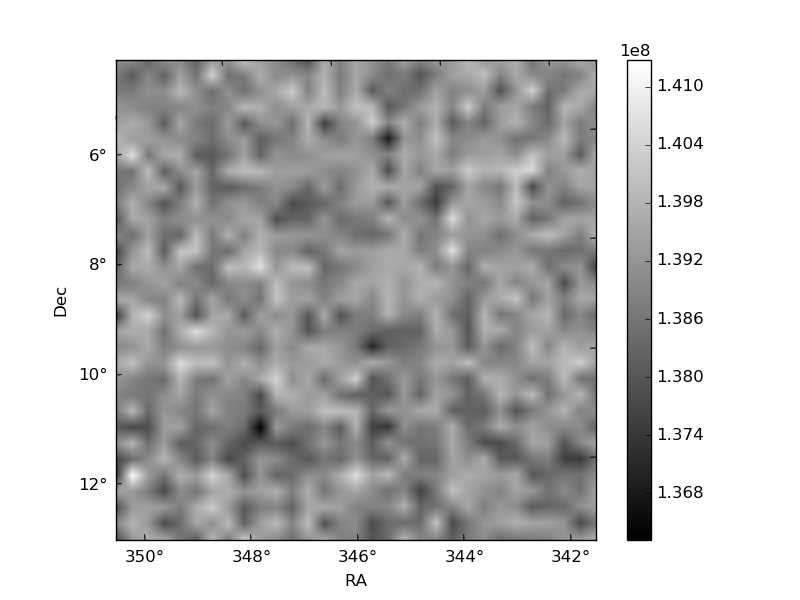
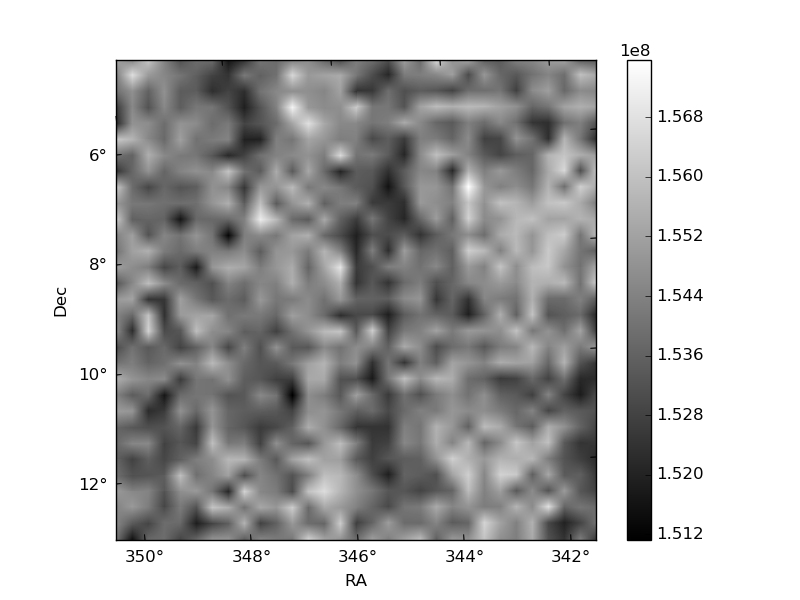
Histogram calculated using DETX and DETY for each event in the final _common_clean file
| Quadrant A | 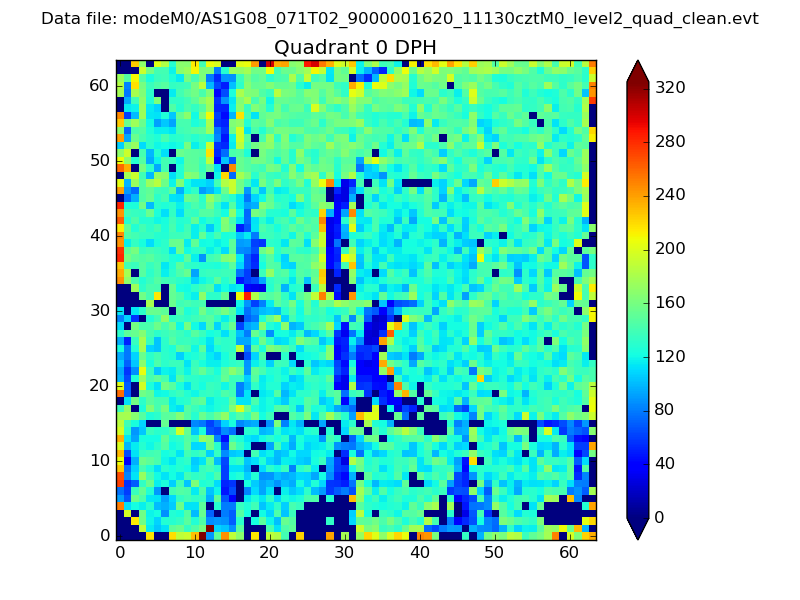 |
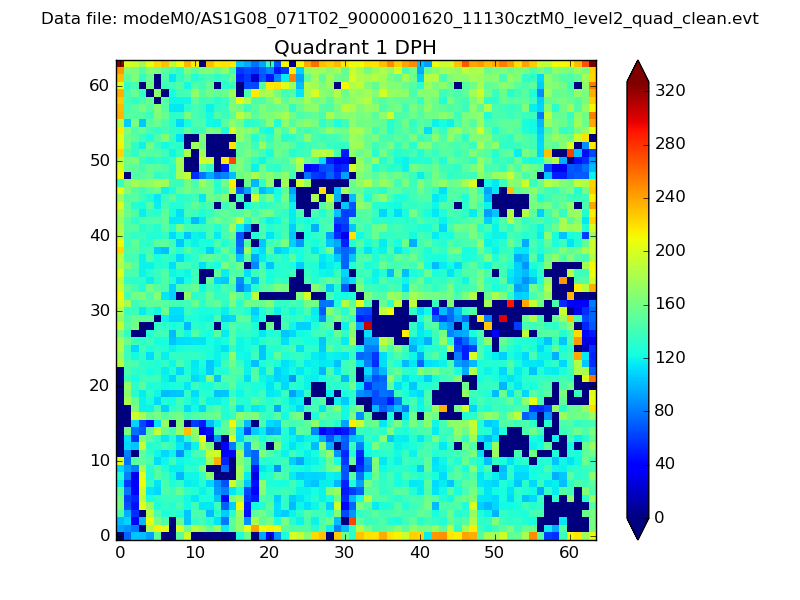 |
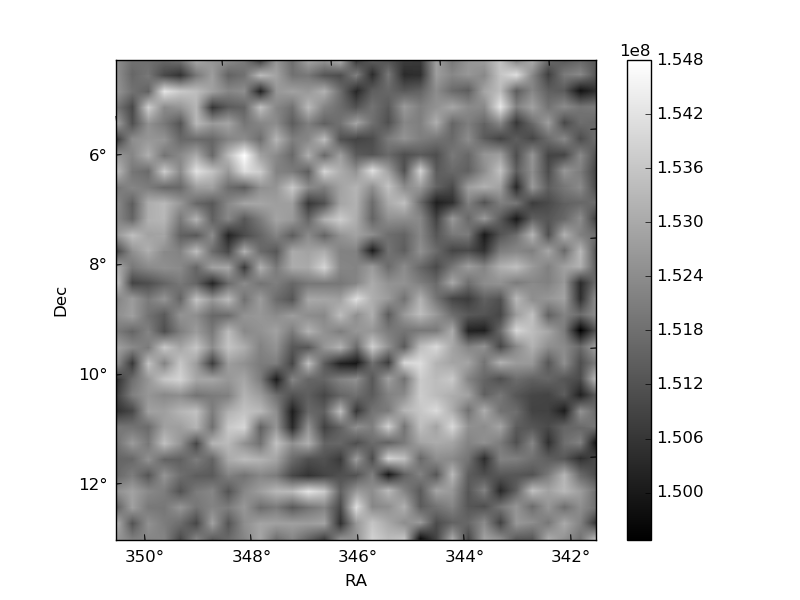
Quadrant B |
|---|---|---|---|
| Quadrant D | 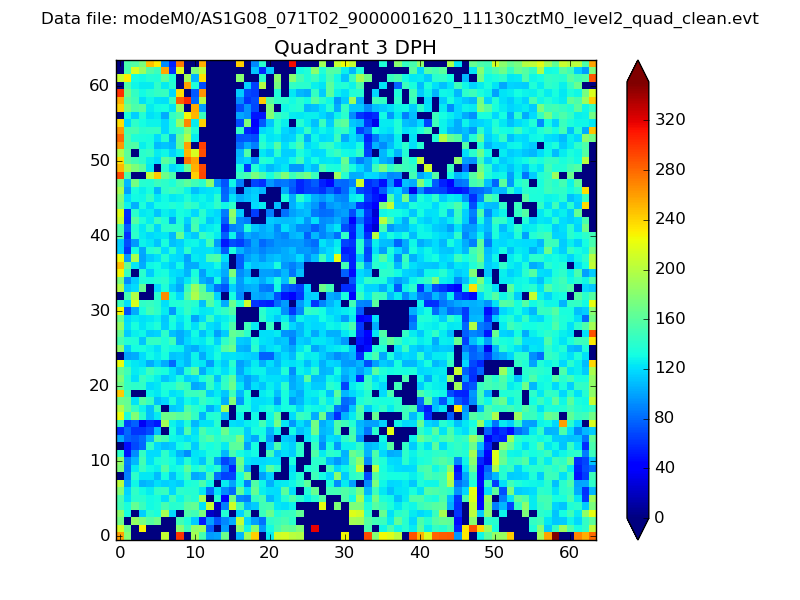 |
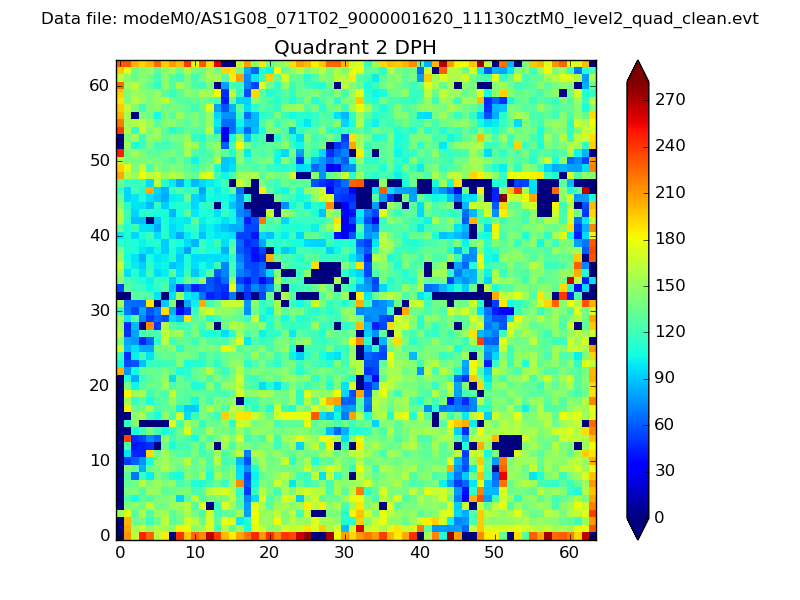 |
Quadrant C |
| Plot type | Count rate plots | Images |
|---|---|---|
| Comparison with Poisson distribution Blue bars denote a histogram of data divided into 1 sec bins. Red curve is a Poisson curve with rate = median count rate of data. |
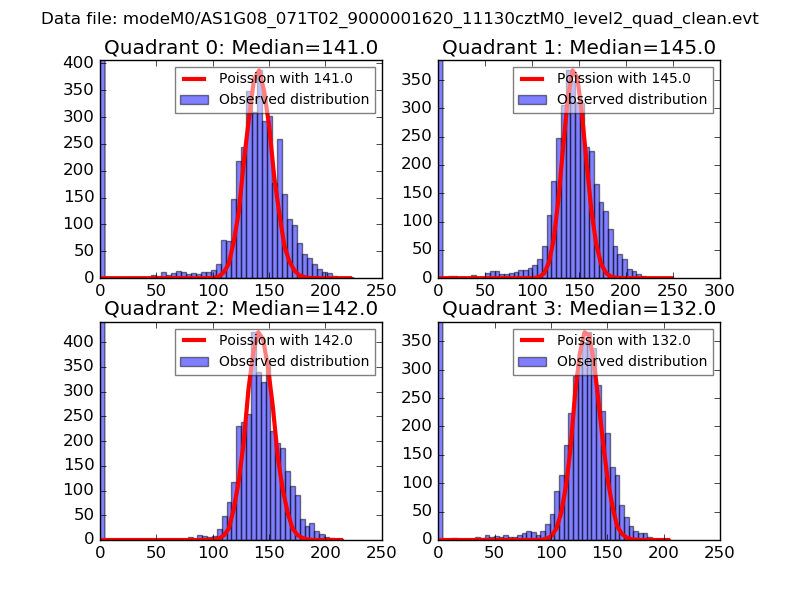 |
 |
| Quadrant-wise count rates Data is divided into 100 sec bins |
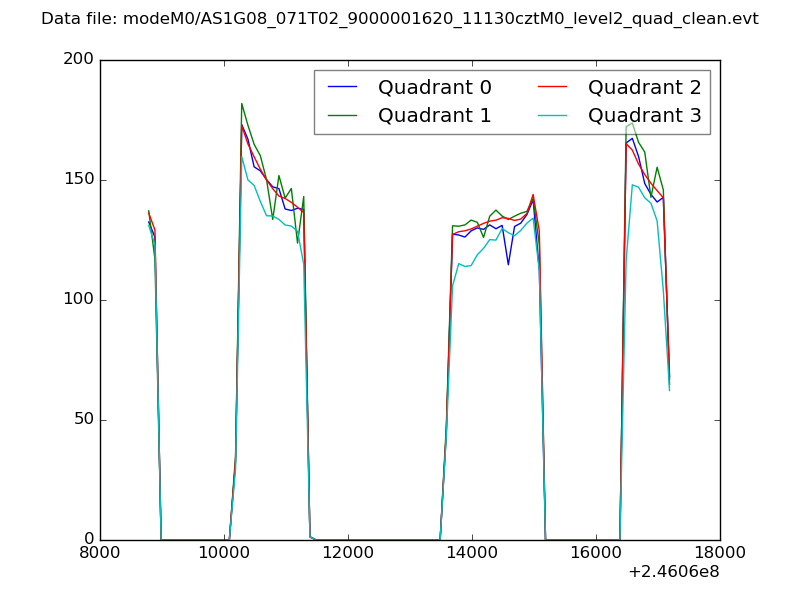 |
|
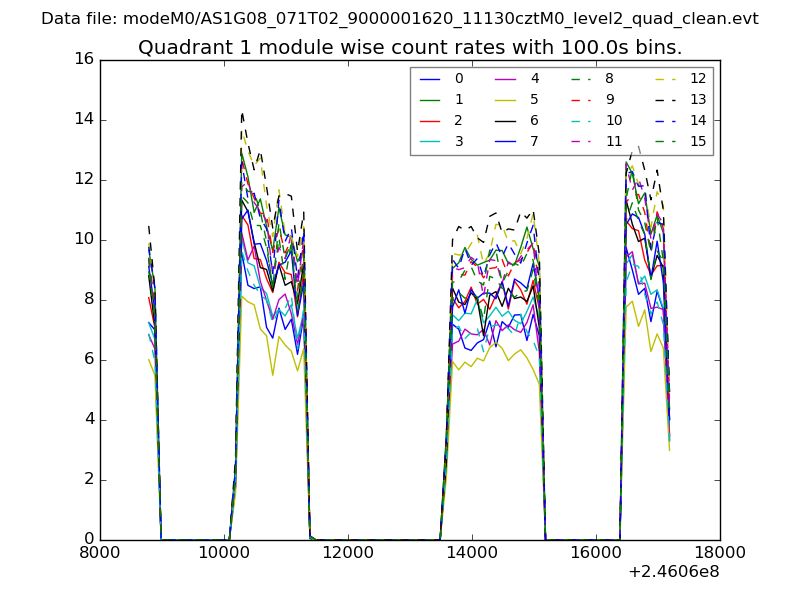
| Module-wise count rates for Quadrant A Data is divided into 100 sec bins |
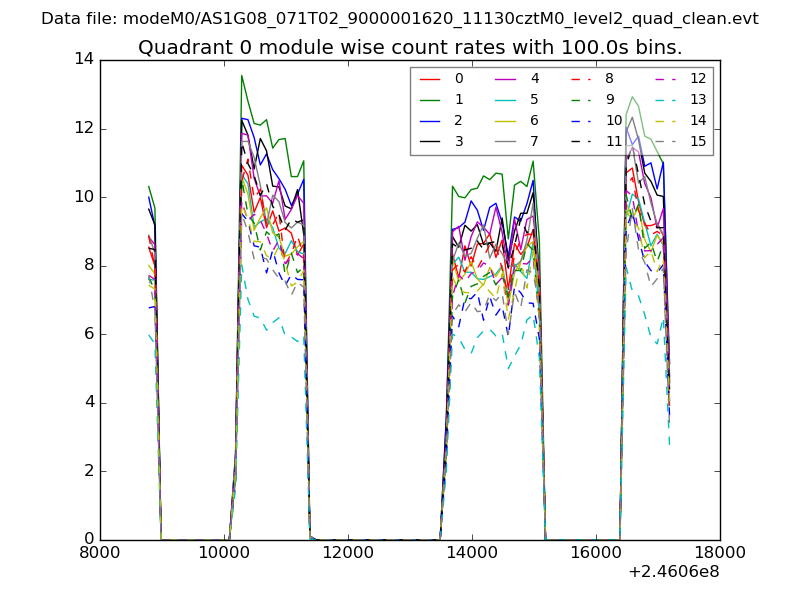 |
 |
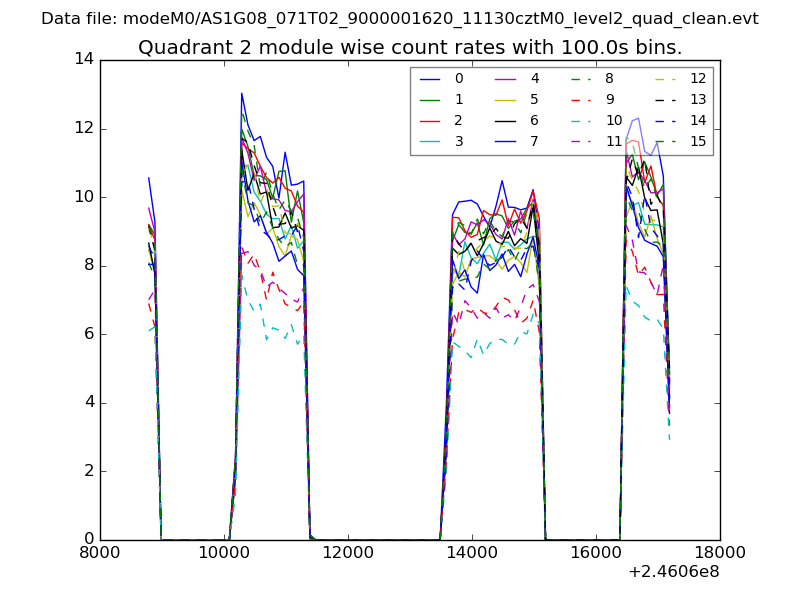
| Module-wise count rates for Quadrant B Data is divided into 100 sec bins |
 |
 |
| Module-wise count rates for Quadrant C Data is divided into 100 sec bins |
 |
 |
| Module-wise count rates for Quadrant D Data is divided into 100 sec bins |
 |
 |
| Parameter | Plot |
|---|---|
| CZT HV Monitor | 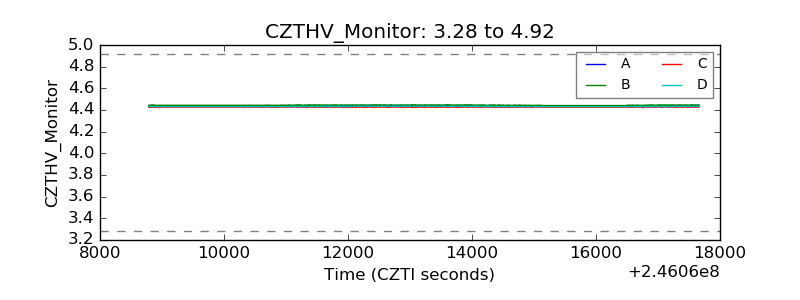 |
| D_VDD | 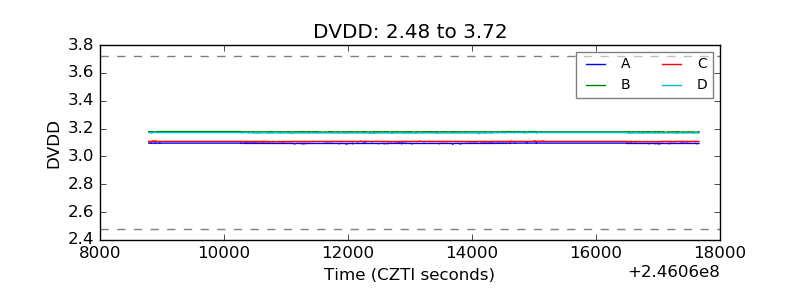 |
| Temperature 1 |  |
| Veto HV Monitor | 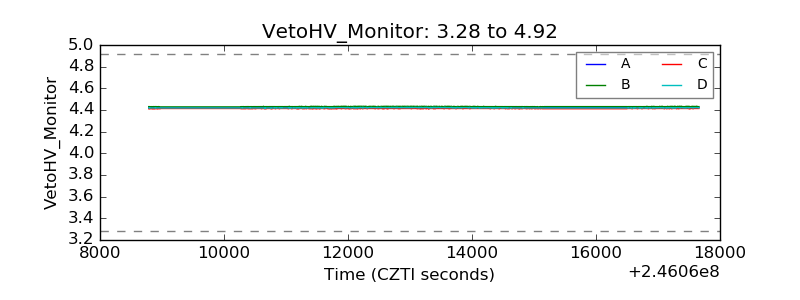 |
| Veto LLD | 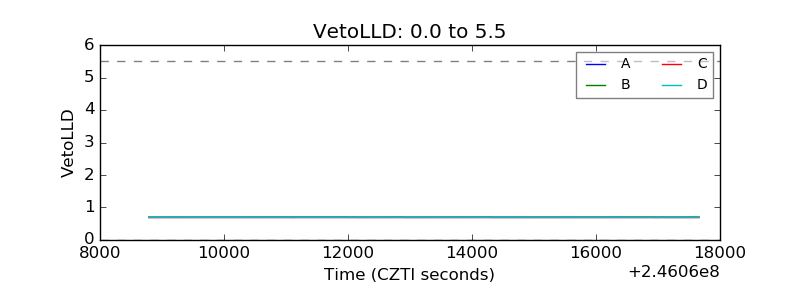 |
| Alpha Counter | 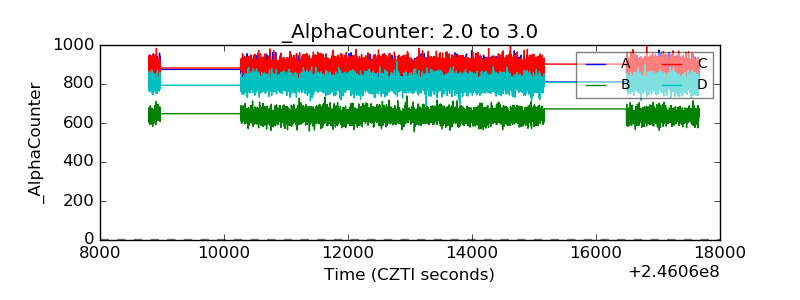 |
| _CPM_Rate | 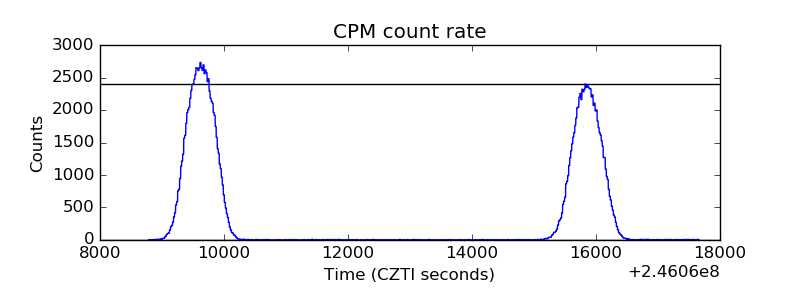 |
| CZT Counter | 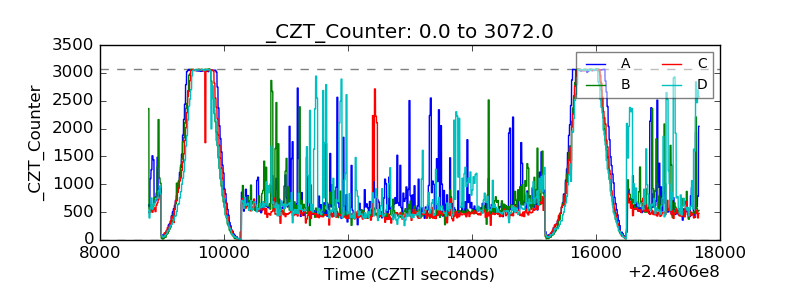 |
| +2.5 Volts monitor |  |
| +5 Volts monitor |  |
| _ROLL_ROT | 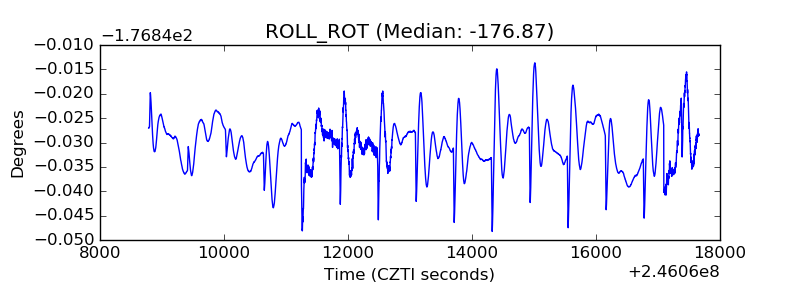 |
| _Roll_DEC | 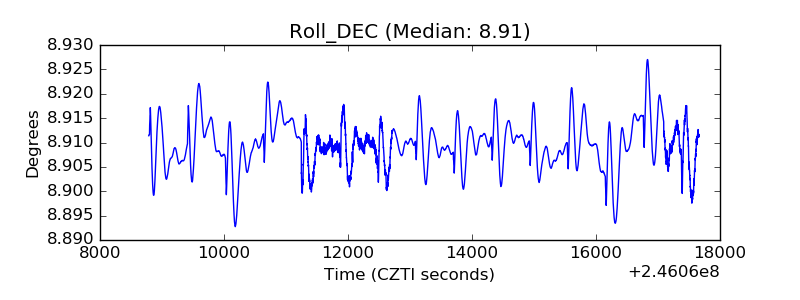 |
| _Roll_RA | 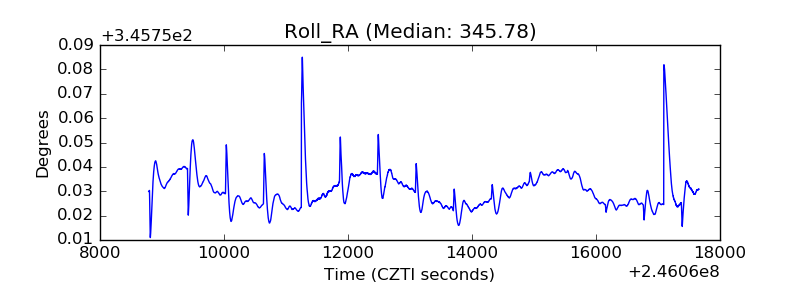 |
| Veto Counter | 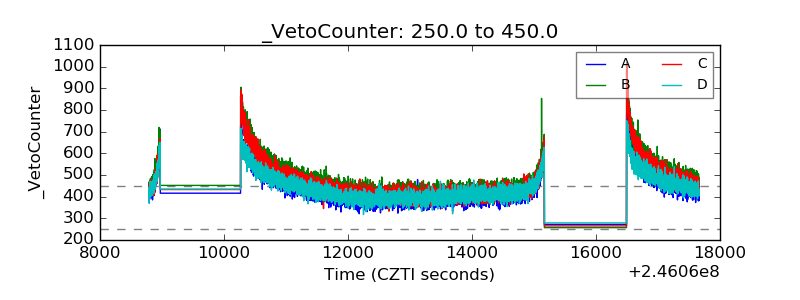 |