| Param | Original file | Final file |
|---|---|---|
| Filename | modeM0/AS1G08_071T02_9000001620_11131cztM0_level2.evt | modeM0/AS1G08_071T02_9000001620_11131cztM0_level2_quad_clean.evt |
| Size (bytes) | 555,232,320 | 69,163,200 |
| Size | 529.5 MB | 66.0 MB |
| Events in quadrant A | 4,135,555 | 416,135 |
| Events in quadrant B | 4,108,715 | 424,995 |
| Events in quadrant C | 3,091,030 | 420,450 |
| Events in quadrant D | 5,043,715 | 383,218 |
| Mode SS | |||
|---|---|---|---|
| Quadrant | BADHDUFLAG | Total packets | Discarded packets |
| A | 0 | 130 | 0 |
| B | 0 | 130 | 0 |
| C | 0 | 130 | 0 |
| D | 0 | 130 | 0 |
| Mode M9 | |||
|---|---|---|---|
| Quadrant | BADHDUFLAG | Total packets | Discarded packets |
| A | 0 | 24 | 0 |
| B | 0 | 24 | 0 |
| C | 0 | 24 | 0 |
| D | 0 | 25 | 0 |
| Mode M0 | |||
|---|---|---|---|
| Quadrant | BADHDUFLAG | Total packets | Discarded packets |
| A | 0 | 16278 | 3 |
| B | 0 | 16272 | 2 |
| C | 0 | 13266 | 2 |
| D | 0 | 19337 | 2 |
| Quadrant | Total seconds | Saturated seconds | Saturation percentage |
|---|---|---|---|
| A | 6440 | 143 | 2.220497% |
| B | 6440 | 243 | 3.773292% |
| C | 6440 | 11 | 0.170807% |
| D | 6440 | 448 | 6.956522% |
Noise dominated data is calculated using 1-second bins in cleaned event files. If a bin has >2000 counts, and if more than 50% of those come from <1% of pixels, then it is considered to be noise-dominated and hence unusable.
| Quadrant | # 1 sec bins | Bins with >0 counts | Bins with >2000 counts | High rate bins dominated by noise | Noise dominated (total time) | Noise dominated (detector-on time) | Marked lightcurve |
|---|---|---|---|---|---|---|---|
| A | 7780 | 6441 | 91 | 91 | 1.17% | 1.41% | 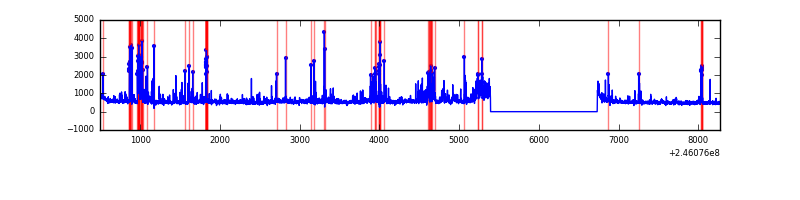 |
| B | 7780 | 6441 | 97 | 97 | 1.25% | 1.51% | 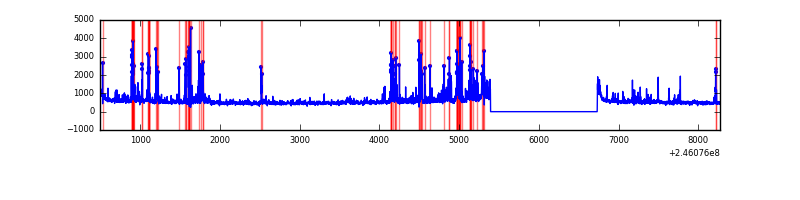 |
| C | 7780 | 6441 | 2 | 2 | 0.03% | 0.03% | 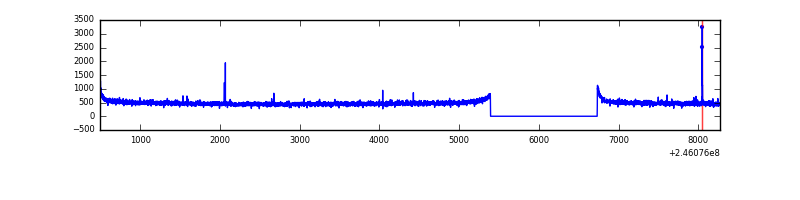 |
| D | 7780 | 6441 | 377 | 377 | 4.85% | 5.85% | 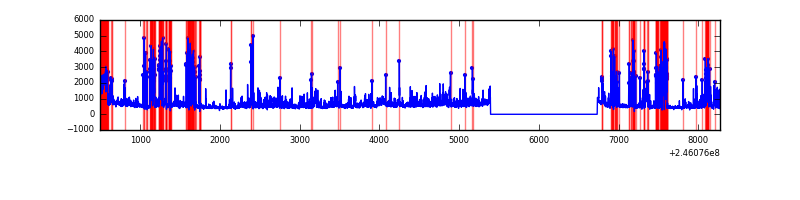 |
Top three noisy pixels from each quadrant. If the there are fewer than three noisy pixels in the level2.evt file, extra rows are filled as -1
| Pixel properties | Quadrant properties | ||||||
|---|---|---|---|---|---|---|---|
| Quadrant | DetID | PixID | Counts | Sigma | Mean | Median | Sigma |
| A | 8 | 5 | 848461 | 5180.22 | 808 | 792 | 163.6 |
| A | 8 | 15 | 135232 | 821.58 | 808 | 792 | 163.6 |
| A | 11 | 29 | 20059 | 117.74 | 808 | 792 | 163.6 |
| B | 4 | 239 | 521074 | 3367.19 | 814 | 796 | 154.5 |
| B | 10 | 16 | 155154 | 998.99 | 814 | 796 | 154.5 |
| B | 15 | 204 | 106281 | 682.69 | 814 | 796 | 154.5 |
| C | 9 | 54 | 15542 | 80.76 | 788 | 794 | 182.6 |
| C | 13 | 61 | 5738 | 27.07 | 788 | 794 | 182.6 |
| C | 12 | 4 | 2997 | 12.06 | 788 | 794 | 182.6 |
| D | 10 | 253 | 817321 | 4541.96 | 750 | 731 | 179.8 |
| D | 11 | 129 | 260470 | 1444.69 | 750 | 731 | 179.8 |
| D | 5 | 222 | 239578 | 1328.49 | 750 | 731 | 179.8 |
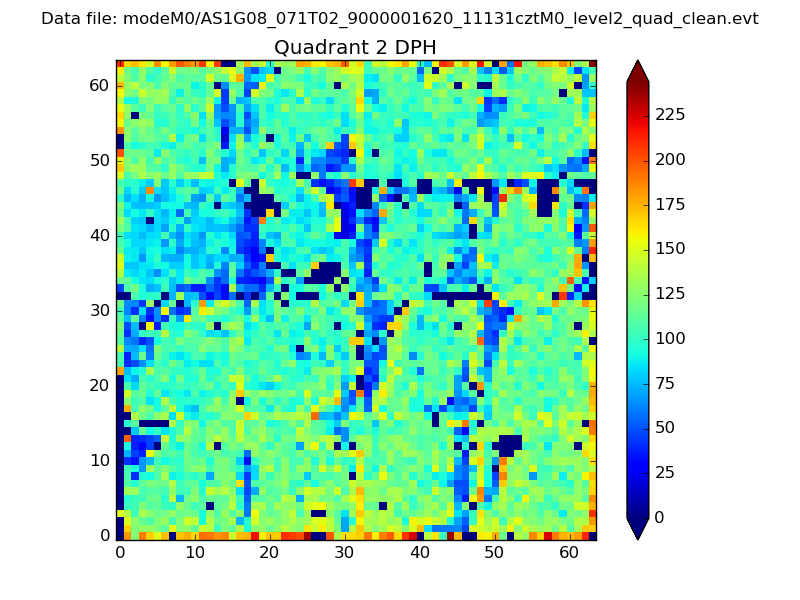
Histogram calculated using DETX and DETY for each event in the final _common_clean file
| Quadrant A | 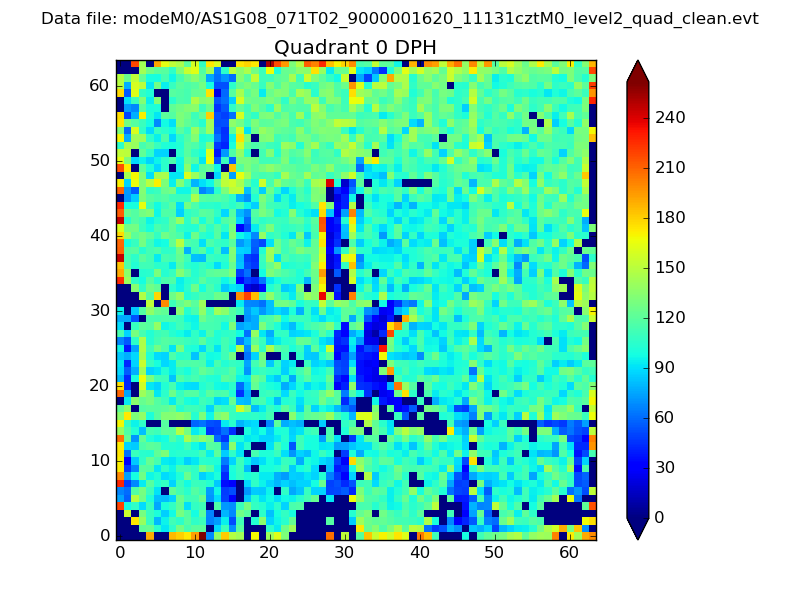 |
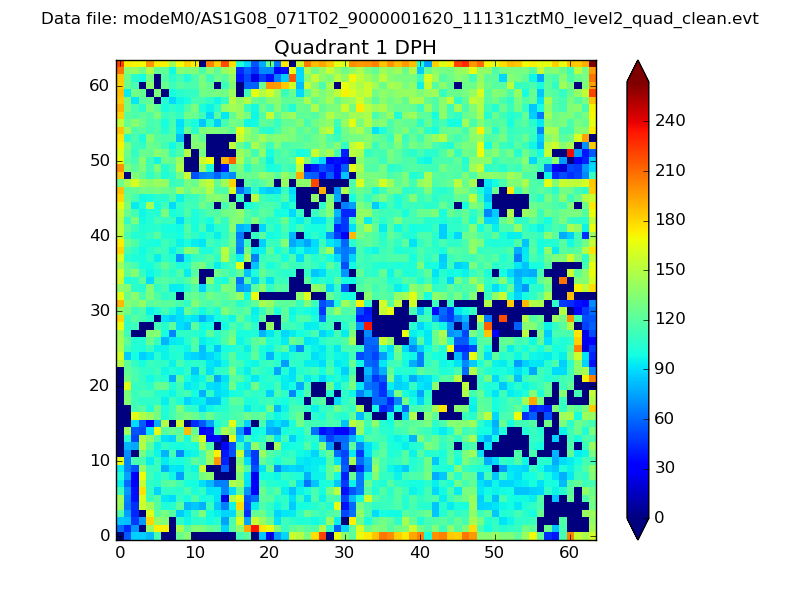 |
Quadrant B |
|---|---|---|---|
| Quadrant D | 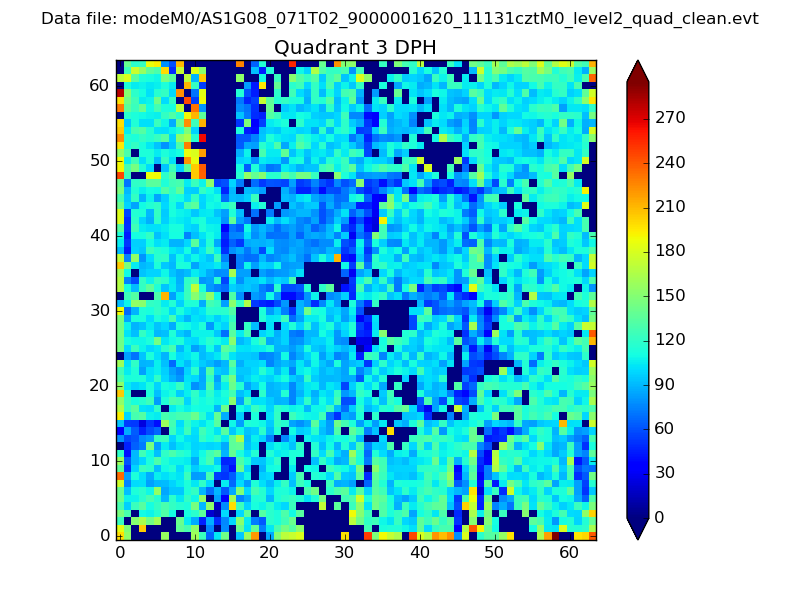 |
 |
Quadrant C |
| Plot type | Count rate plots | Images |
|---|---|---|
| Comparison with Poisson distribution Blue bars denote a histogram of data divided into 1 sec bins. Red curve is a Poisson curve with rate = median count rate of data. |
 |
 |
| Quadrant-wise count rates Data is divided into 100 sec bins |
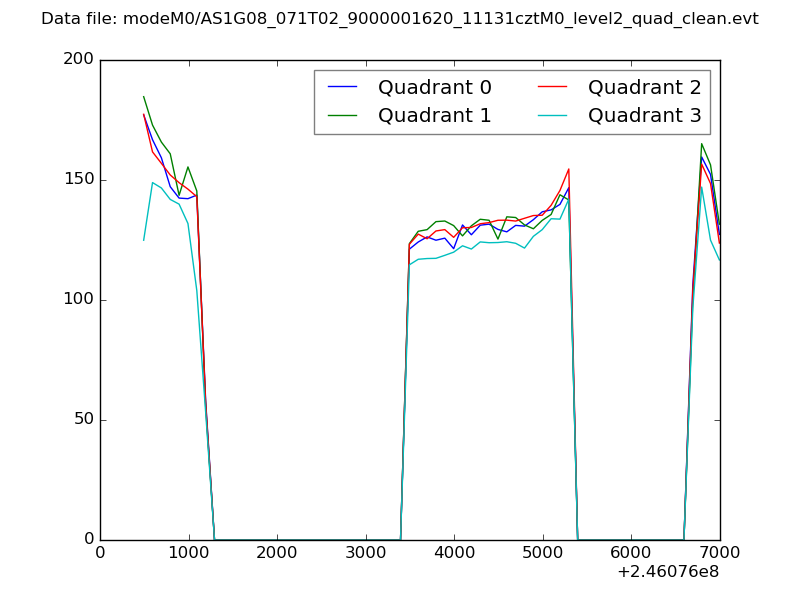 |
|
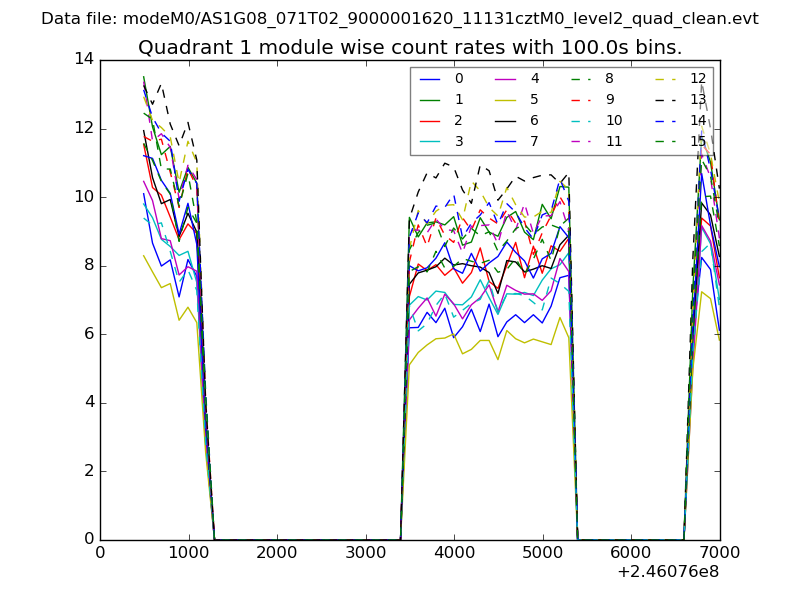
| Module-wise count rates for Quadrant A Data is divided into 100 sec bins |
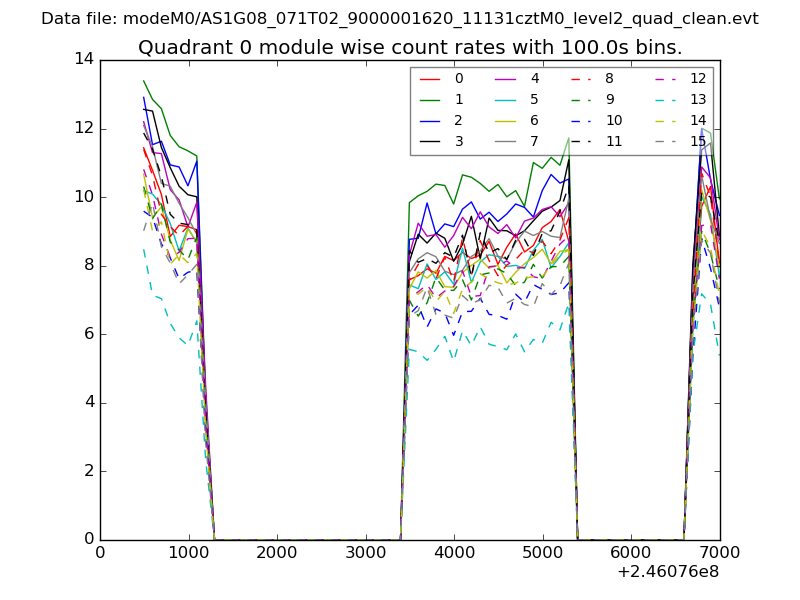 |
 |
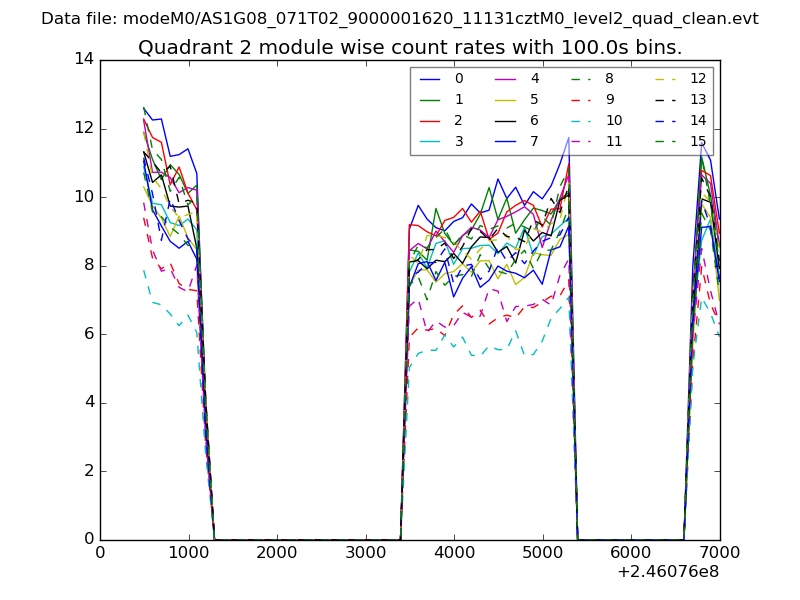
| Module-wise count rates for Quadrant B Data is divided into 100 sec bins |
 |
 |
| Module-wise count rates for Quadrant C Data is divided into 100 sec bins |
 |
 |
| Module-wise count rates for Quadrant D Data is divided into 100 sec bins |
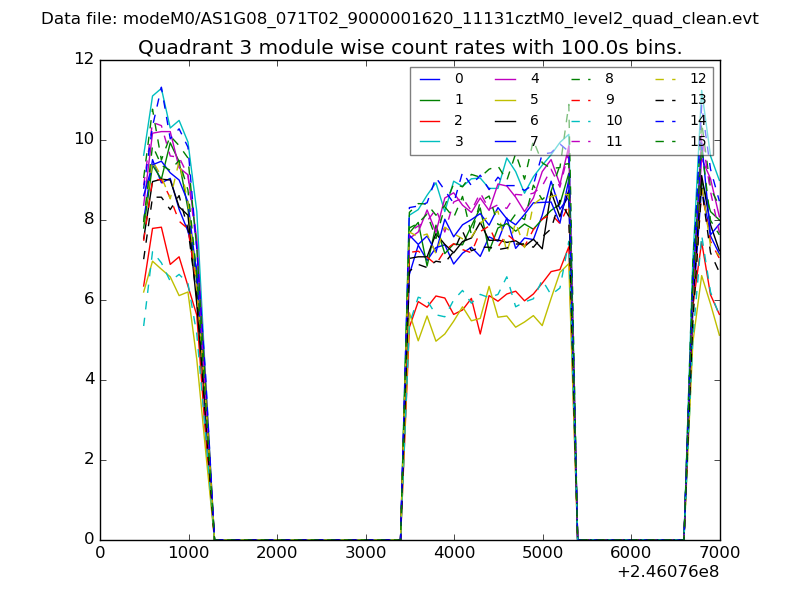 |
 |
| Parameter | Plot |
|---|---|
| CZT HV Monitor | 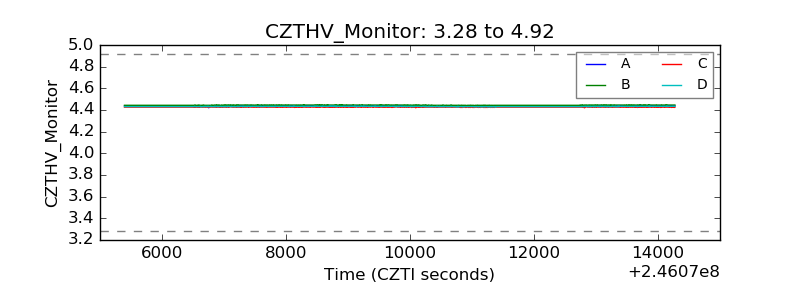 |
| D_VDD | 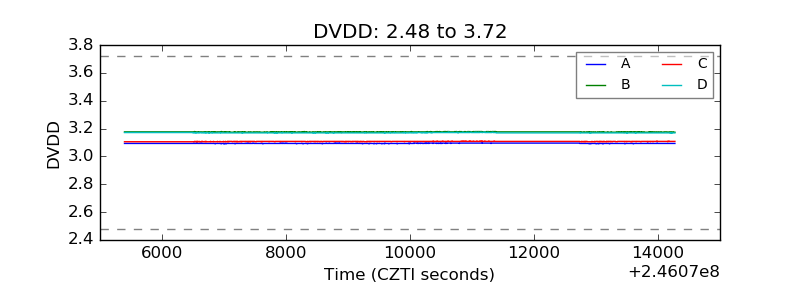 |
| Temperature 1 | 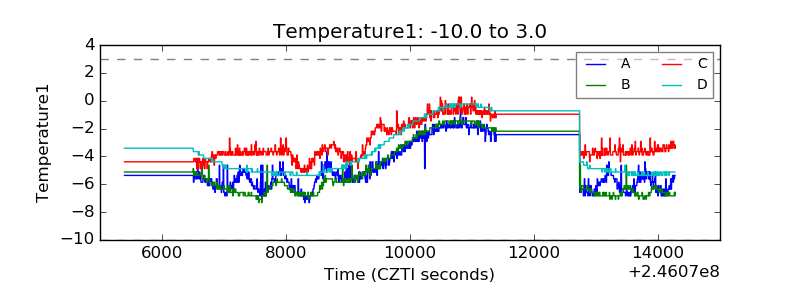 |
| Veto HV Monitor |  |
| Veto LLD | 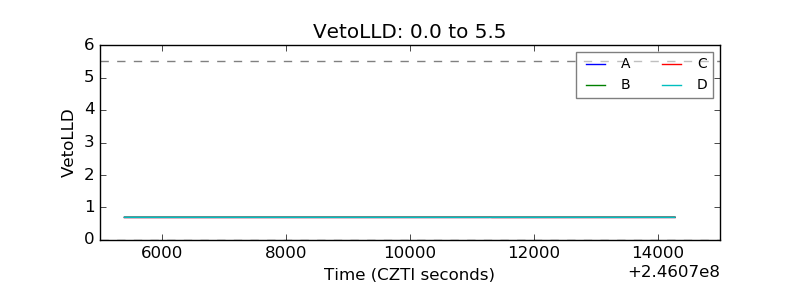 |
| Alpha Counter | 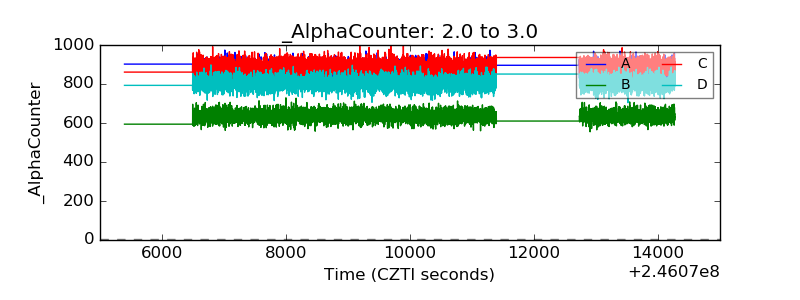 |
| _CPM_Rate | 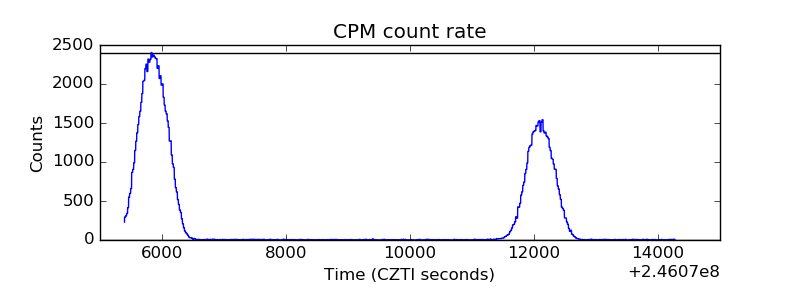 |
| CZT Counter | 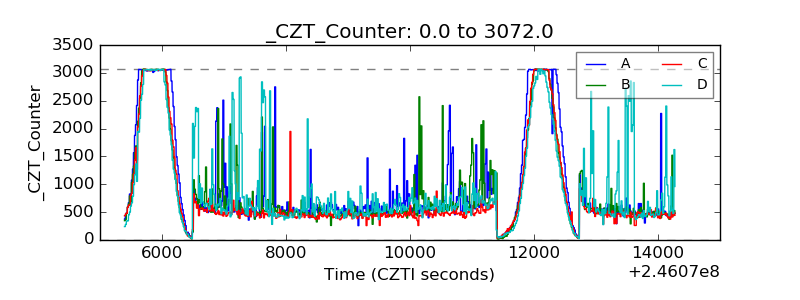 |
| +2.5 Volts monitor | 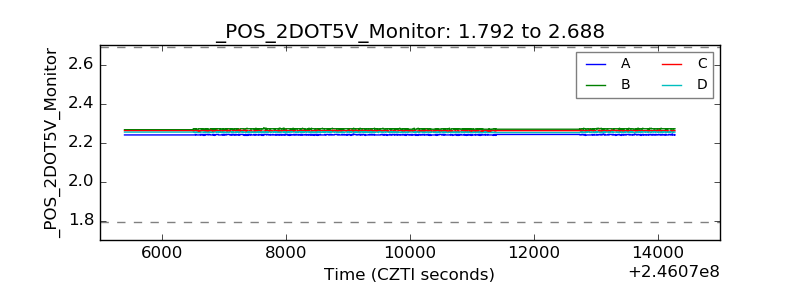 |
| +5 Volts monitor |  |
| _ROLL_ROT |  |
| _Roll_DEC | 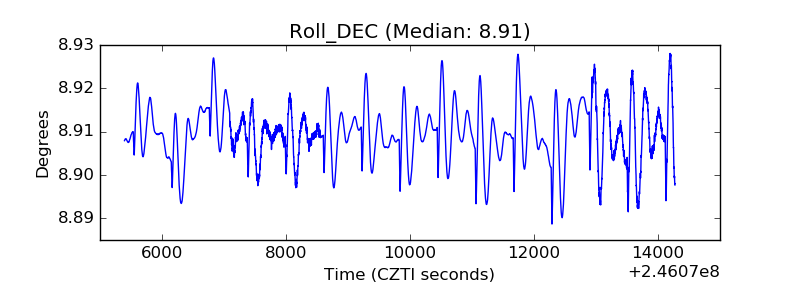 |
| _Roll_RA | 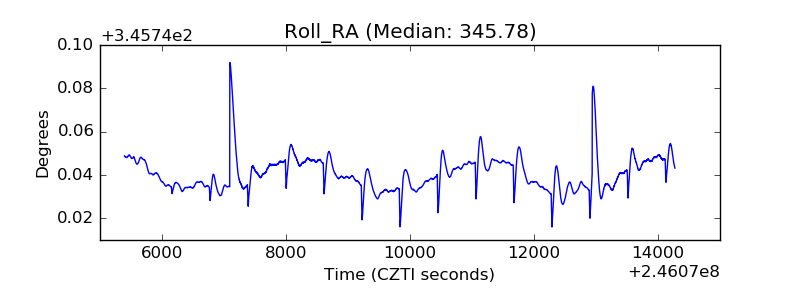 |
| Veto Counter | 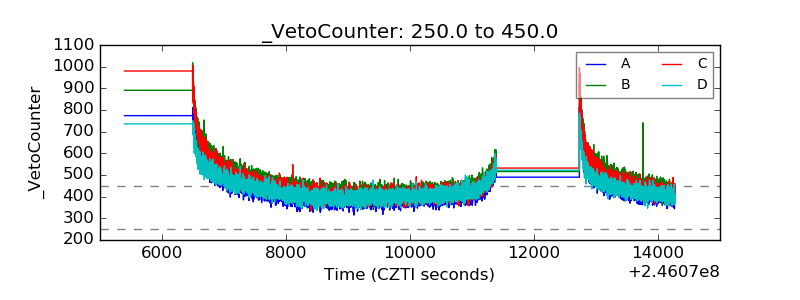 |